Parshav2304/GarudaRush
GitHub: Parshav2304/GarudaRush
基于机器学习的 DDoS 攻击实时检测与告警系统,通过远程网络 Agent 捕获数据包并提取流量特征,由分类模型判定威胁并在可视化仪表板上呈现。
Stars: 0 | Forks: 1
# 🦅 GarudaRush - 基于 ML 增强的 DDoS 检测系统
一个全面且可用于生产环境的 Web 应用程序,利用机器学习进行实时网络流量监控和 DDoS 攻击检测。
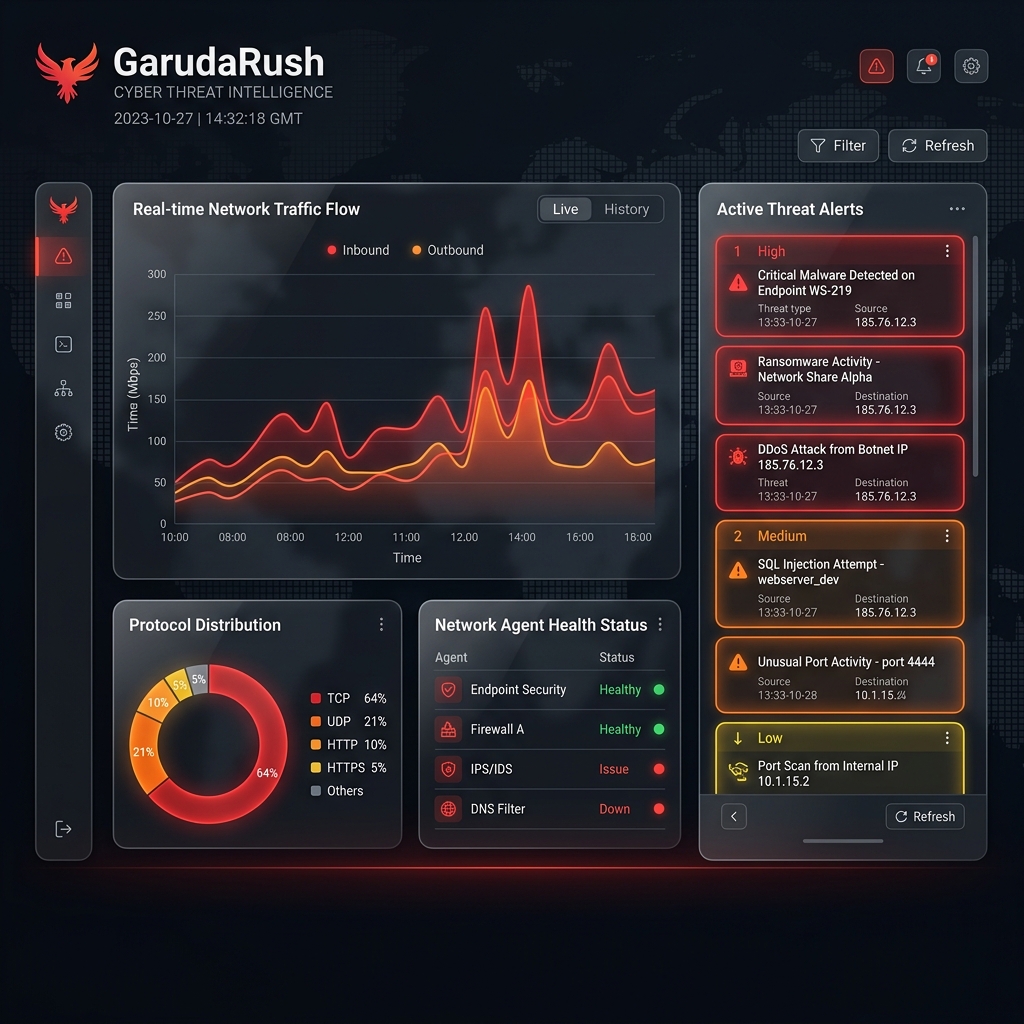
## ✨ 功能 ### 🔐 身份验证与安全 - 基于 JWT 的安全身份验证 - 用户注册和登录 - 密码强度验证 - 受保护的路由 - 用户资料管理 ### 📊 仪表板 - 通过实时图表进行流量监控 - 系统指标和统计数据 - ML 模型性能指标 - 攻击分布可视化 - Agent 状态监控 - 检测统计数据 ### 🚨 告警管理 - 实时安全告警 - 按严重程度、状态和攻击类型过滤 - 确认和解决告警 - 告警摘要和趋势 - 详细的告警信息 ### 📡 流量监控 - 实时流量流可视化 - 协议分布分析 - 流量统计和指标 - 历史数据导出 - 时间范围过滤 ### ⚙️ 设置 - 资料管理 - 密码修改 - 用户偏好设置 - 主题定制 ## 🛠️ 技术栈 ### 前端 - **React 18** - UI 框架 - **React Router** - 导航 - **Chart.js** - 数据可视化 - **Axios** - HTTP 客户端 - **React Toastify** - 通知 - **CSS3** - 现代样式 ### 后端 - **Flask** - Python Web 框架 - **MongoDB** - 数据库 - **JWT** - 身份验证 - **PyShark** - 网络数据包捕获 - **Scikit-learn** - 机器学习 - **NumPy/Pandas** - 数据处理 ## 📋 前置条件 - Python 3.8+ - Node.js 16+ - MongoDB 4.4+ - npm 或 yarn ## 🚀 安装说明 ### 后端设置 1. 导航至 backend 目录: ``` cd backend ``` 2. 创建虚拟环境: ``` python -m venv venv source venv/bin/activate # On Windows: venv\Scripts\activate ``` 3. 安装依赖项: ``` pip install -r requirements.txt ``` 4. 在 backend 目录中创建 `.env` 文件: ``` SECRET_KEY=your-secret-key-here JWT_SECRET_KEY=your-jwt-secret-key-here MONGO_URI=mongodb://localhost:27017/garudarush MONGO_DB_NAME=garudarush FRONTEND_URL=http://localhost:3000 PORT=5000 FLASK_ENV=development ``` 5. 启动后端服务器: ``` python app.py ``` 后端将在 `http://localhost:5000` 上运行 ### 前端设置 1. 导航至 frontend 目录: ``` cd frontend ``` 2. 安装依赖项: ``` npm install ``` 3. 在 frontend 目录中创建 `.env` 文件: ``` REACT_APP_API_URL=http://localhost:5000/api ``` 4. 启动开发服务器: ``` npm start ``` 前端将在 `http://localhost:3000` 上运行 ## 📁 项目结构 ``` garudarush/ ├── backend/ │ ├── app.py # Flask application entry point │ ├── agent.py # Network monitoring agent │ ├── requirements.txt # Python dependencies │ ├── routes/ │ │ ├── auth.py # Authentication routes │ │ ├── dashboard.py # Dashboard routes │ │ ├── traffic.py # Traffic monitoring routes │ │ └── alerts.py # Alerts routes │ └── services/ │ └── ml_detector.py # ML detection service │ └── frontend/ ├── public/ │ └── index.html ├── src/ │ ├── App.js # Main app component │ ├── components/ │ │ ├── Auth/ # Login/Register components │ │ ├── Dashboard/ # Dashboard component │ │ ├── Alerts/ # Alerts component │ │ ├── Traffic/ # Traffic component │ │ ├── Settings/ # Settings component │ │ └── Layout/ # Navigation layout │ └── services/ │ └── api.js # API service layer └── package.json ``` ## 🎯 用法 ### 启动应用程序 1. **启动 MongoDB**: ``` mongod ``` 2. **启动后端**(在 backend 目录中): ``` python app.py ``` 3. **启动前端**(在 frontend 目录中): ``` npm start ``` 4. **访问应用程序**: - 打开浏览器并导航至 `http://localhost:3000` - 注册新账户或登录 - 探索仪表板和功能 ### 运行网络 Agent 要监控网络流量,请运行 agent: ``` python backend/agent.py \ --agent-id agent-001 \ --interface eth0 \ --api-url http://localhost:5000/api \ --username your-email@example.com \ --password your-password ``` **注意**:在 Windows 上,您可能需要使用不同的接口名称(例如 `Wi-Fi`、`Ethernet`)或使用 WSL。 ## 🔧 配置 ### 后端配置 编辑 backend 目录中的 `.env` 文件以配置: - 数据库连接 - JWT 密钥 - CORS 设置 - 端口号 ### 前端配置 编辑 frontend 目录中的 `.env` 文件以配置: - API endpoint URL ## 📊 API Endpoints ### 身份验证 - `POST /api/auth/register` - 注册新用户 - `POST /api/auth/login` - 用户登录 - `GET /api/auth/me` - 获取当前用户 - `PUT /api/auth/update-profile` - 更新资料 - `POST /api/auth/change-password` - 修改密码 ### 仪表板 - `GET /api/dashboard/overview` - 获取仪表板概览 - `GET /api/dashboard/real-time-metrics` - 获取实时指标 - `GET /api/dashboard/agent-status` - 获取 agent 状态 ### 流量 - `GET /api/traffic/stats` - 获取流量统计信息 - `GET /api/traffic/live` - 获取实时流量数据 - `POST /api/traffic/submit` - 提交流量数据 - `GET /api/traffic/export` - 导出流量数据 ### 告警 - `GET /api/alerts/` - 获取告警 - `POST /api/alerts/create` - 创建告警 - `POST /api/alerts/:id/acknowledge` - 确认告警 - `POST /api/alerts/:id/resolve` - 解决告警 - `GET /api/alerts/summary` - 获取告警摘要 ## 🎨 功能概述 ### 仪表板 - 实时流量可视化 - 系统健康指标 - ML 模型性能 - 攻击分布图表 - Agent 监控 ### 告警 - 可过滤的告警列表 - 基于严重程度的分类 - 告警确认工作流 - 详细的攻击信息 ### 流量 - 实时流量流图表 - 协议分布 - 历史数据分析 - CSV 导出功能 ### 设置 - 资料管理 - 安全设置 - 用户偏好设置 ## 🧪 测试 ### 后端测试 ``` cd backend pytest ``` ### 前端测试 ``` cd frontend npm test ``` ## 🐛 故障排除 ### MongoDB 连接问题 - 确保 MongoDB 正在运行:`mongod` - 检查 `.env` 中的连接字符串 - 验证 MongoDB 端口(默认:27017) ### 前端 API 错误 - 验证后端是否在端口 5000 上运行 - 检查前端 `.env` 中的 `REACT_APP_API_URL` - 确保 CORS 配置正确 ### 网络 Agent 问题 - 验证网络接口名称 - 检查 agent 身份验证凭据 - 确保可以访问后端 API ## 📐 系统架构 下图展示了远程 Python 嗅探器如何拦截网络流、处理并将特征流式传输到 Flask API、运行分类器,并在 React 前端仪表板上触发告警: ``` graph TD %% Define styles classDef agent fill:#1e1e2e,stroke:#f9e2af,stroke-width:2px,color:#cdd6f4; classDef backend fill:#1e1e2e,stroke:#89b4fa,stroke-width:2px,color:#cdd6f4; classDef frontend fill:#1e1e2e,stroke:#cba6f7,stroke-width:2px,color:#cdd6f4; classDef db fill:#1e1e2e,stroke:#a6e3a1,stroke-width:2px,color:#cdd6f4; subgraph Net ["Network Context"] Packets["Live Network Traffic Flow"] end subgraph NodeAgent ["Network Agent (agent.py)"] PyShark["PyShark Packet Sniffer"] Parser["Feature Extractor (Headers, Size, Inter-arrival)"] Sender["HTTPS POST Client"] end class PyShark,Parser,Sender agent; subgraph Server ["Backend Services (Flask & Python)"] API["Flask Application (app.py)"] ML["MLDetector (Scikit-Learn Classifier)"] Alerts["Alerts & Severity Handler"] end class API,ML,Alerts backend; subgraph Client ["Frontend Client (React SPA)"] Dashboard["React UI Dashboard"] Charts["Chart.js (Real-time Flow Visuals)"] Logs["Alert Management Console"] end class Dashboard,Charts,Logs frontend; subgraph Storage ["Data Store"] MongoDB[("MongoDB Database")] end class MongoDB db; %% Data flows Packets -->|Sniffs| PyShark PyShark -->|Extracts packet arrays| Parser Parser -->|Buffered JSON stream| Sender Sender -->|REST API POST| API API -->|Sends feature vectors| ML ML -->|Classifies DDoS vs Normal| API API -->|Creates alert entries| Alerts Alerts -->|Writes telemetry & logs| MongoDB API <-->|Reads database metrics| MongoDB Dashboard <-->|Queries REST API| API Charts -->|Displays metrics| Dashboard Logs -->|Acknowledge/Resolve requests| API ``` ## 🧠 机器学习检测引擎 为了检测活跃的 DDoS 模式而不是设置粗糙的请求阈值,GarudaRush 使用了监督机器学习分类 pipeline。 ### 特征提取(网络 Agent) 网络嗅探器 (`agent.py`) 在单独的线程中运行。它使用 **PyShark** 拦截数据包流量,并将其聚合为统计网络流: 1. **流持续时间**:连续事务窗口的微秒持续时间。 2. **数据包计数**:窗口内的传入数据包总数。 3. **Payload 大小方差**:突出显示异常的批量体积变化。 4. **到达间隔时间 (IAT)**:评估数据包间距(间距小意味着自动化的泛洪请求脚本)。 ### 威胁分类(后端服务) - **模型**:在 `ml_detector.py` 中加载的 Scikit-Learn 分类算法(优化的 Random Forest / SVM)。 - **实时评分**:对于由远程 agent 发布的每个请求块,Flask 后端会计算威胁概率。 - **告警升级**:如果威胁确定性超过可配置的阈值(例如 90%),则会触发高严重性告警,将恶意 IP、时间戳和签名保存到 MongoDB 集群中。 ## 👥 贡献者 本项目由 Capstone Project 团队开发: - **Parshav Shah** - **Prince Rupareliya** - **Smeet Sadhu** - **Mahi Panchal** ## 🙏 致谢 - **Flask** 和 **React** 社区提供的框架设计。 - **PyShark** 团队提供的强大 tshark Python 接口。 - **Chart.js** 提供的交互式实时指标可视化。 - **MongoDB** 提供的高吞吐量非结构化事件存储。 ## 📝 许可证 在 MIT 许可证下分发。查看 `LICENSE` 了解更多信息。
## ✨ 功能 ### 🔐 身份验证与安全 - 基于 JWT 的安全身份验证 - 用户注册和登录 - 密码强度验证 - 受保护的路由 - 用户资料管理 ### 📊 仪表板 - 通过实时图表进行流量监控 - 系统指标和统计数据 - ML 模型性能指标 - 攻击分布可视化 - Agent 状态监控 - 检测统计数据 ### 🚨 告警管理 - 实时安全告警 - 按严重程度、状态和攻击类型过滤 - 确认和解决告警 - 告警摘要和趋势 - 详细的告警信息 ### 📡 流量监控 - 实时流量流可视化 - 协议分布分析 - 流量统计和指标 - 历史数据导出 - 时间范围过滤 ### ⚙️ 设置 - 资料管理 - 密码修改 - 用户偏好设置 - 主题定制 ## 🛠️ 技术栈 ### 前端 - **React 18** - UI 框架 - **React Router** - 导航 - **Chart.js** - 数据可视化 - **Axios** - HTTP 客户端 - **React Toastify** - 通知 - **CSS3** - 现代样式 ### 后端 - **Flask** - Python Web 框架 - **MongoDB** - 数据库 - **JWT** - 身份验证 - **PyShark** - 网络数据包捕获 - **Scikit-learn** - 机器学习 - **NumPy/Pandas** - 数据处理 ## 📋 前置条件 - Python 3.8+ - Node.js 16+ - MongoDB 4.4+ - npm 或 yarn ## 🚀 安装说明 ### 后端设置 1. 导航至 backend 目录: ``` cd backend ``` 2. 创建虚拟环境: ``` python -m venv venv source venv/bin/activate # On Windows: venv\Scripts\activate ``` 3. 安装依赖项: ``` pip install -r requirements.txt ``` 4. 在 backend 目录中创建 `.env` 文件: ``` SECRET_KEY=your-secret-key-here JWT_SECRET_KEY=your-jwt-secret-key-here MONGO_URI=mongodb://localhost:27017/garudarush MONGO_DB_NAME=garudarush FRONTEND_URL=http://localhost:3000 PORT=5000 FLASK_ENV=development ``` 5. 启动后端服务器: ``` python app.py ``` 后端将在 `http://localhost:5000` 上运行 ### 前端设置 1. 导航至 frontend 目录: ``` cd frontend ``` 2. 安装依赖项: ``` npm install ``` 3. 在 frontend 目录中创建 `.env` 文件: ``` REACT_APP_API_URL=http://localhost:5000/api ``` 4. 启动开发服务器: ``` npm start ``` 前端将在 `http://localhost:3000` 上运行 ## 📁 项目结构 ``` garudarush/ ├── backend/ │ ├── app.py # Flask application entry point │ ├── agent.py # Network monitoring agent │ ├── requirements.txt # Python dependencies │ ├── routes/ │ │ ├── auth.py # Authentication routes │ │ ├── dashboard.py # Dashboard routes │ │ ├── traffic.py # Traffic monitoring routes │ │ └── alerts.py # Alerts routes │ └── services/ │ └── ml_detector.py # ML detection service │ └── frontend/ ├── public/ │ └── index.html ├── src/ │ ├── App.js # Main app component │ ├── components/ │ │ ├── Auth/ # Login/Register components │ │ ├── Dashboard/ # Dashboard component │ │ ├── Alerts/ # Alerts component │ │ ├── Traffic/ # Traffic component │ │ ├── Settings/ # Settings component │ │ └── Layout/ # Navigation layout │ └── services/ │ └── api.js # API service layer └── package.json ``` ## 🎯 用法 ### 启动应用程序 1. **启动 MongoDB**: ``` mongod ``` 2. **启动后端**(在 backend 目录中): ``` python app.py ``` 3. **启动前端**(在 frontend 目录中): ``` npm start ``` 4. **访问应用程序**: - 打开浏览器并导航至 `http://localhost:3000` - 注册新账户或登录 - 探索仪表板和功能 ### 运行网络 Agent 要监控网络流量,请运行 agent: ``` python backend/agent.py \ --agent-id agent-001 \ --interface eth0 \ --api-url http://localhost:5000/api \ --username your-email@example.com \ --password your-password ``` **注意**:在 Windows 上,您可能需要使用不同的接口名称(例如 `Wi-Fi`、`Ethernet`)或使用 WSL。 ## 🔧 配置 ### 后端配置 编辑 backend 目录中的 `.env` 文件以配置: - 数据库连接 - JWT 密钥 - CORS 设置 - 端口号 ### 前端配置 编辑 frontend 目录中的 `.env` 文件以配置: - API endpoint URL ## 📊 API Endpoints ### 身份验证 - `POST /api/auth/register` - 注册新用户 - `POST /api/auth/login` - 用户登录 - `GET /api/auth/me` - 获取当前用户 - `PUT /api/auth/update-profile` - 更新资料 - `POST /api/auth/change-password` - 修改密码 ### 仪表板 - `GET /api/dashboard/overview` - 获取仪表板概览 - `GET /api/dashboard/real-time-metrics` - 获取实时指标 - `GET /api/dashboard/agent-status` - 获取 agent 状态 ### 流量 - `GET /api/traffic/stats` - 获取流量统计信息 - `GET /api/traffic/live` - 获取实时流量数据 - `POST /api/traffic/submit` - 提交流量数据 - `GET /api/traffic/export` - 导出流量数据 ### 告警 - `GET /api/alerts/` - 获取告警 - `POST /api/alerts/create` - 创建告警 - `POST /api/alerts/:id/acknowledge` - 确认告警 - `POST /api/alerts/:id/resolve` - 解决告警 - `GET /api/alerts/summary` - 获取告警摘要 ## 🎨 功能概述 ### 仪表板 - 实时流量可视化 - 系统健康指标 - ML 模型性能 - 攻击分布图表 - Agent 监控 ### 告警 - 可过滤的告警列表 - 基于严重程度的分类 - 告警确认工作流 - 详细的攻击信息 ### 流量 - 实时流量流图表 - 协议分布 - 历史数据分析 - CSV 导出功能 ### 设置 - 资料管理 - 安全设置 - 用户偏好设置 ## 🧪 测试 ### 后端测试 ``` cd backend pytest ``` ### 前端测试 ``` cd frontend npm test ``` ## 🐛 故障排除 ### MongoDB 连接问题 - 确保 MongoDB 正在运行:`mongod` - 检查 `.env` 中的连接字符串 - 验证 MongoDB 端口(默认:27017) ### 前端 API 错误 - 验证后端是否在端口 5000 上运行 - 检查前端 `.env` 中的 `REACT_APP_API_URL` - 确保 CORS 配置正确 ### 网络 Agent 问题 - 验证网络接口名称 - 检查 agent 身份验证凭据 - 确保可以访问后端 API ## 📐 系统架构 下图展示了远程 Python 嗅探器如何拦截网络流、处理并将特征流式传输到 Flask API、运行分类器,并在 React 前端仪表板上触发告警: ``` graph TD %% Define styles classDef agent fill:#1e1e2e,stroke:#f9e2af,stroke-width:2px,color:#cdd6f4; classDef backend fill:#1e1e2e,stroke:#89b4fa,stroke-width:2px,color:#cdd6f4; classDef frontend fill:#1e1e2e,stroke:#cba6f7,stroke-width:2px,color:#cdd6f4; classDef db fill:#1e1e2e,stroke:#a6e3a1,stroke-width:2px,color:#cdd6f4; subgraph Net ["Network Context"] Packets["Live Network Traffic Flow"] end subgraph NodeAgent ["Network Agent (agent.py)"] PyShark["PyShark Packet Sniffer"] Parser["Feature Extractor (Headers, Size, Inter-arrival)"] Sender["HTTPS POST Client"] end class PyShark,Parser,Sender agent; subgraph Server ["Backend Services (Flask & Python)"] API["Flask Application (app.py)"] ML["MLDetector (Scikit-Learn Classifier)"] Alerts["Alerts & Severity Handler"] end class API,ML,Alerts backend; subgraph Client ["Frontend Client (React SPA)"] Dashboard["React UI Dashboard"] Charts["Chart.js (Real-time Flow Visuals)"] Logs["Alert Management Console"] end class Dashboard,Charts,Logs frontend; subgraph Storage ["Data Store"] MongoDB[("MongoDB Database")] end class MongoDB db; %% Data flows Packets -->|Sniffs| PyShark PyShark -->|Extracts packet arrays| Parser Parser -->|Buffered JSON stream| Sender Sender -->|REST API POST| API API -->|Sends feature vectors| ML ML -->|Classifies DDoS vs Normal| API API -->|Creates alert entries| Alerts Alerts -->|Writes telemetry & logs| MongoDB API <-->|Reads database metrics| MongoDB Dashboard <-->|Queries REST API| API Charts -->|Displays metrics| Dashboard Logs -->|Acknowledge/Resolve requests| API ``` ## 🧠 机器学习检测引擎 为了检测活跃的 DDoS 模式而不是设置粗糙的请求阈值,GarudaRush 使用了监督机器学习分类 pipeline。 ### 特征提取(网络 Agent) 网络嗅探器 (`agent.py`) 在单独的线程中运行。它使用 **PyShark** 拦截数据包流量,并将其聚合为统计网络流: 1. **流持续时间**:连续事务窗口的微秒持续时间。 2. **数据包计数**:窗口内的传入数据包总数。 3. **Payload 大小方差**:突出显示异常的批量体积变化。 4. **到达间隔时间 (IAT)**:评估数据包间距(间距小意味着自动化的泛洪请求脚本)。 ### 威胁分类(后端服务) - **模型**:在 `ml_detector.py` 中加载的 Scikit-Learn 分类算法(优化的 Random Forest / SVM)。 - **实时评分**:对于由远程 agent 发布的每个请求块,Flask 后端会计算威胁概率。 - **告警升级**:如果威胁确定性超过可配置的阈值(例如 90%),则会触发高严重性告警,将恶意 IP、时间戳和签名保存到 MongoDB 集群中。 ## 👥 贡献者 本项目由 Capstone Project 团队开发: - **Parshav Shah** - **Prince Rupareliya** - **Smeet Sadhu** - **Mahi Panchal** ## 🙏 致谢 - **Flask** 和 **React** 社区提供的框架设计。 - **PyShark** 团队提供的强大 tshark Python 接口。 - **Chart.js** 提供的交互式实时指标可视化。 - **MongoDB** 提供的高吞吐量非结构化事件存储。 ## 📝 许可证 在 MIT 许可证下分发。查看 `LICENSE` 了解更多信息。
标签:Apex, DDoS检测, Flask, React, Syscalls, 机器学习, 流量监控, 网络安全, 自定义脚本, 隐私保护