praharshkumar23/Splunk-Dashboard-for-Web-Traffic-Logs
GitHub: praharshkumar23/Splunk-Dashboard-for-Web-Traffic-Logs
Stars: 1 | Forks: 0
# 📊 用于 Web 流量日志的 Splunk 仪表板


## 📌 项目概述
本项目演示了如何创建一个 **交互式 Splunk 仪表板**,用于分析 JSON 格式的 **Apache Web 流量日志**。
该仪表板提供了对 Web 活动、错误趋势、热门资源、用户 IP 和地理流量分布的实时洞察。
## 它专为 **Web 监控、安全分析和性能故障排除** 而设计。
## 🎯 目标
- 分析整体 Web 流量
- 监控成功和失败的 HTTP 响应
- 识别请求量最大的 URI
- 按IP 地址追踪顶级用户
## - 使用分级统计地图可视化 Web 流量地理分布
## 🛠️ 技术栈
- **Splunk Enterprise**
- **Apache Web 访问日志(JSON 格式)**
## - **SPL(搜索处理语言)**
## 📂 数据集详情
- **来源**:`apache_mixed_access_full (1).json`
- **主机**:`webserver`
- **源类型**:`_json`
- **关键字段**:
- `ip`
- `method`
- `uri`
- `status`
## `_time`
## ⚙️ 实验环境搭建与配置
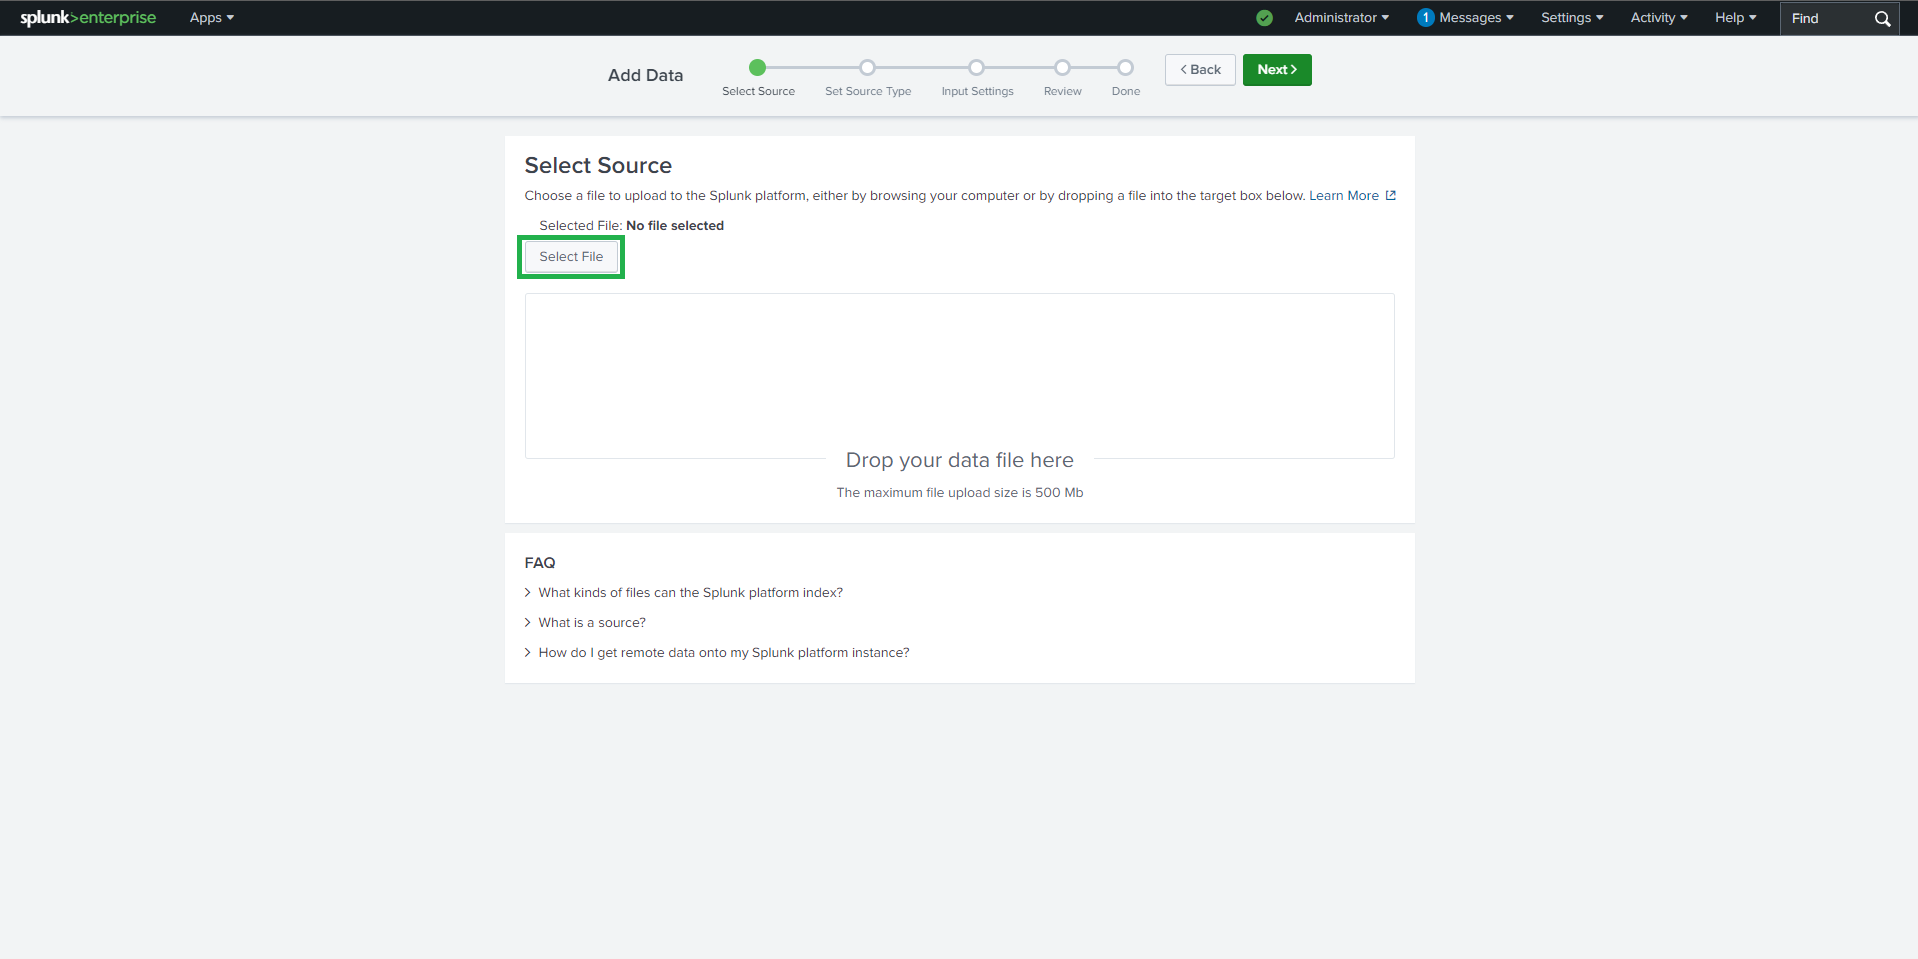
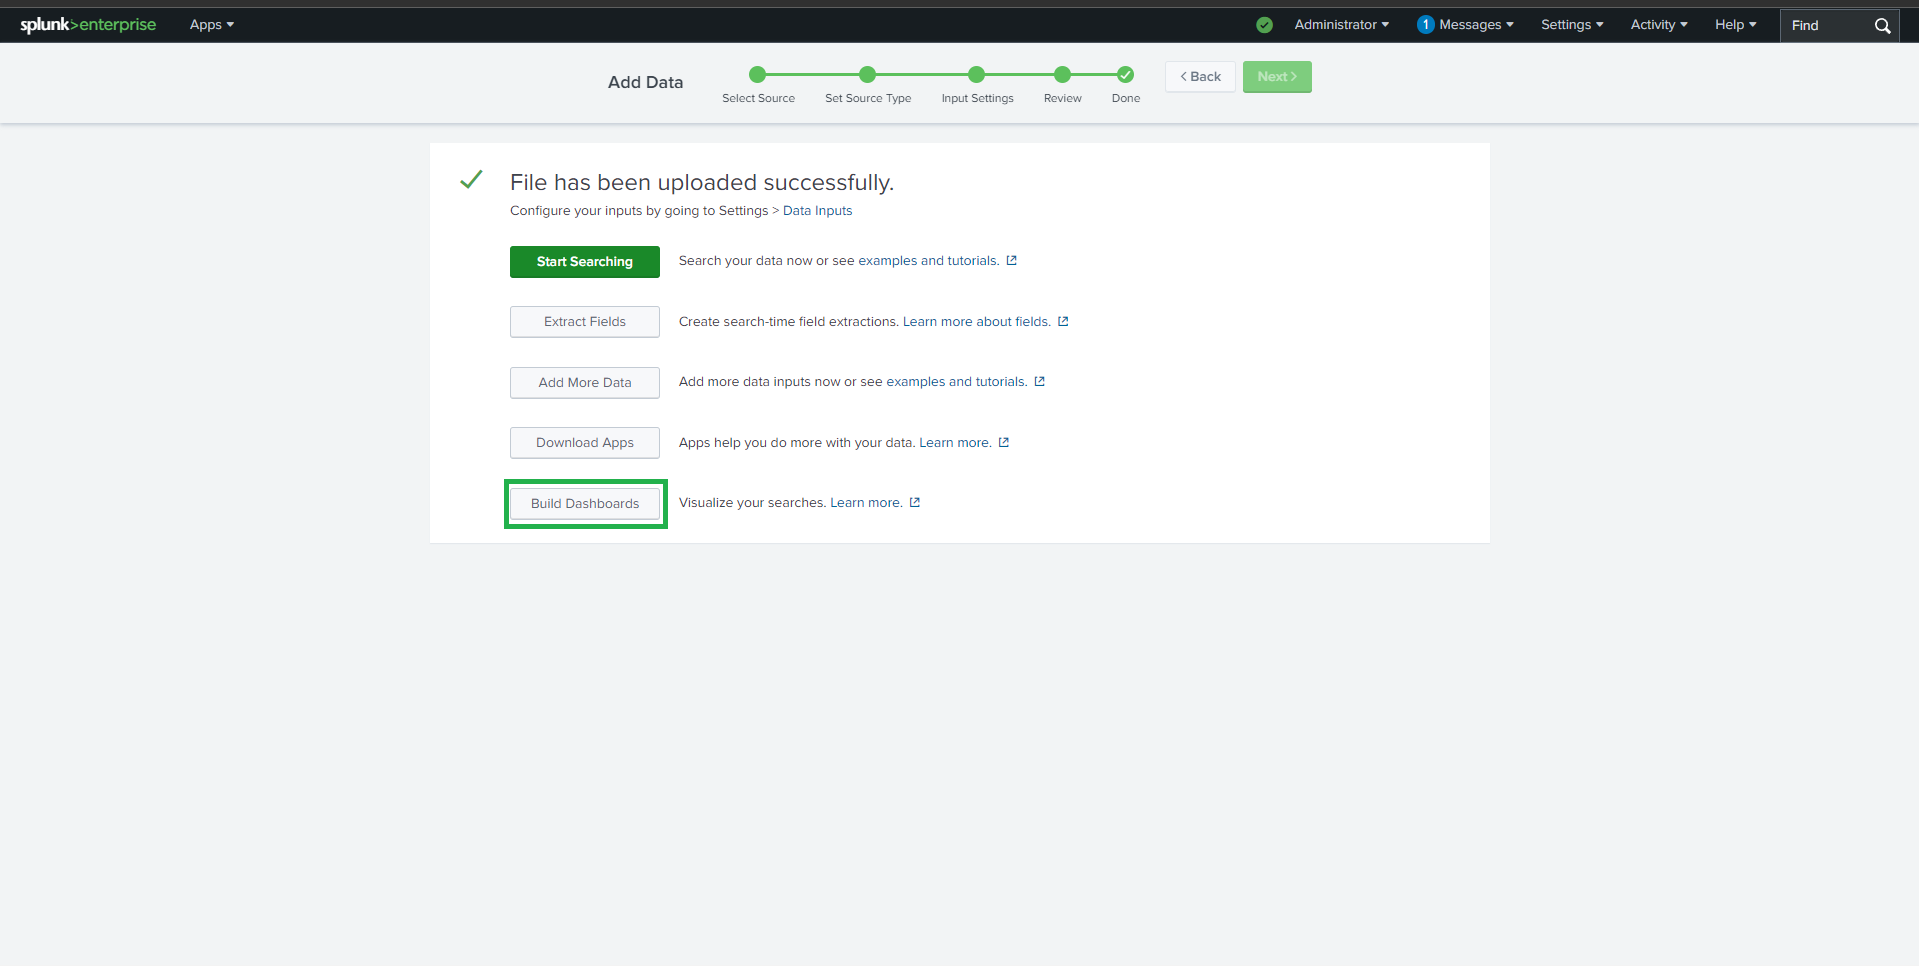
### 1️⃣ 数据摄取
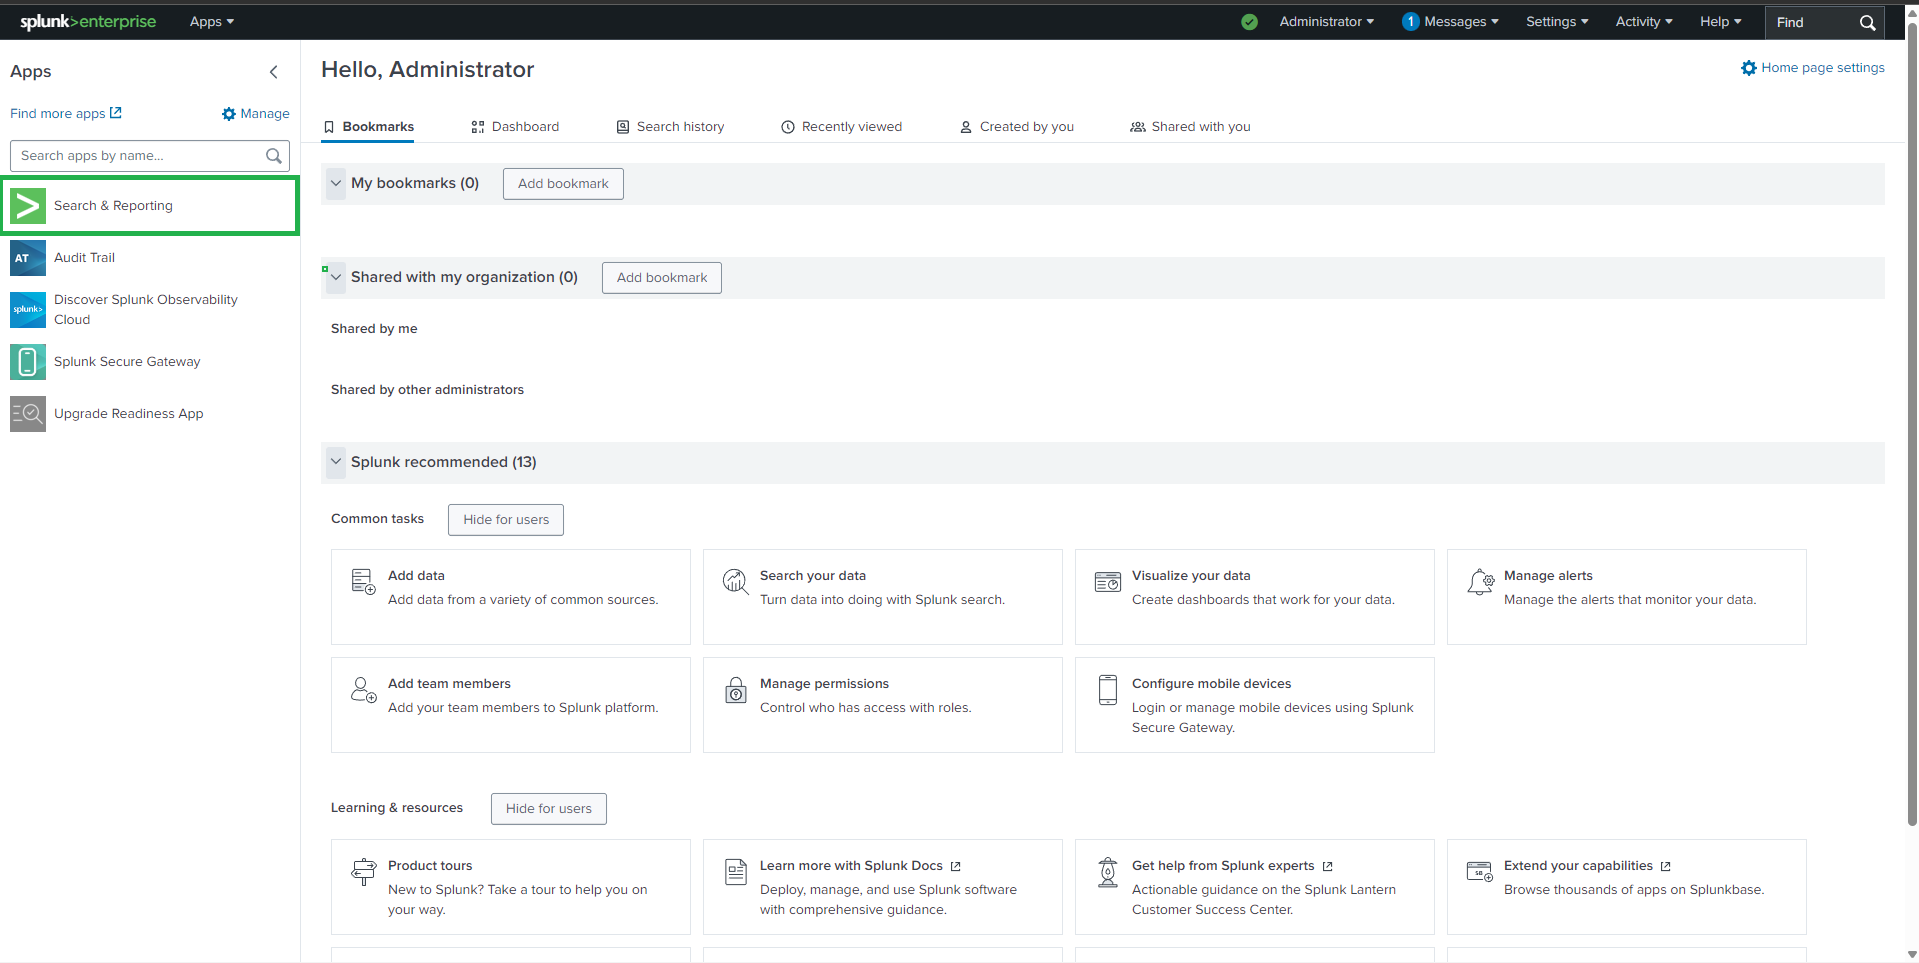
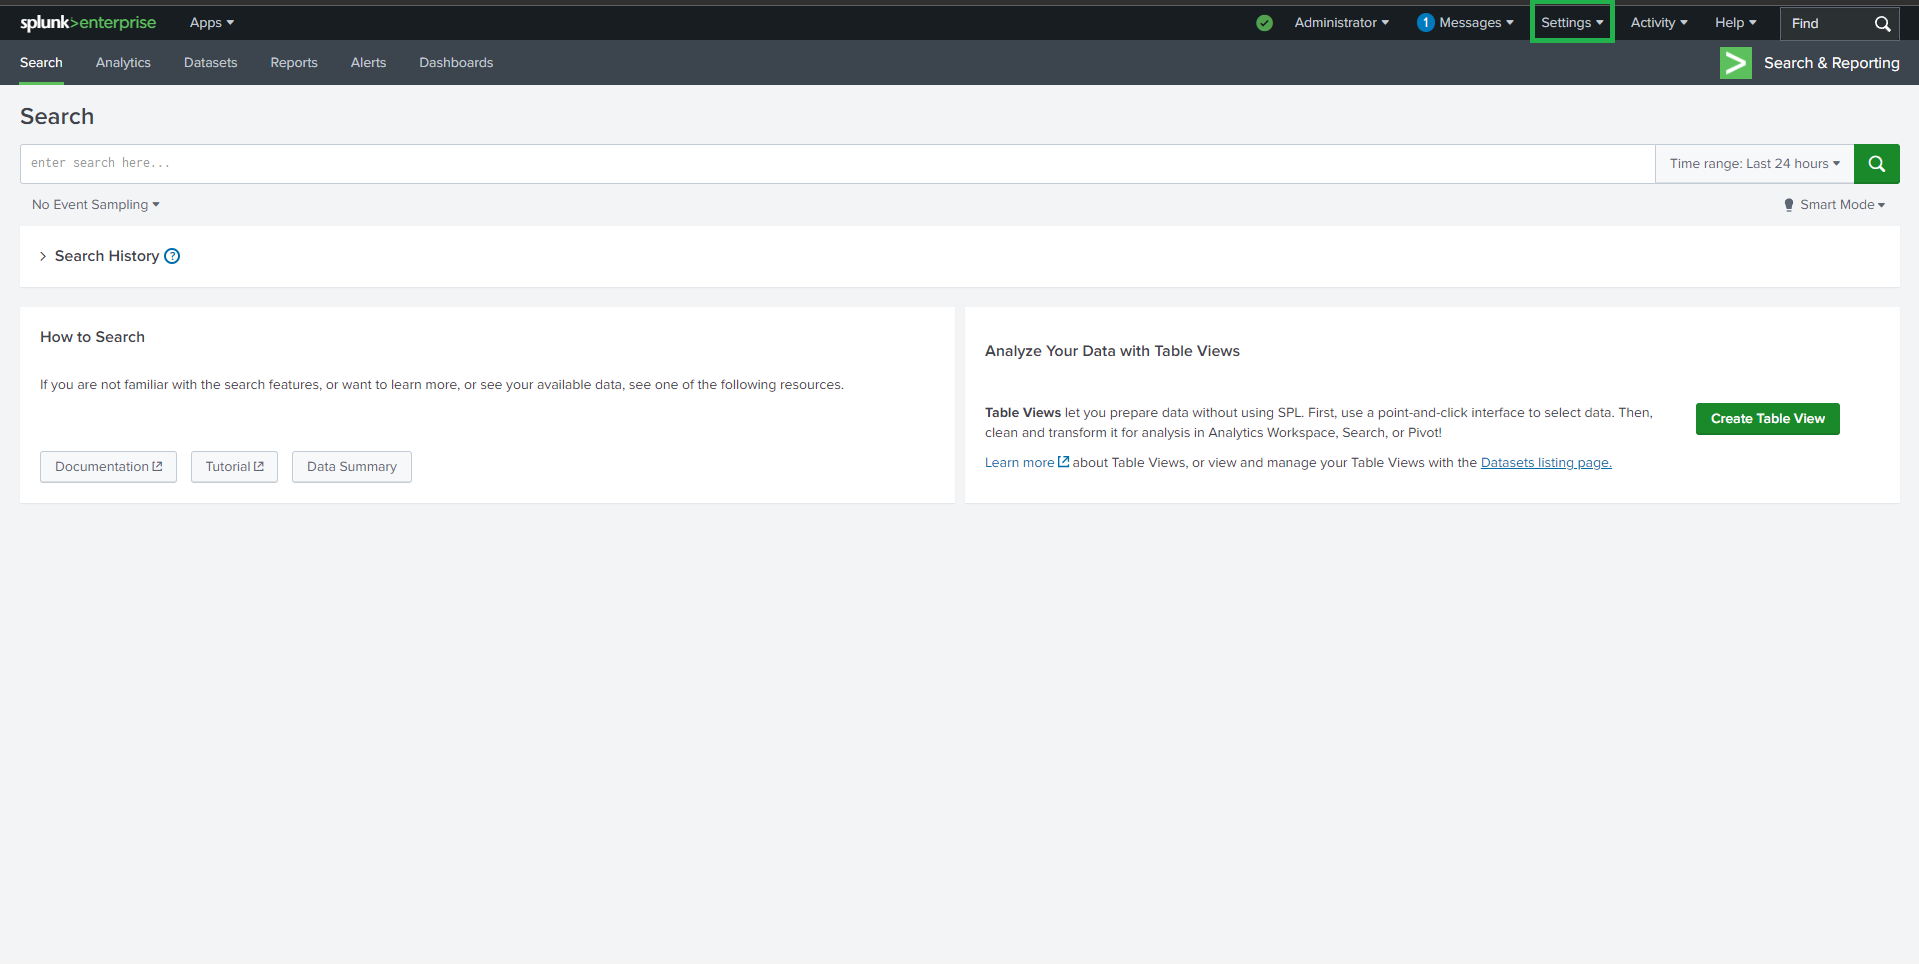
1. 以 **管理员** 身份登录 Splunk
#### 2. 导航至:
#### 设置 → 添加数据 → 上传
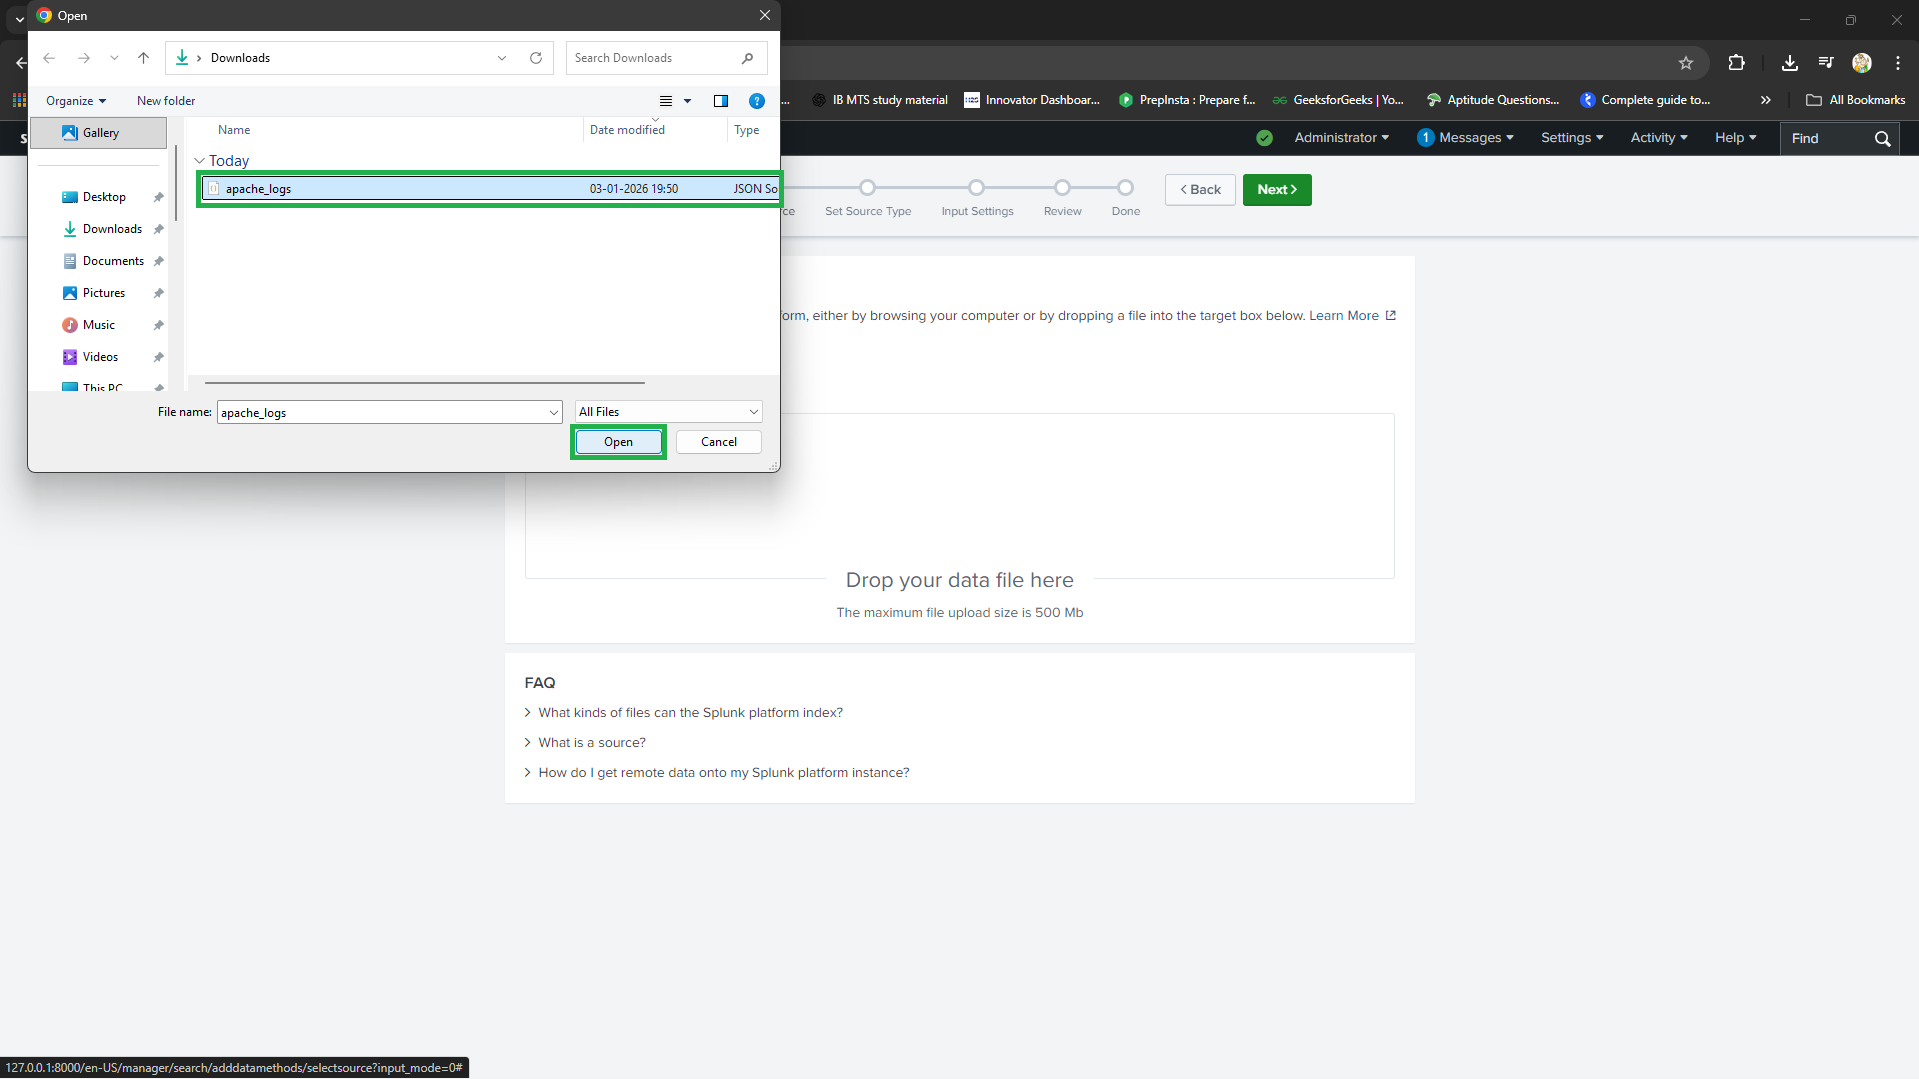
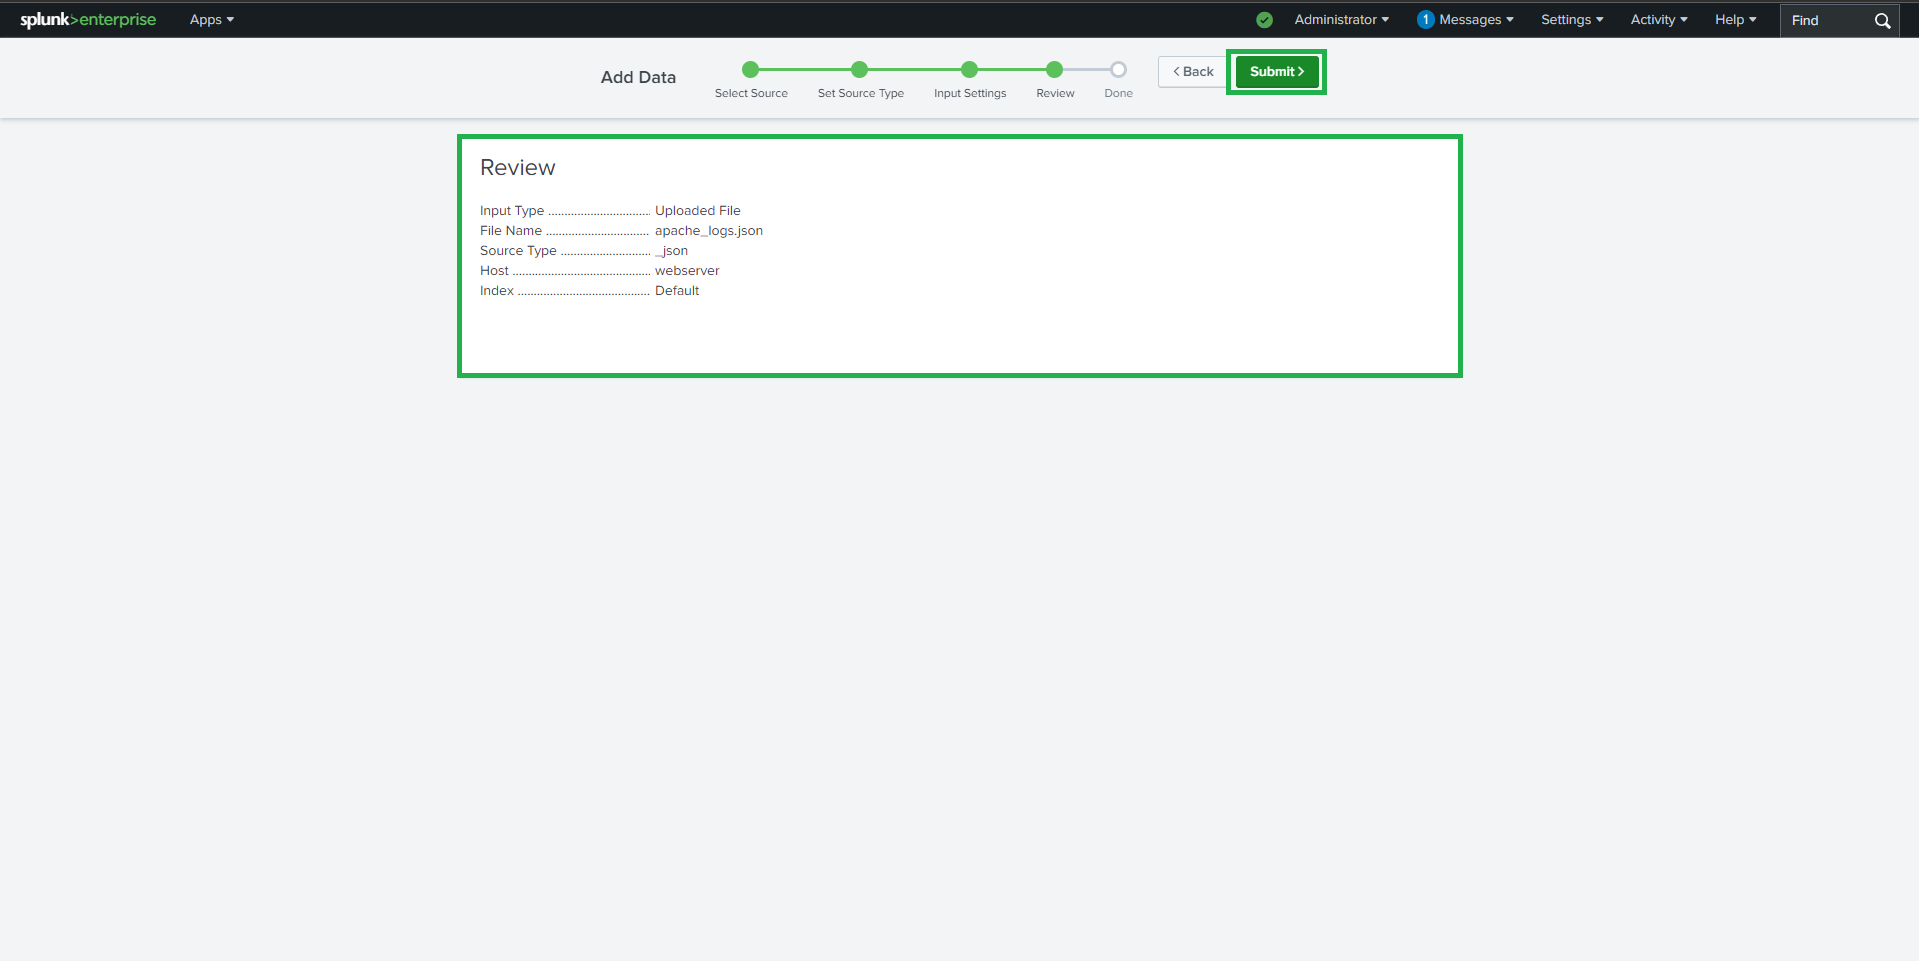
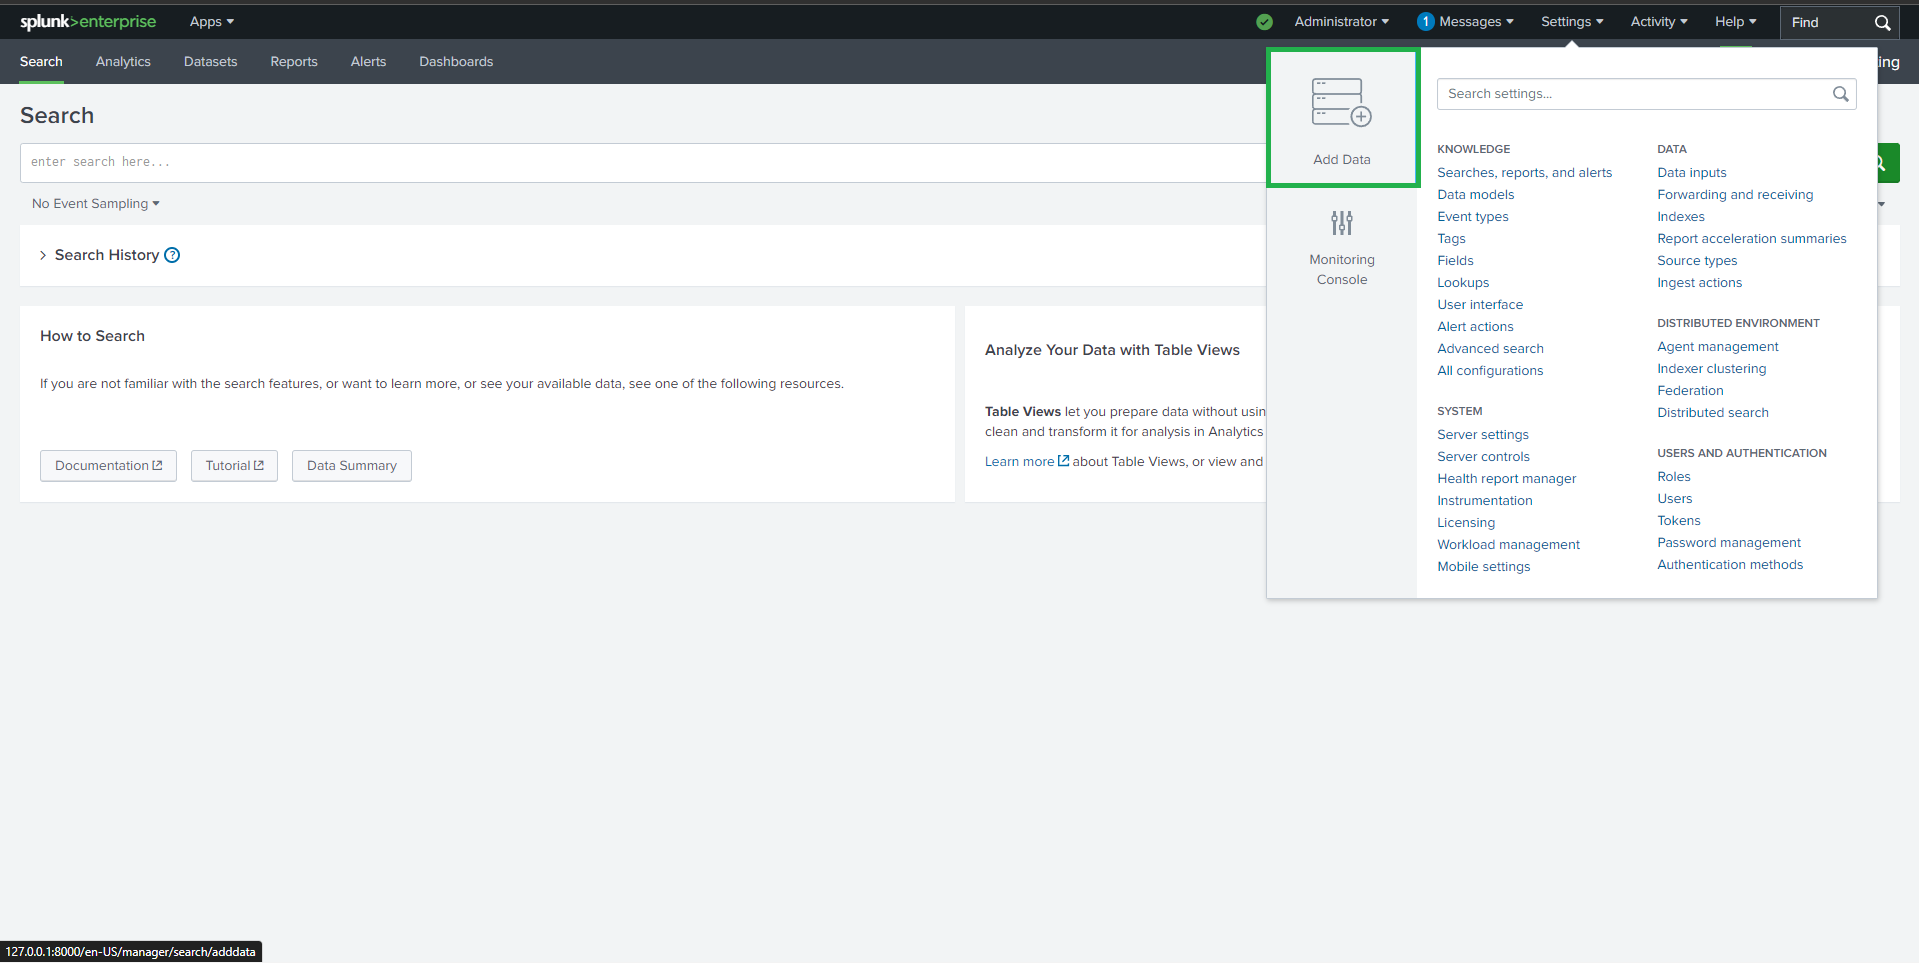 3. 上传 `apache_logs.json`
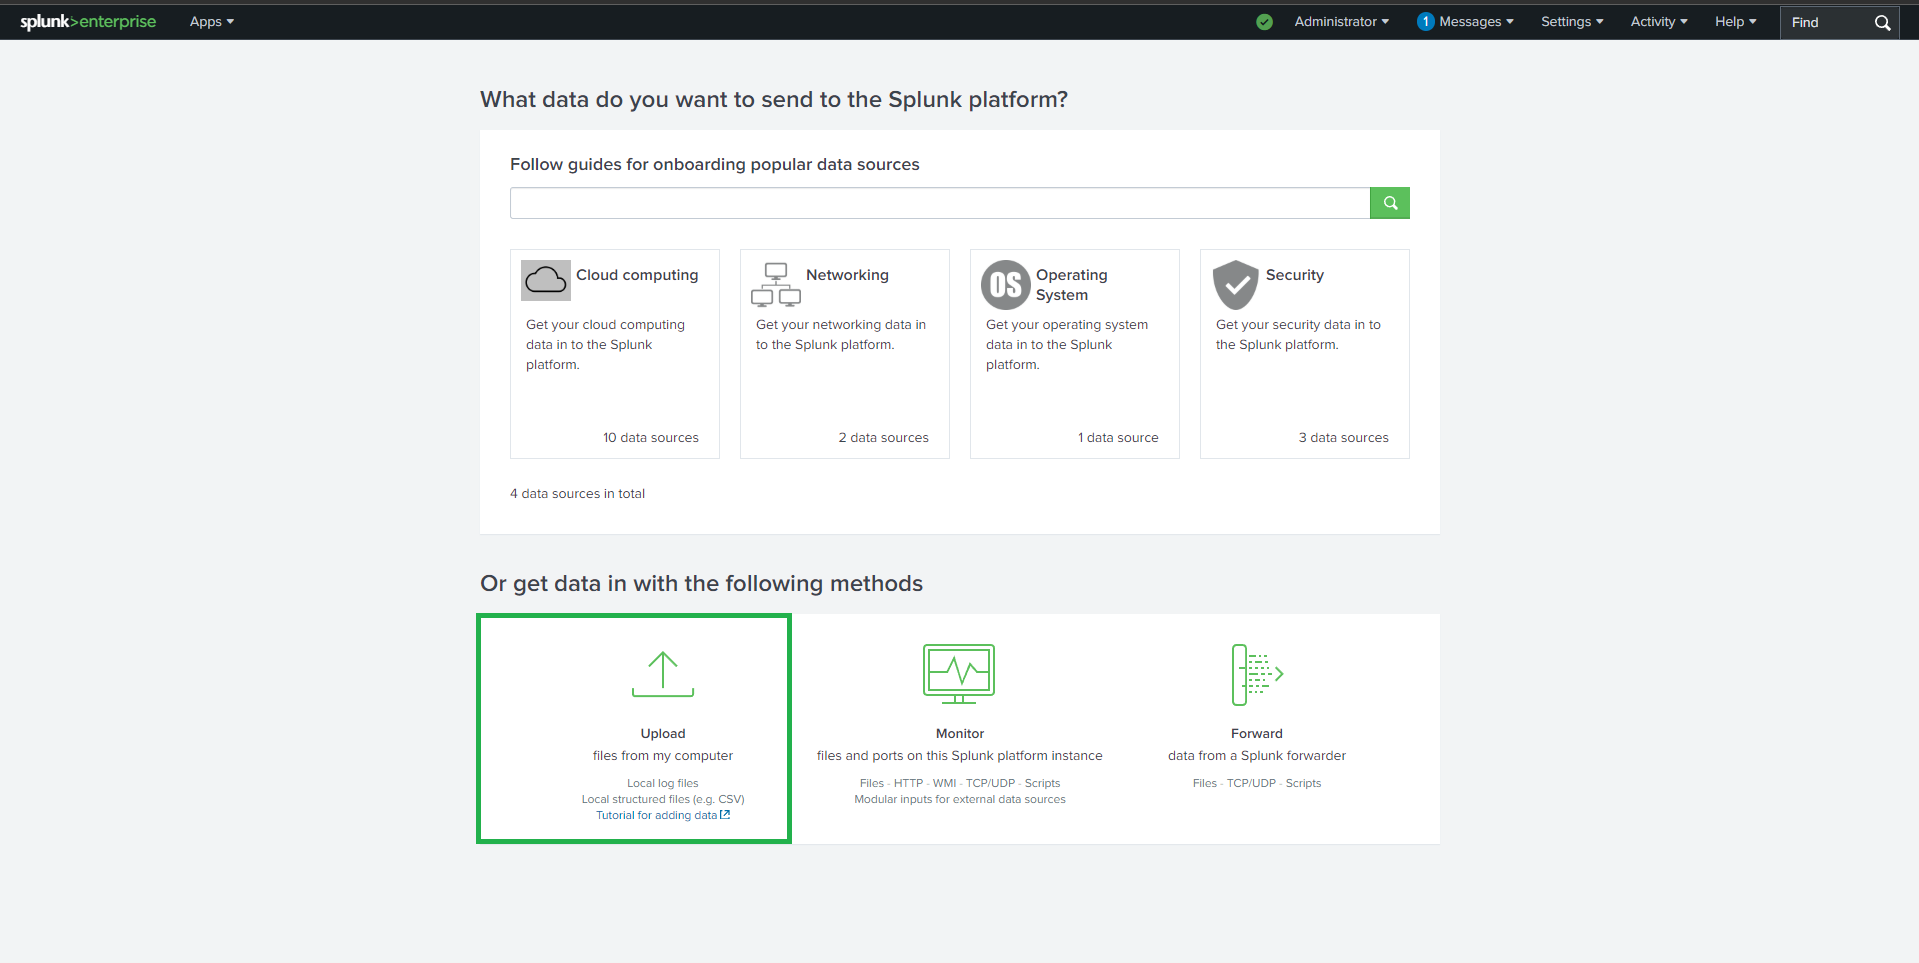
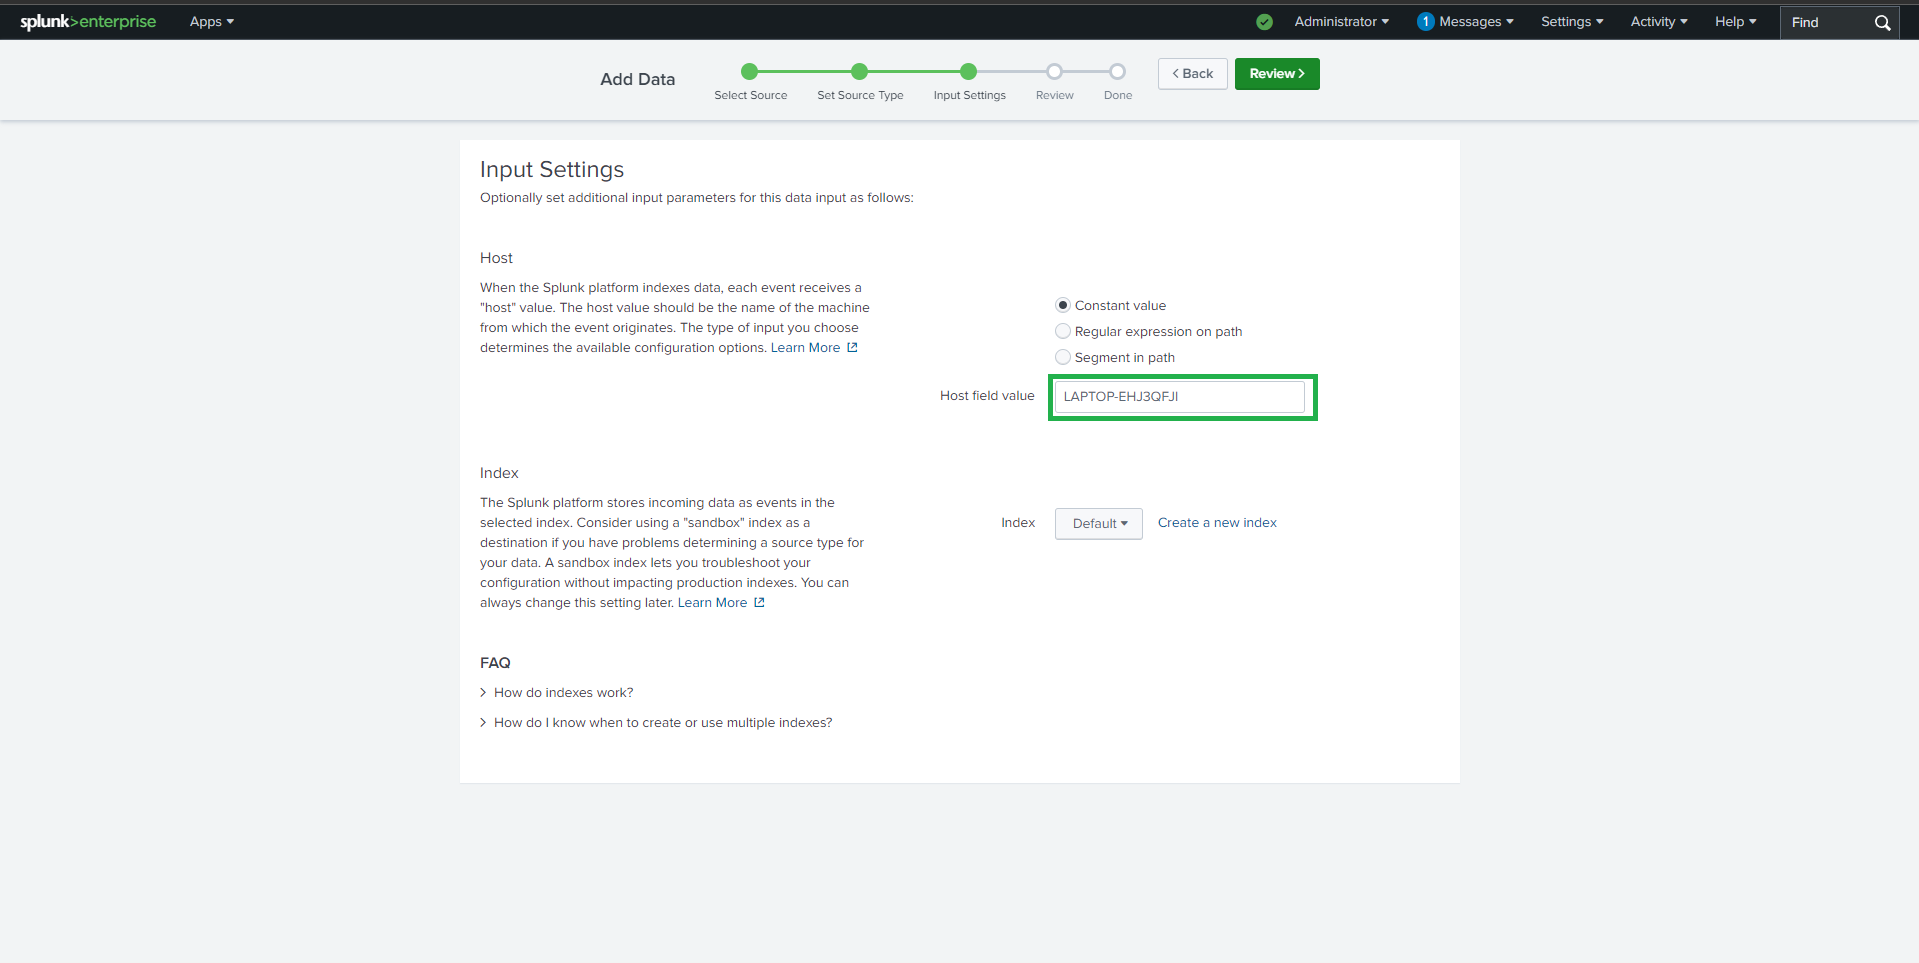
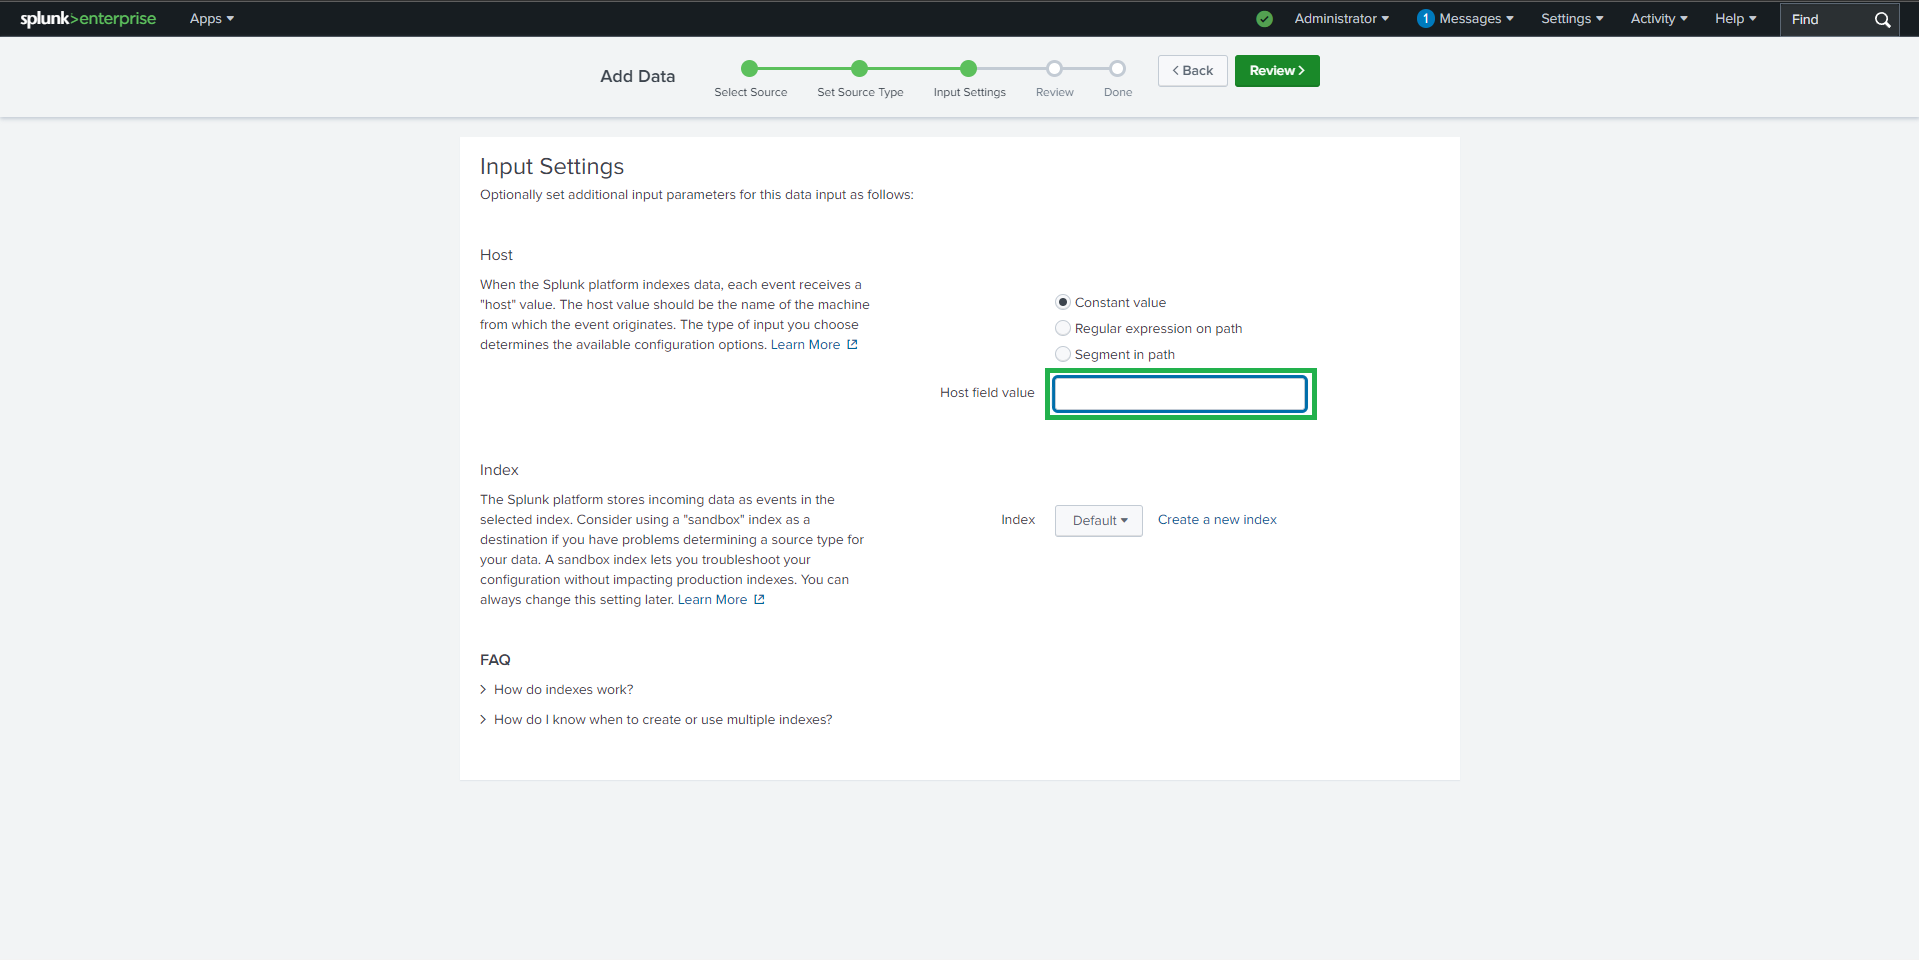
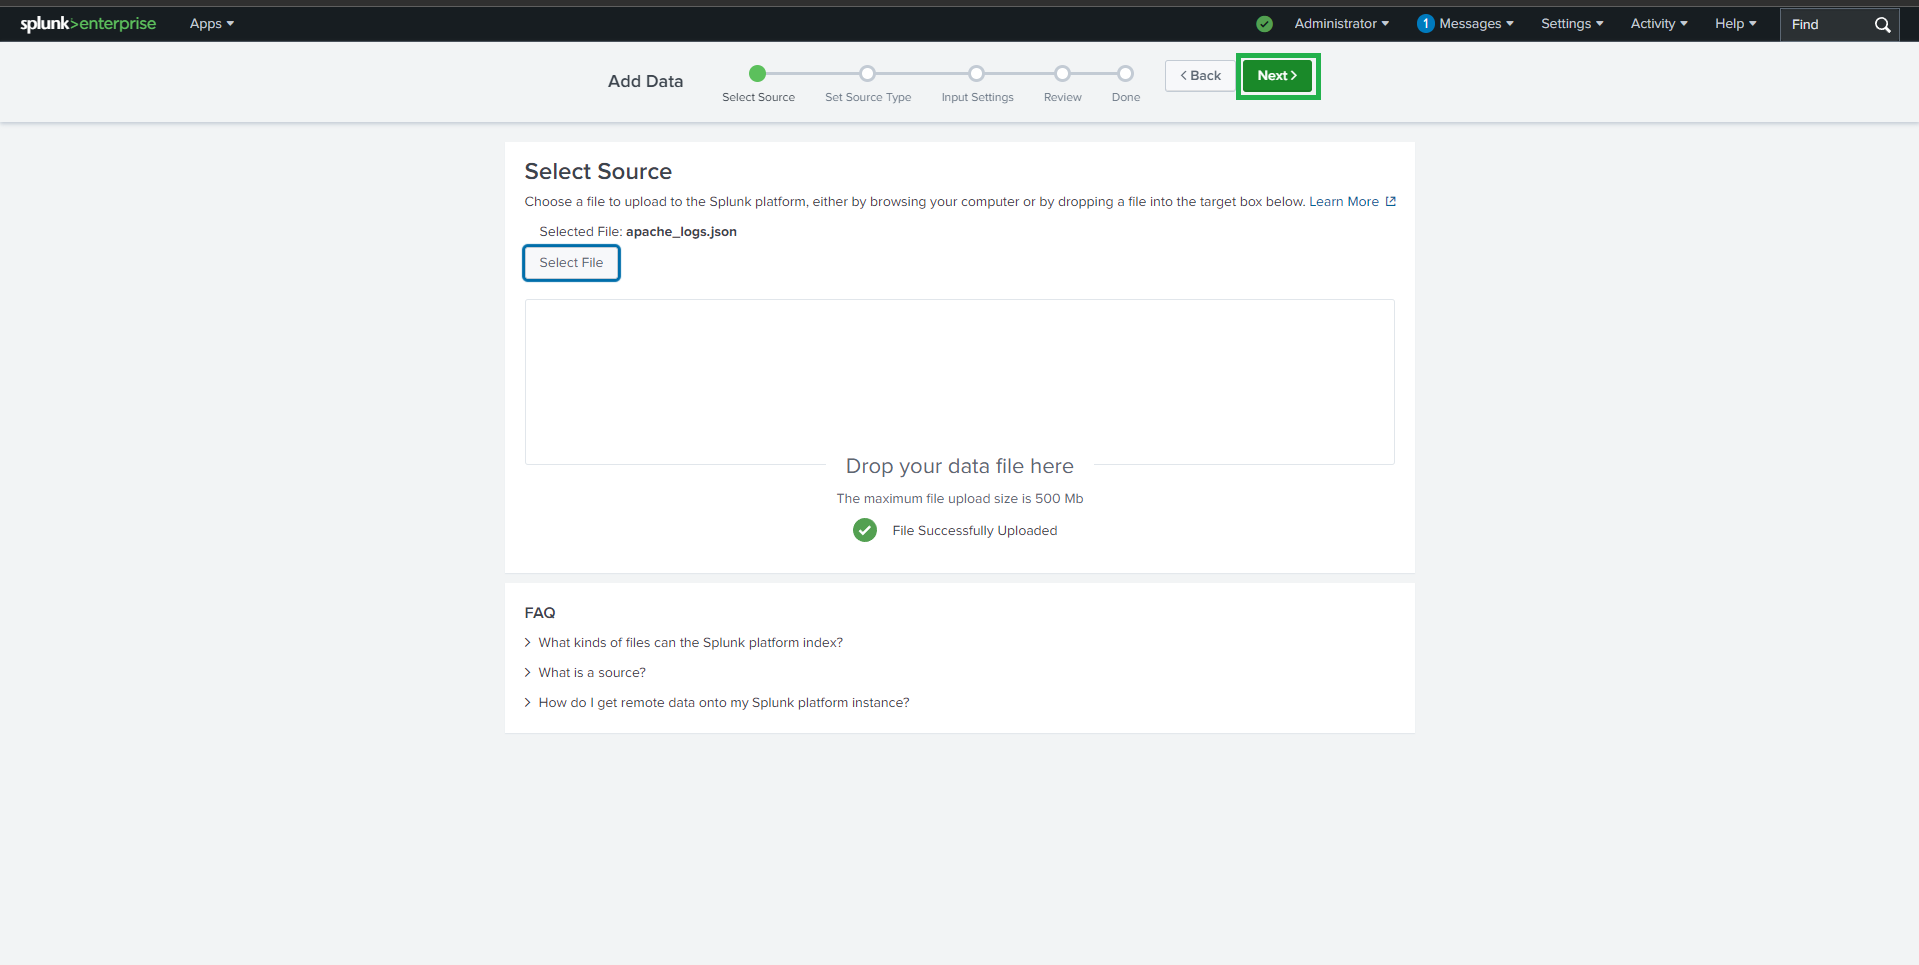 4. 设置:
- 源类型 (Source Type):`_json`
- 主机:`webserver`
4. 设置:
- 源类型 (Source Type):`_json`
- 主机:`webserver`
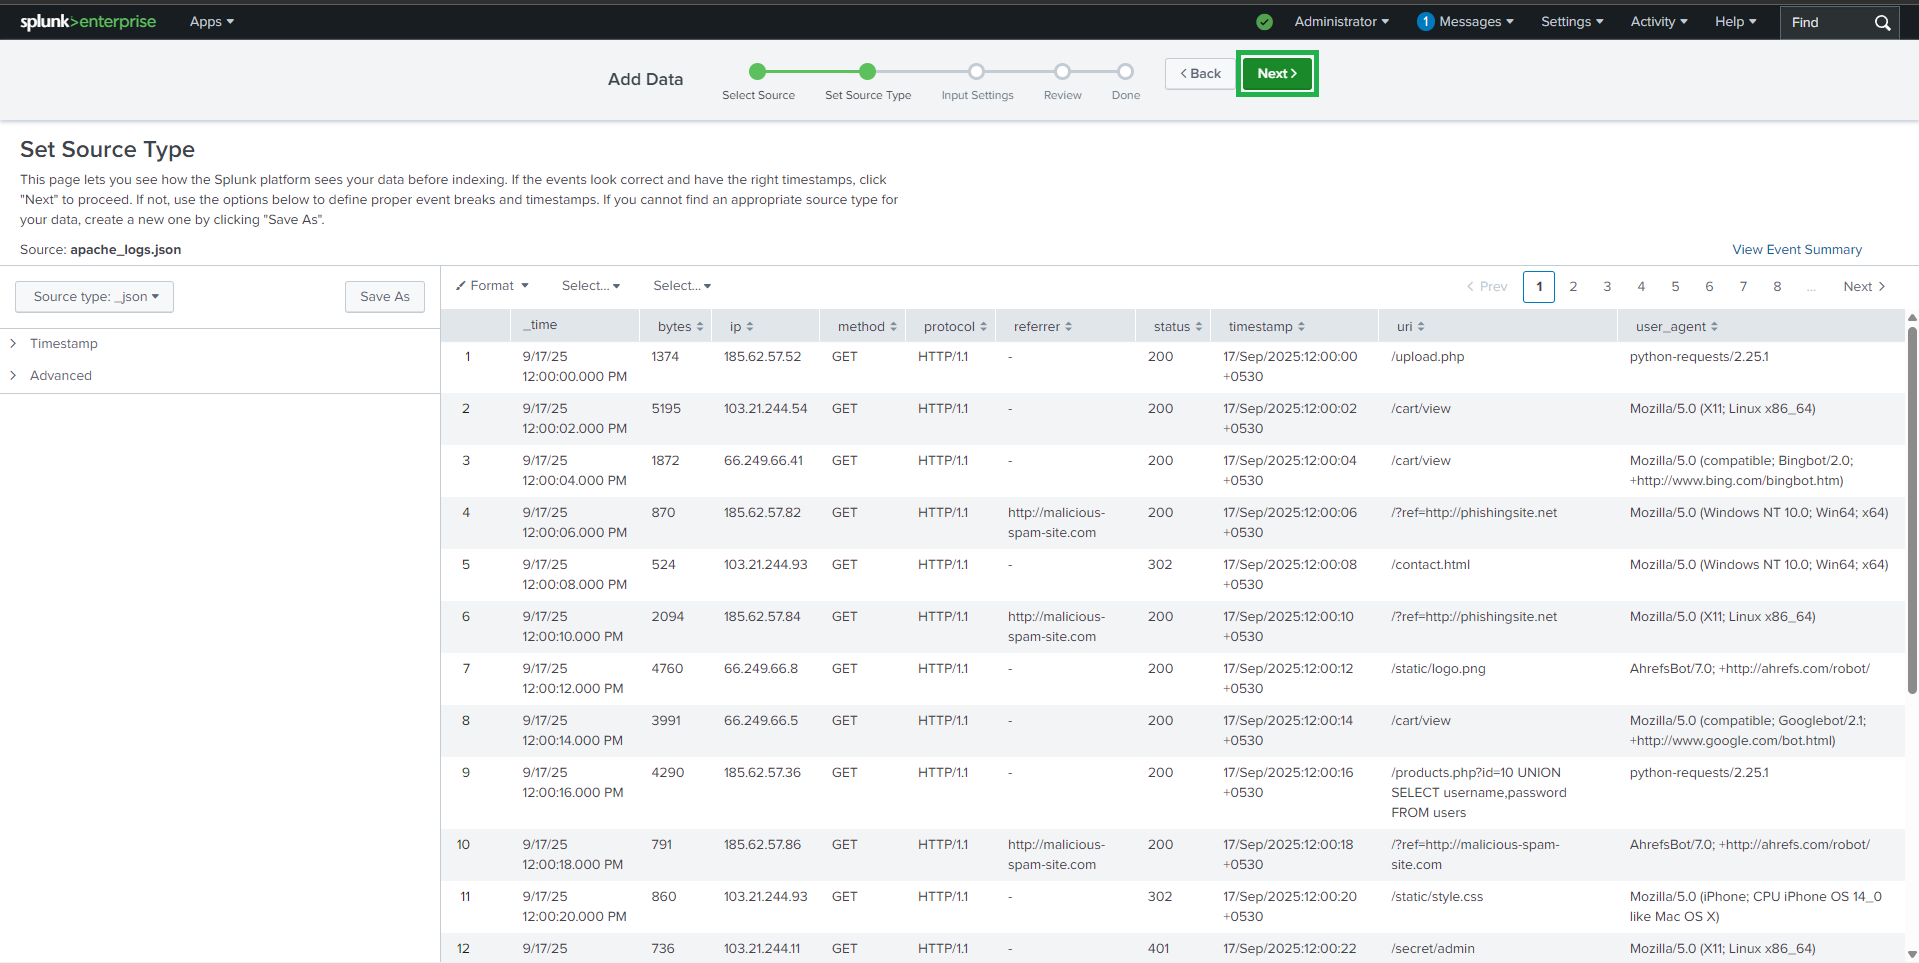
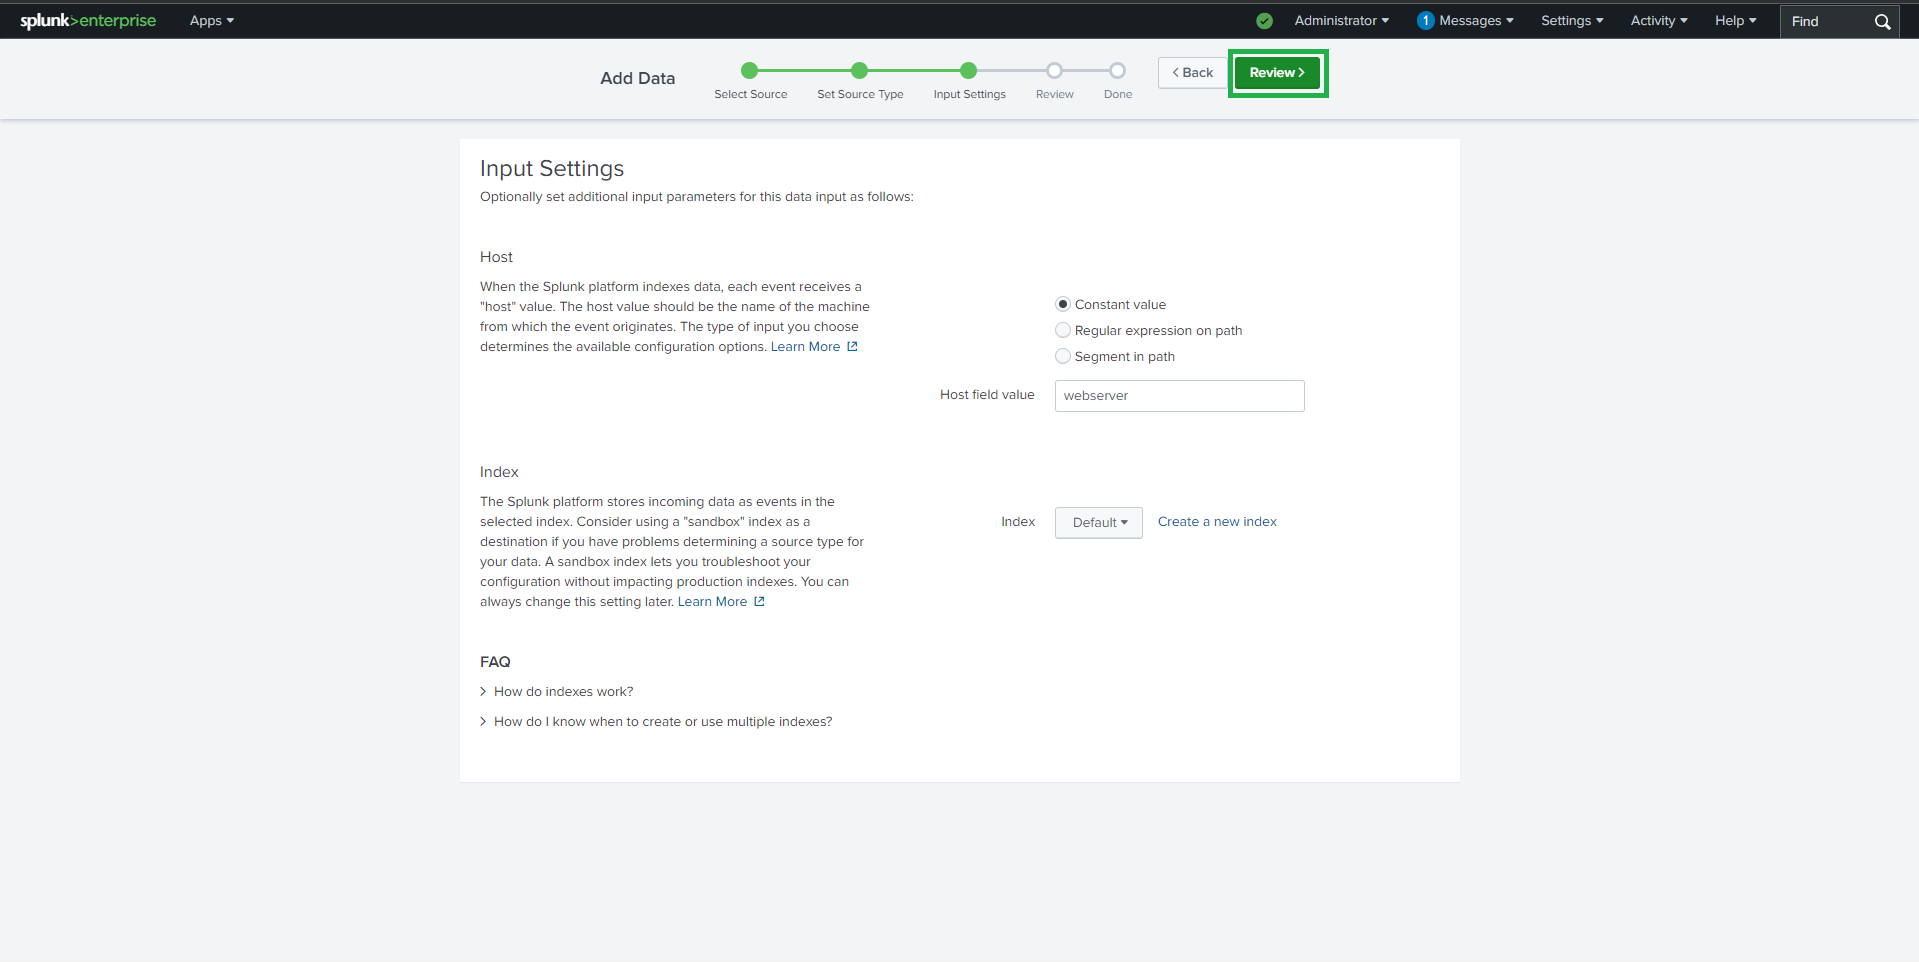 5. 检查并提交
 验证摄取:
```
#### source="apache_logs.json"
---
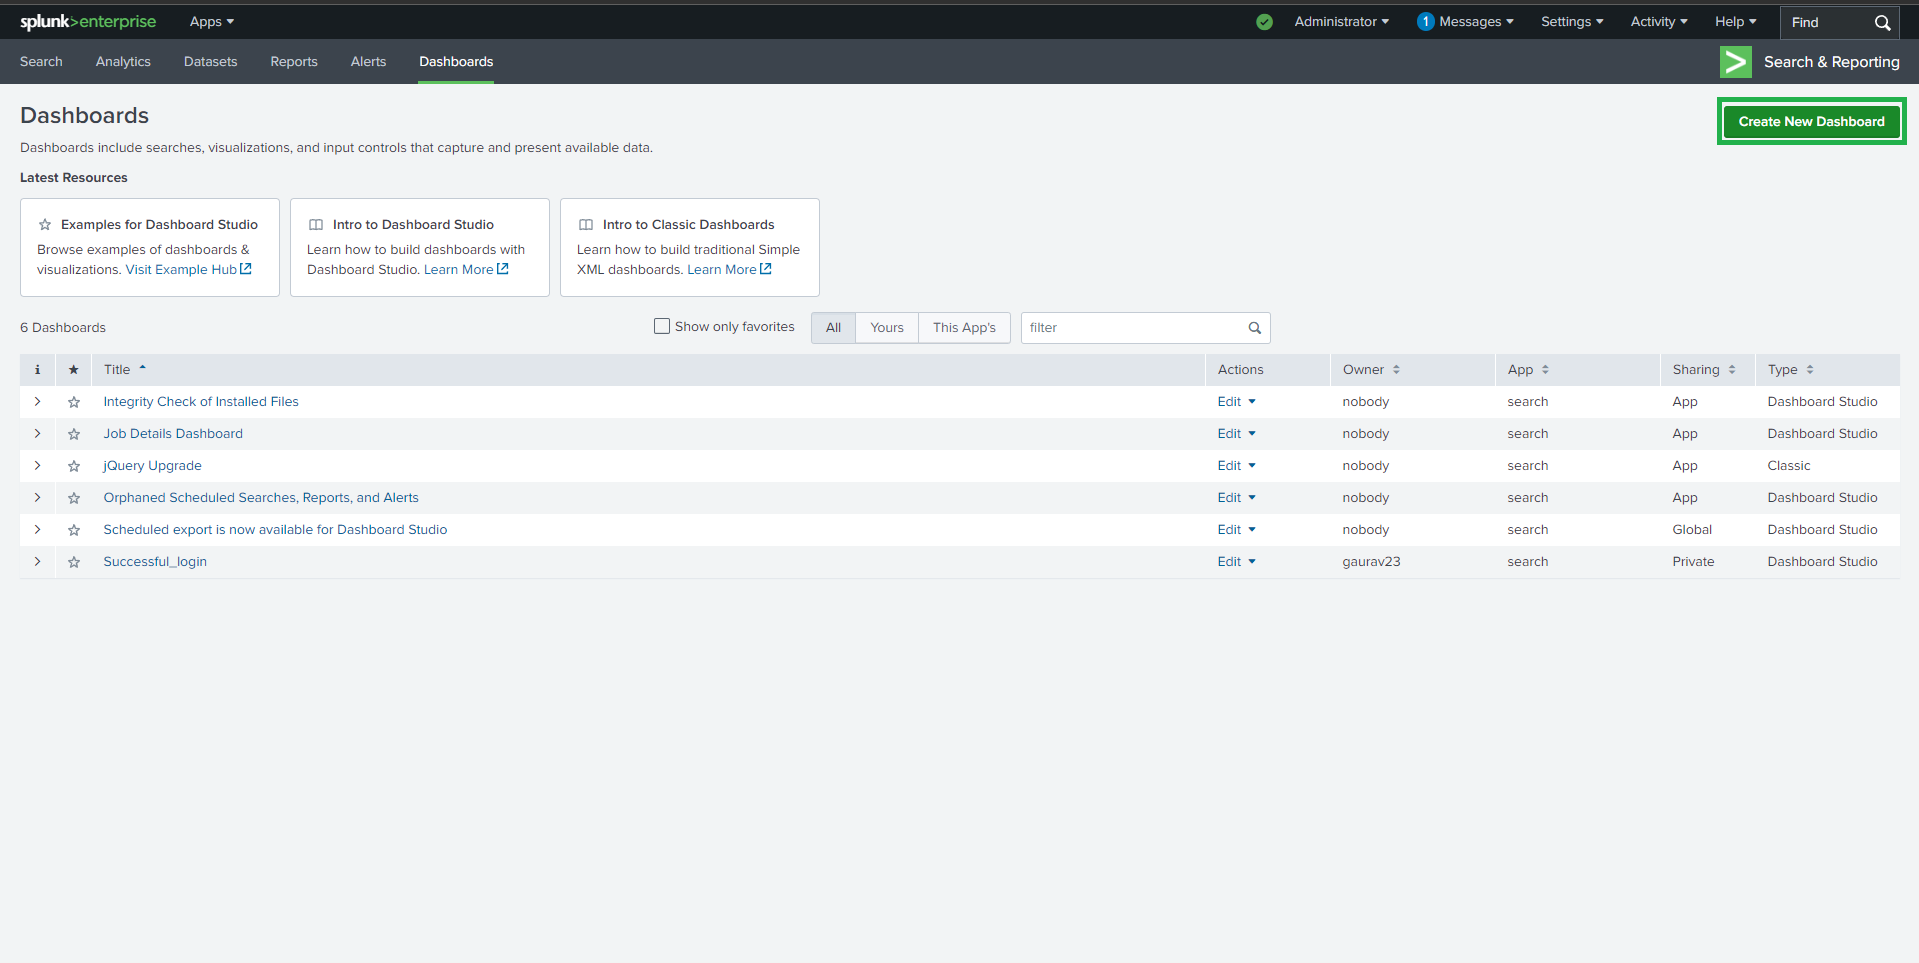
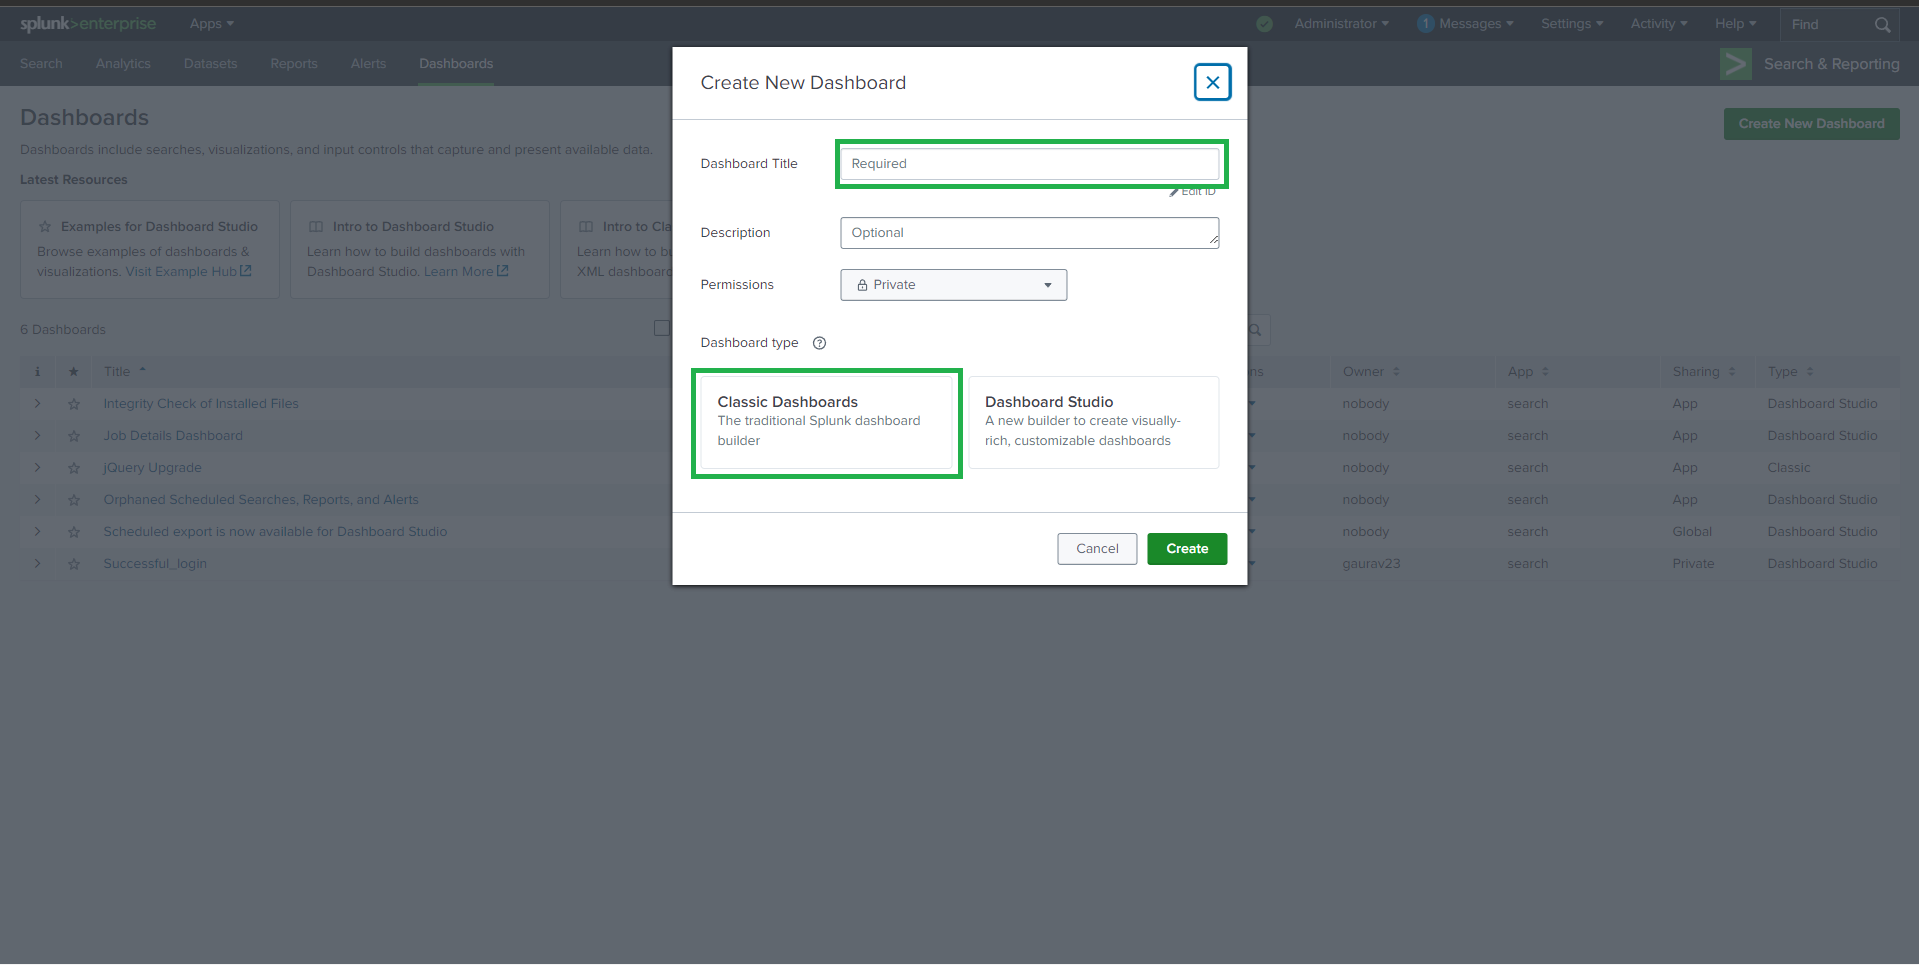
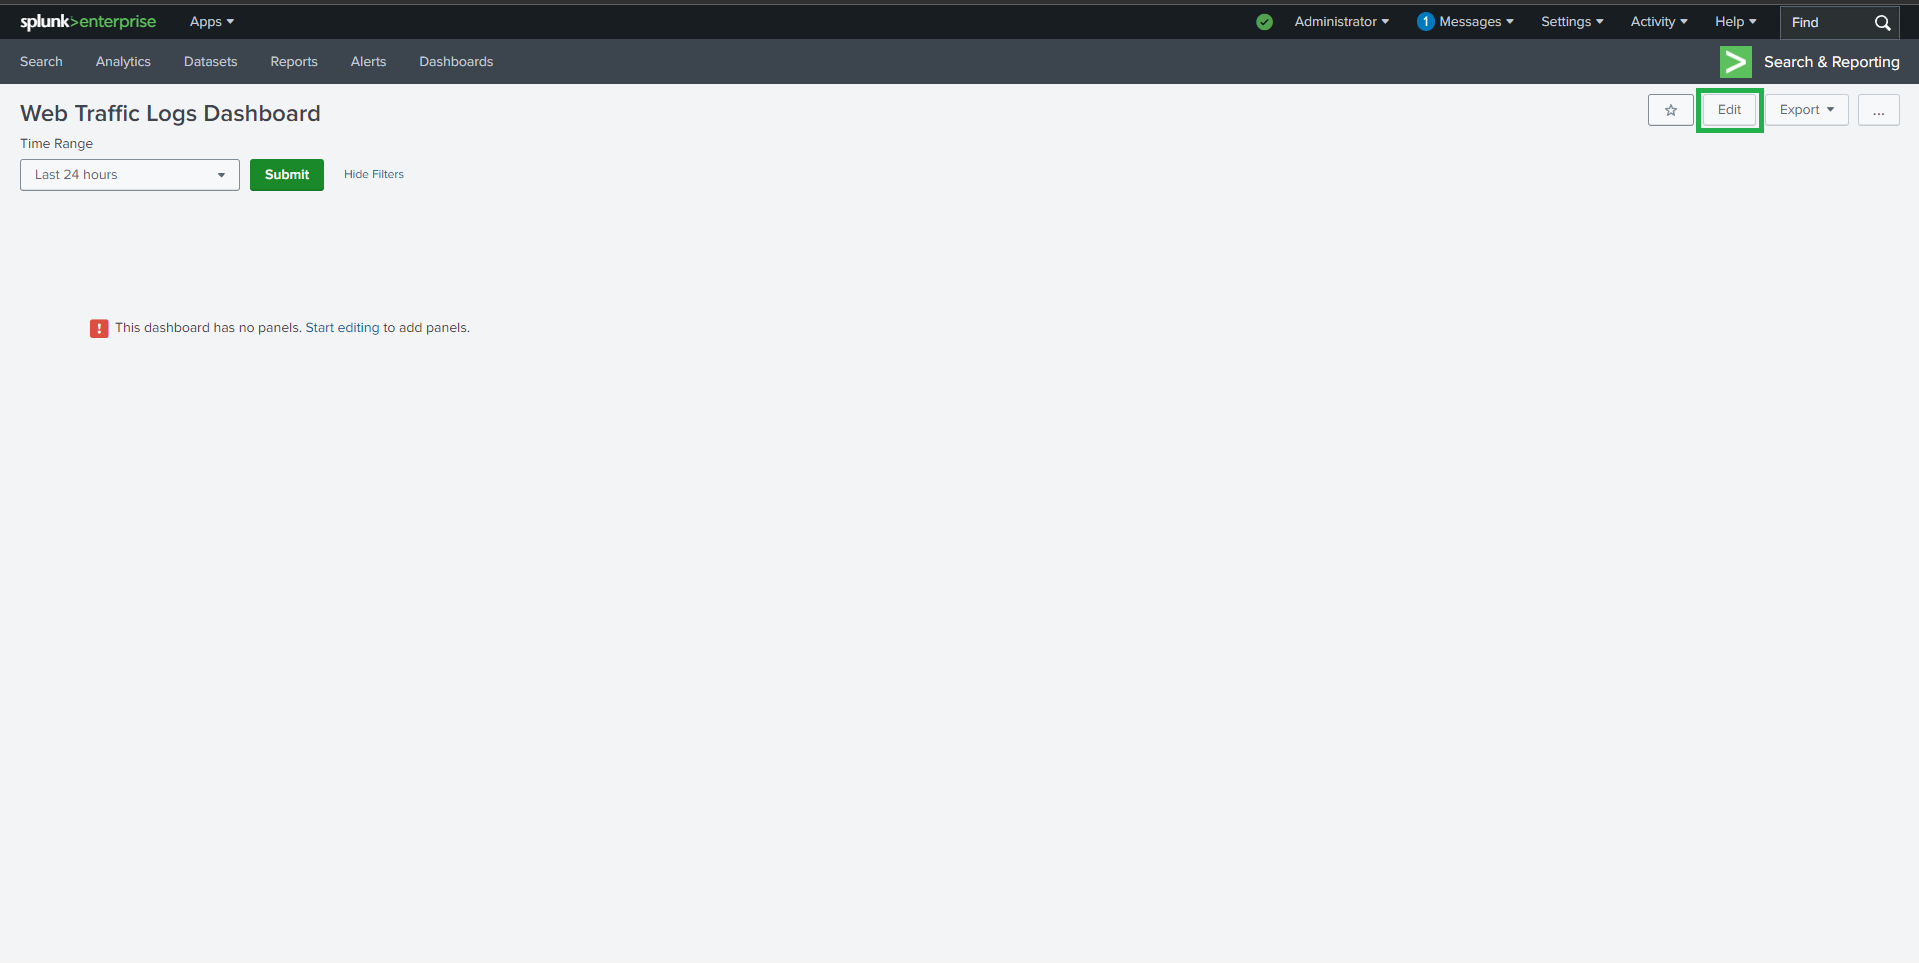
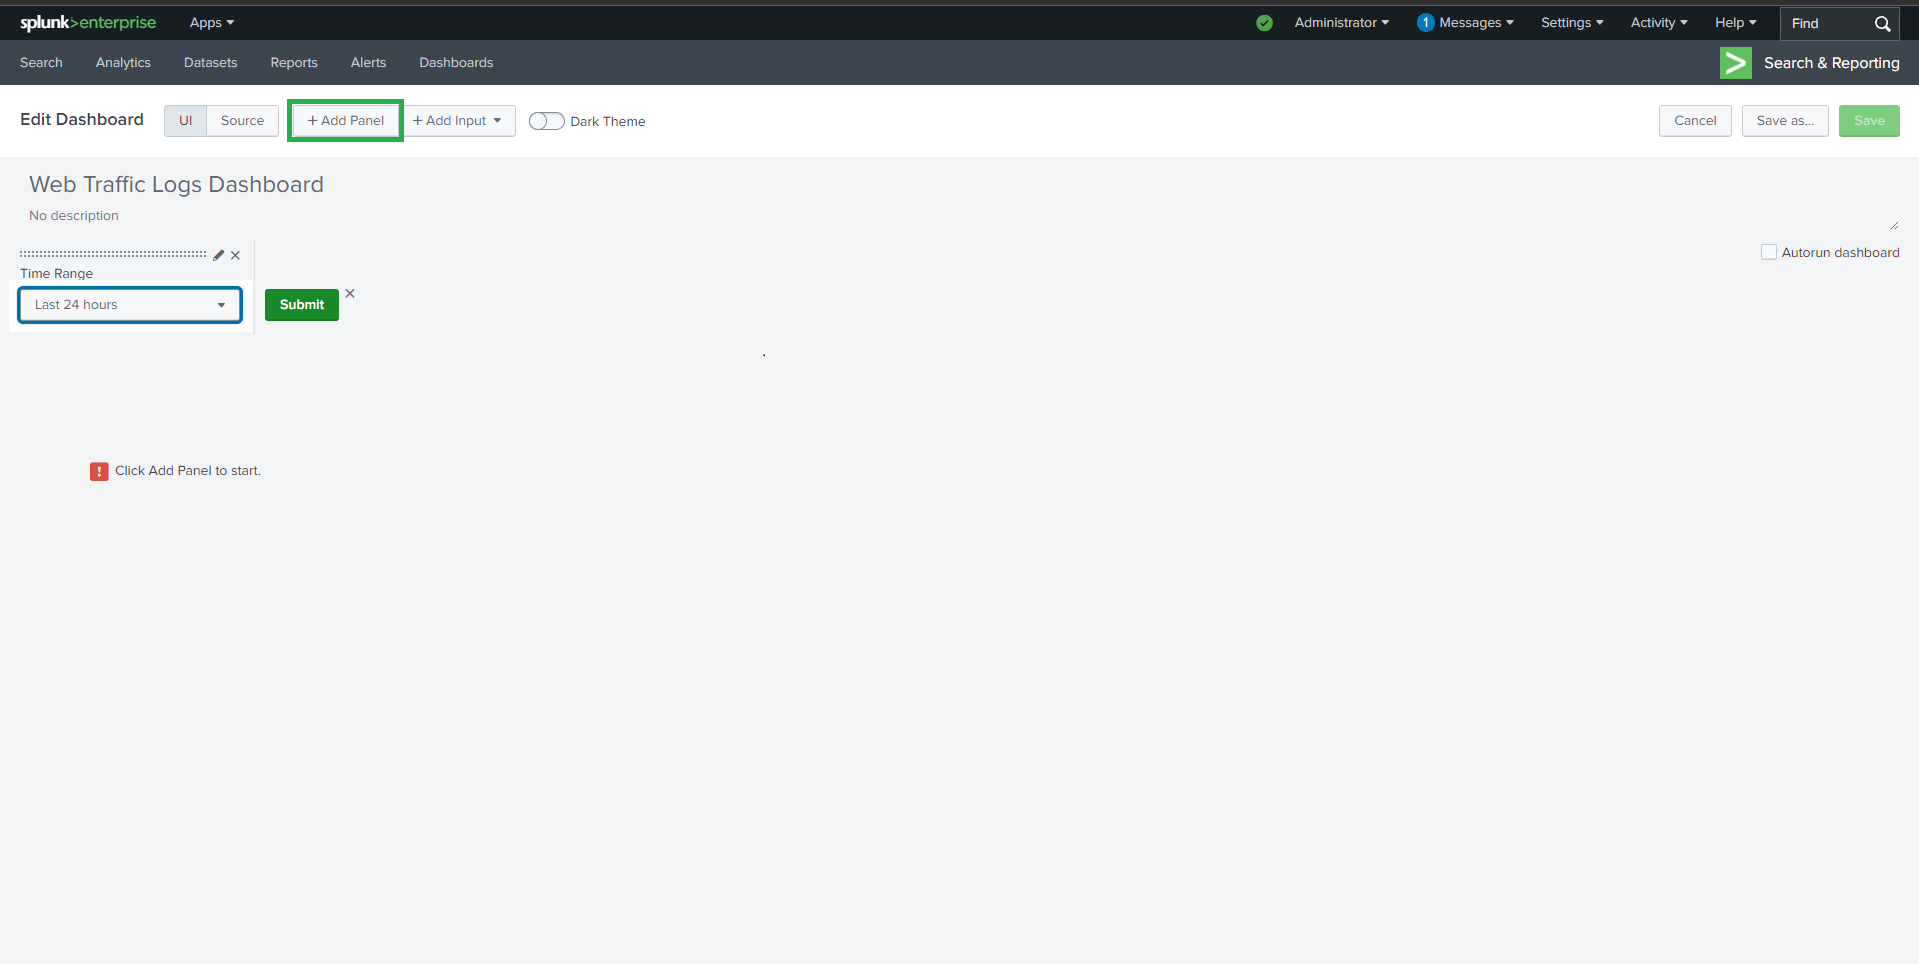
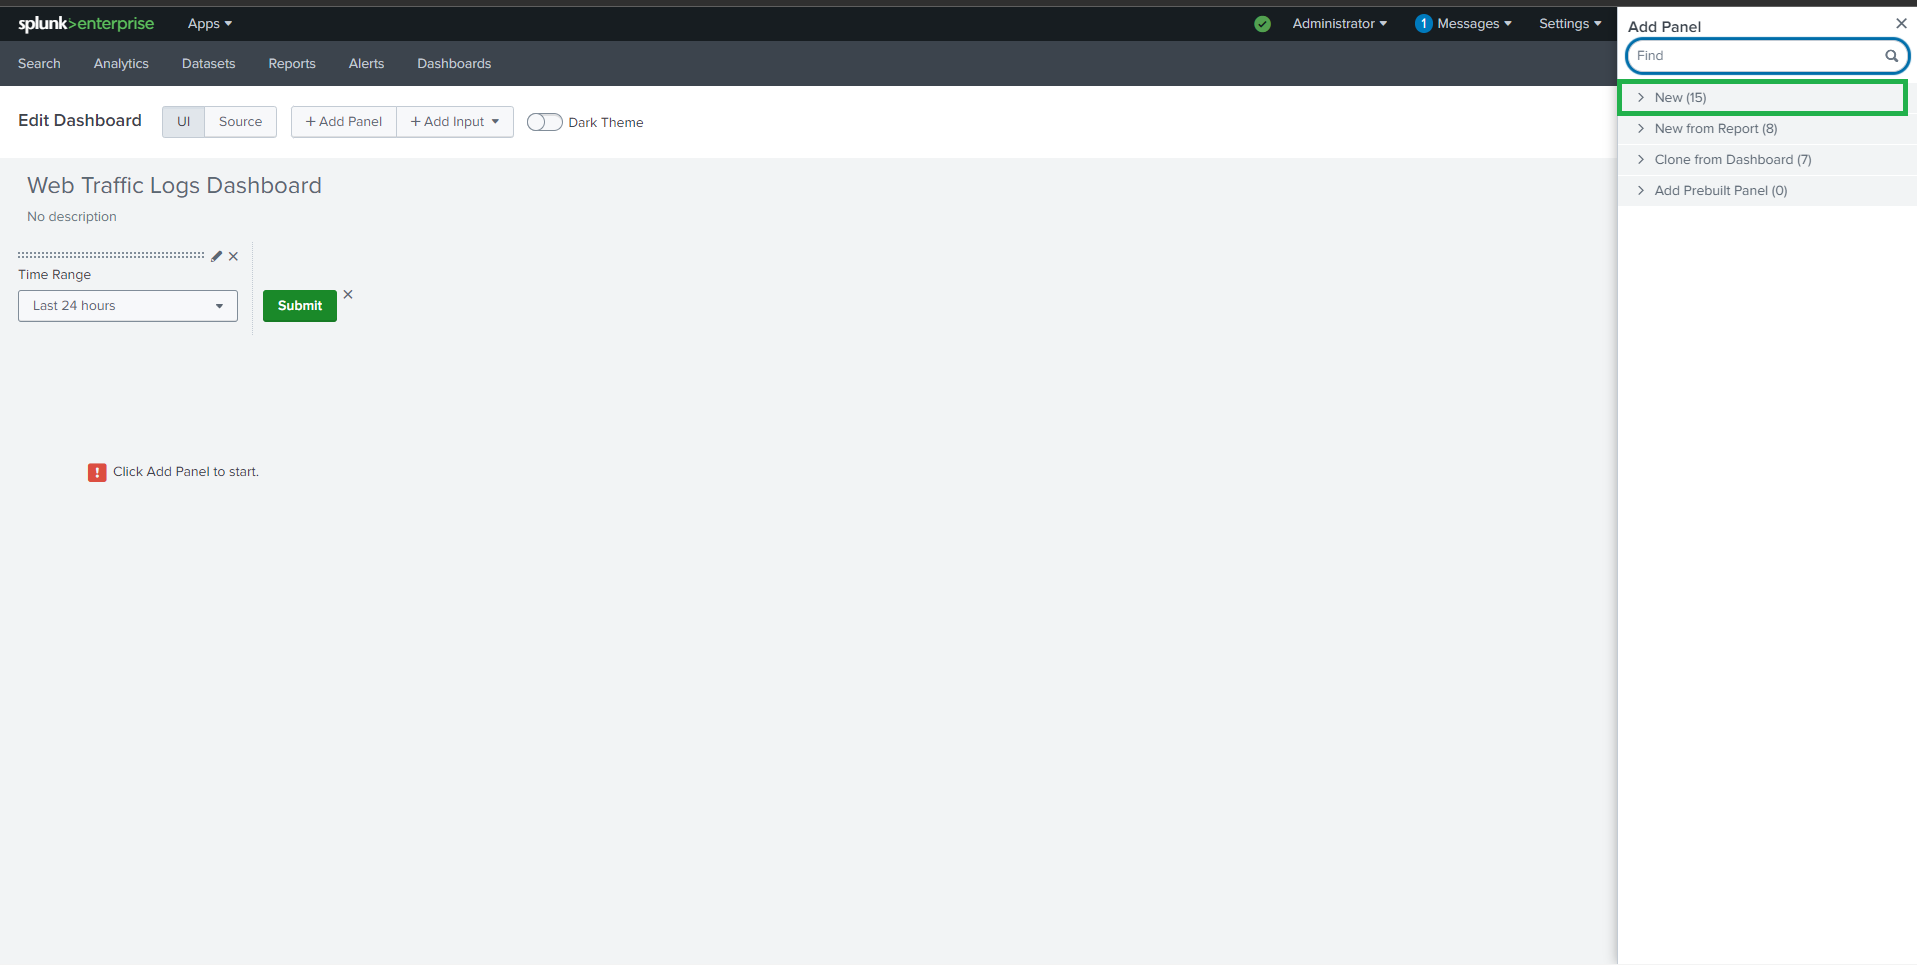
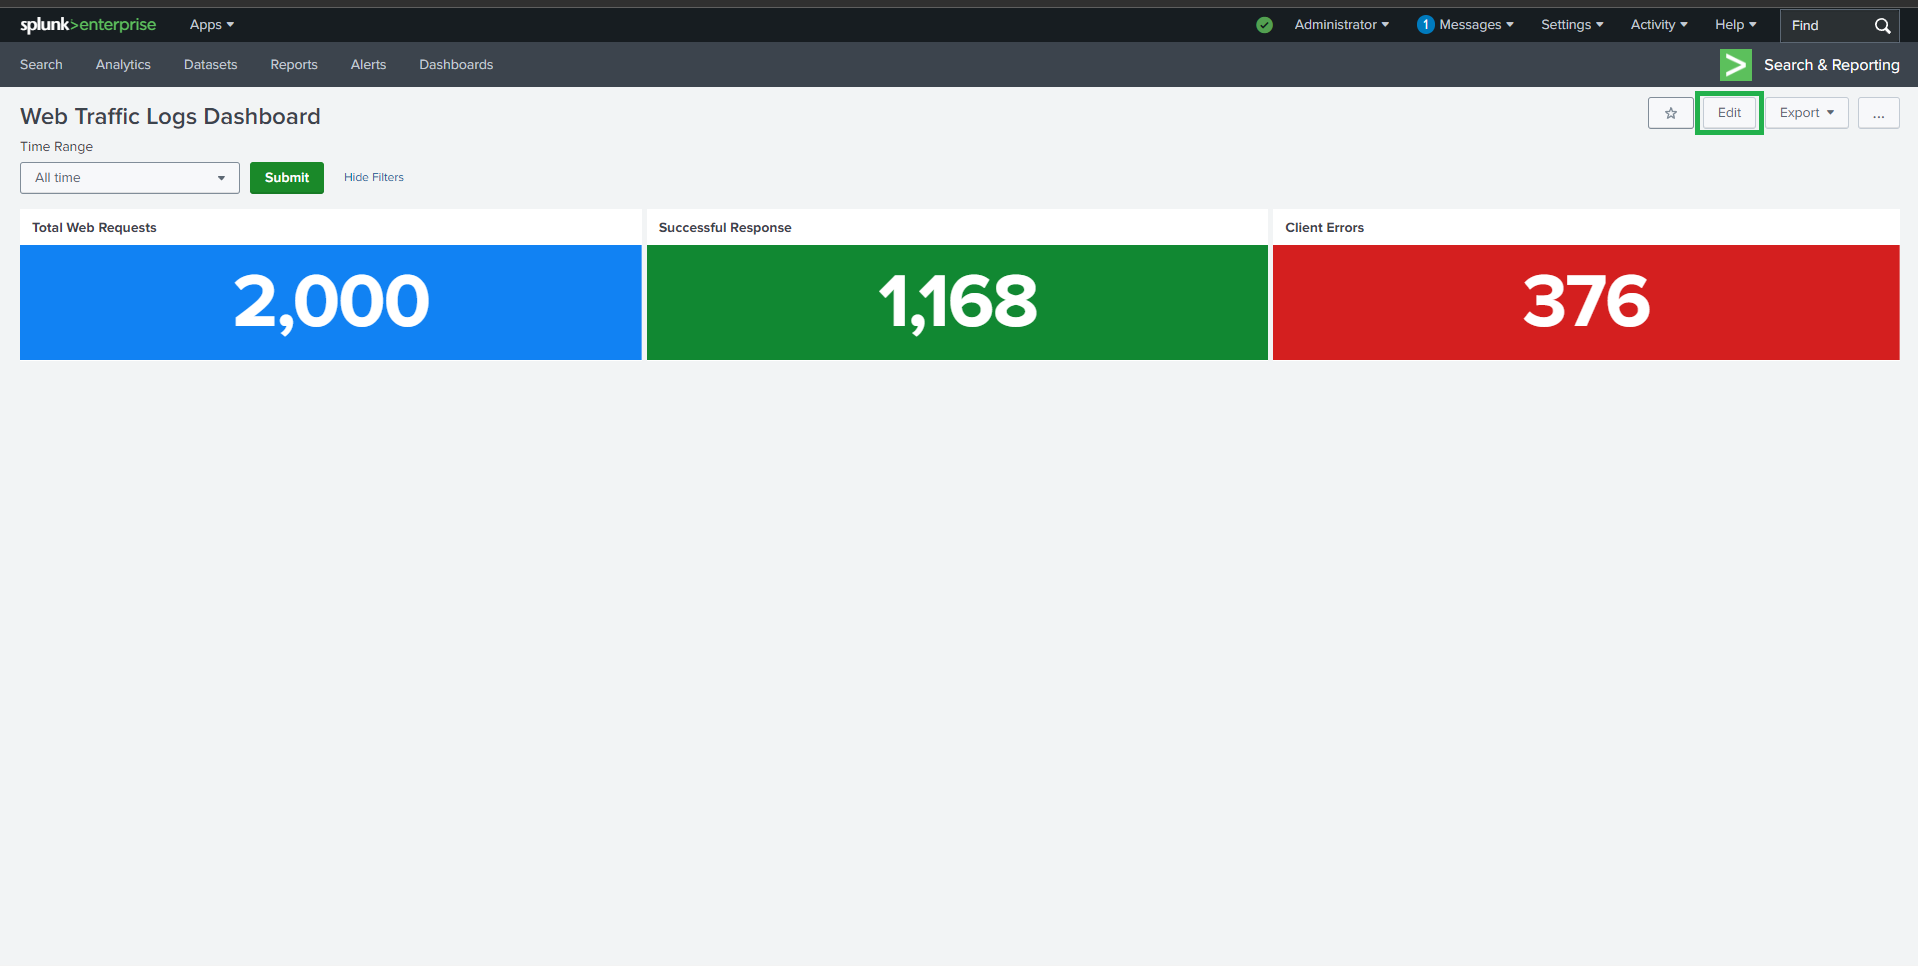
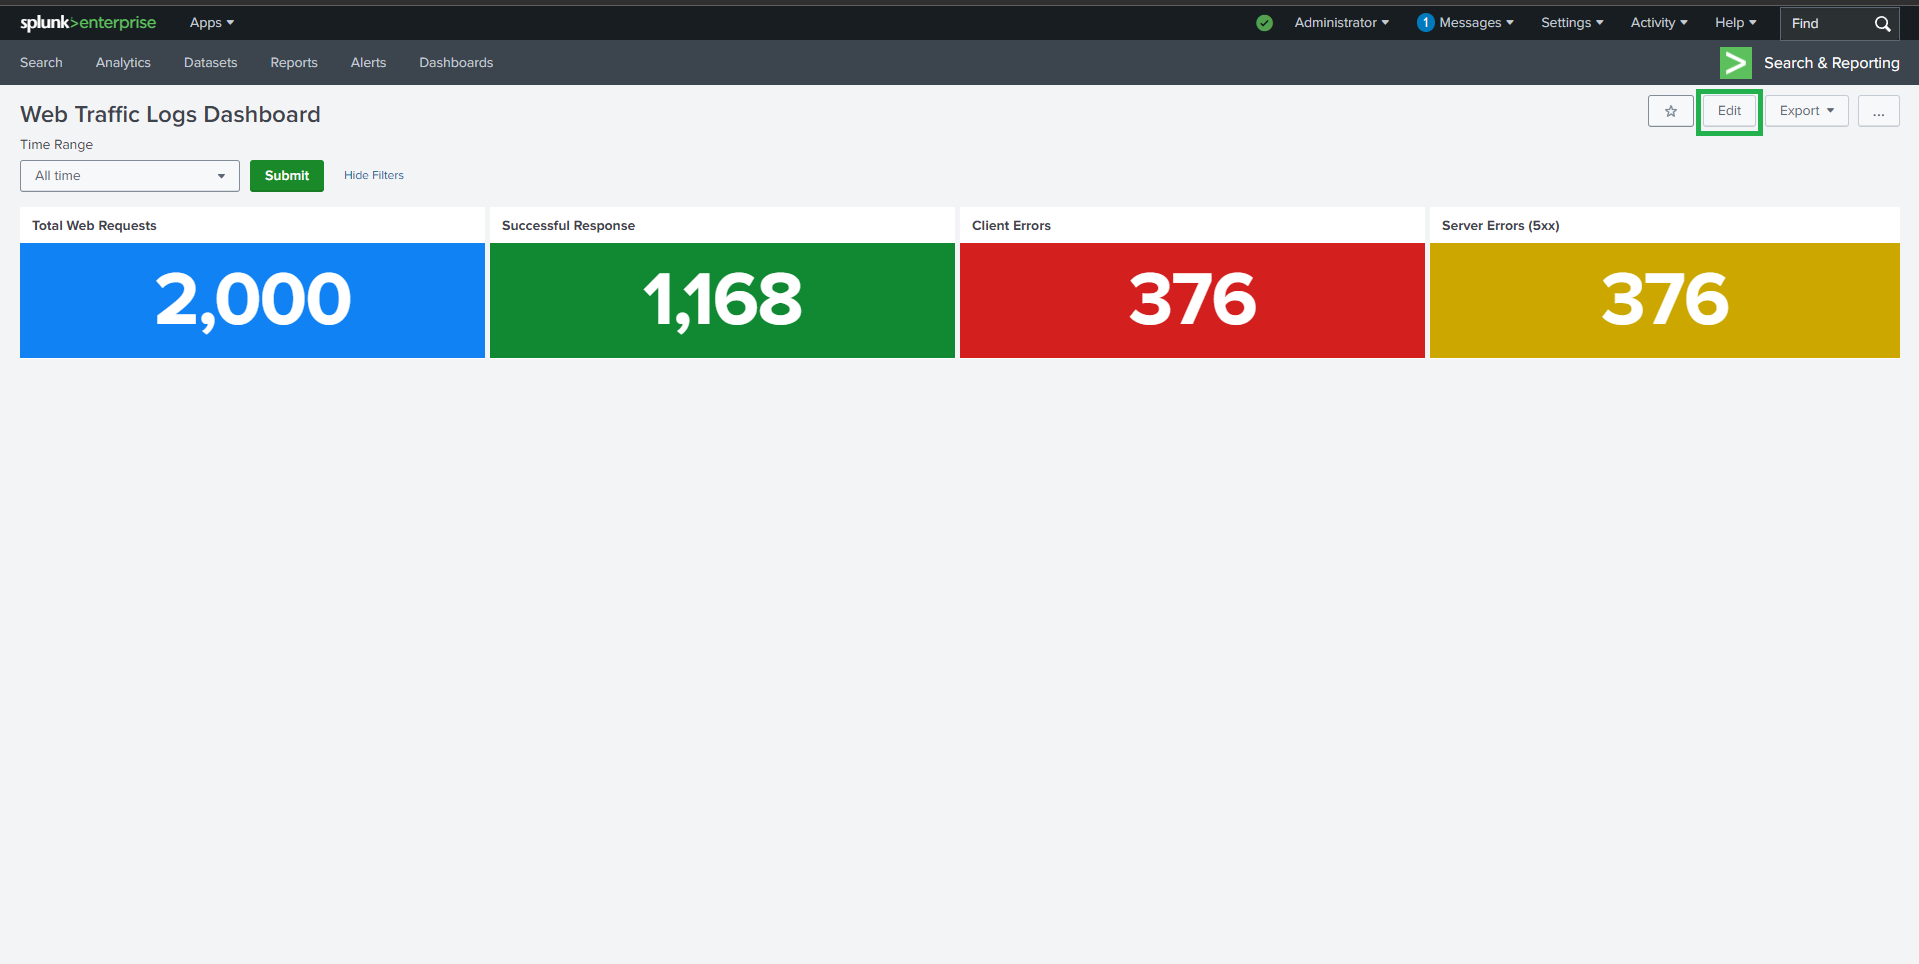
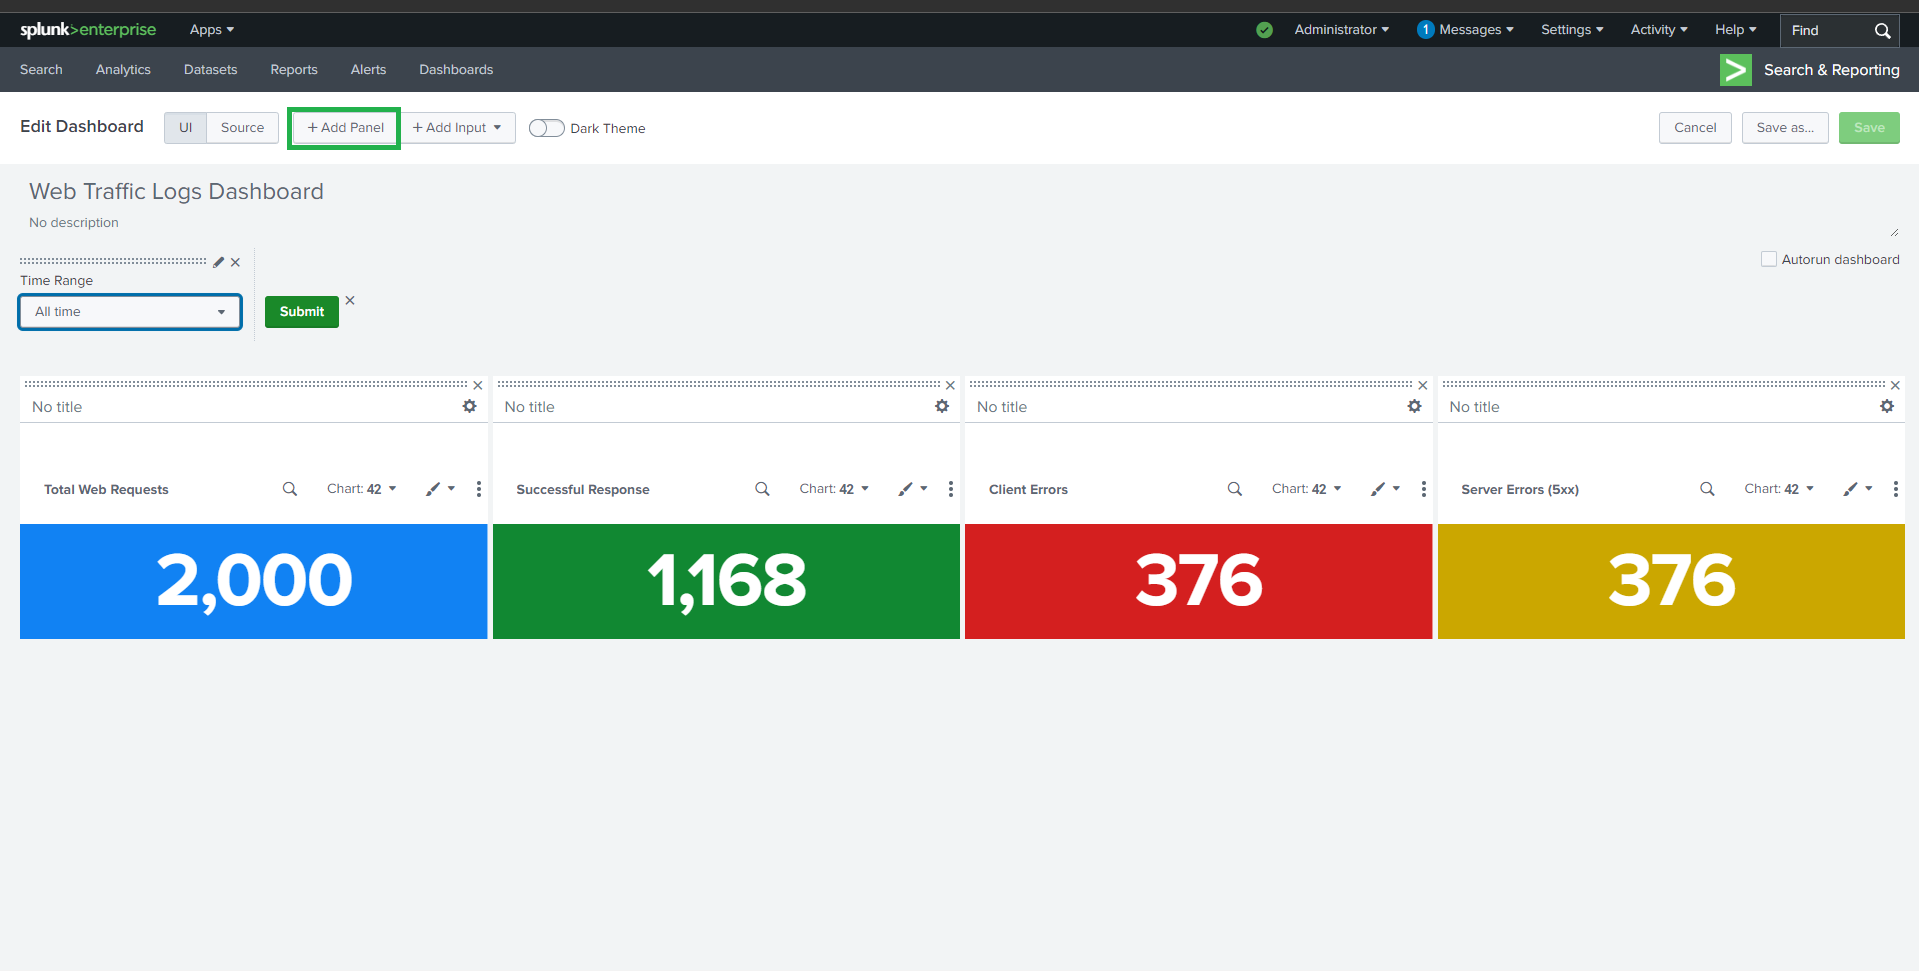
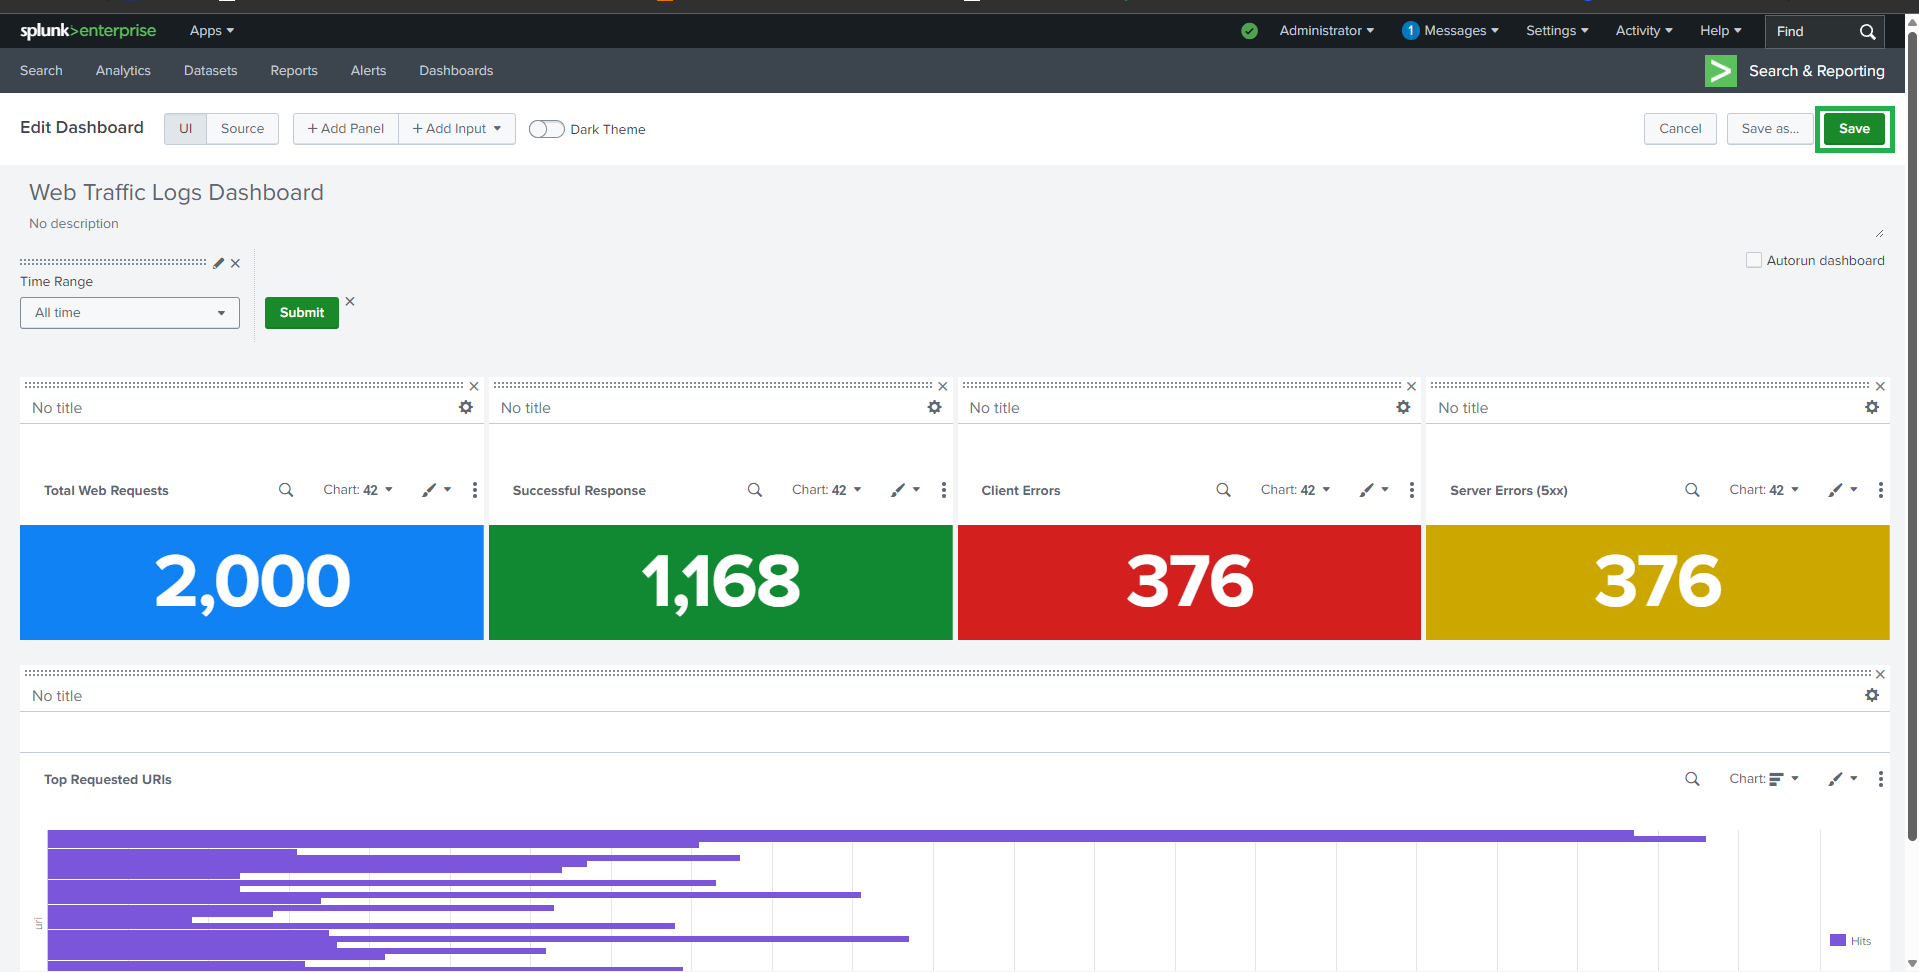
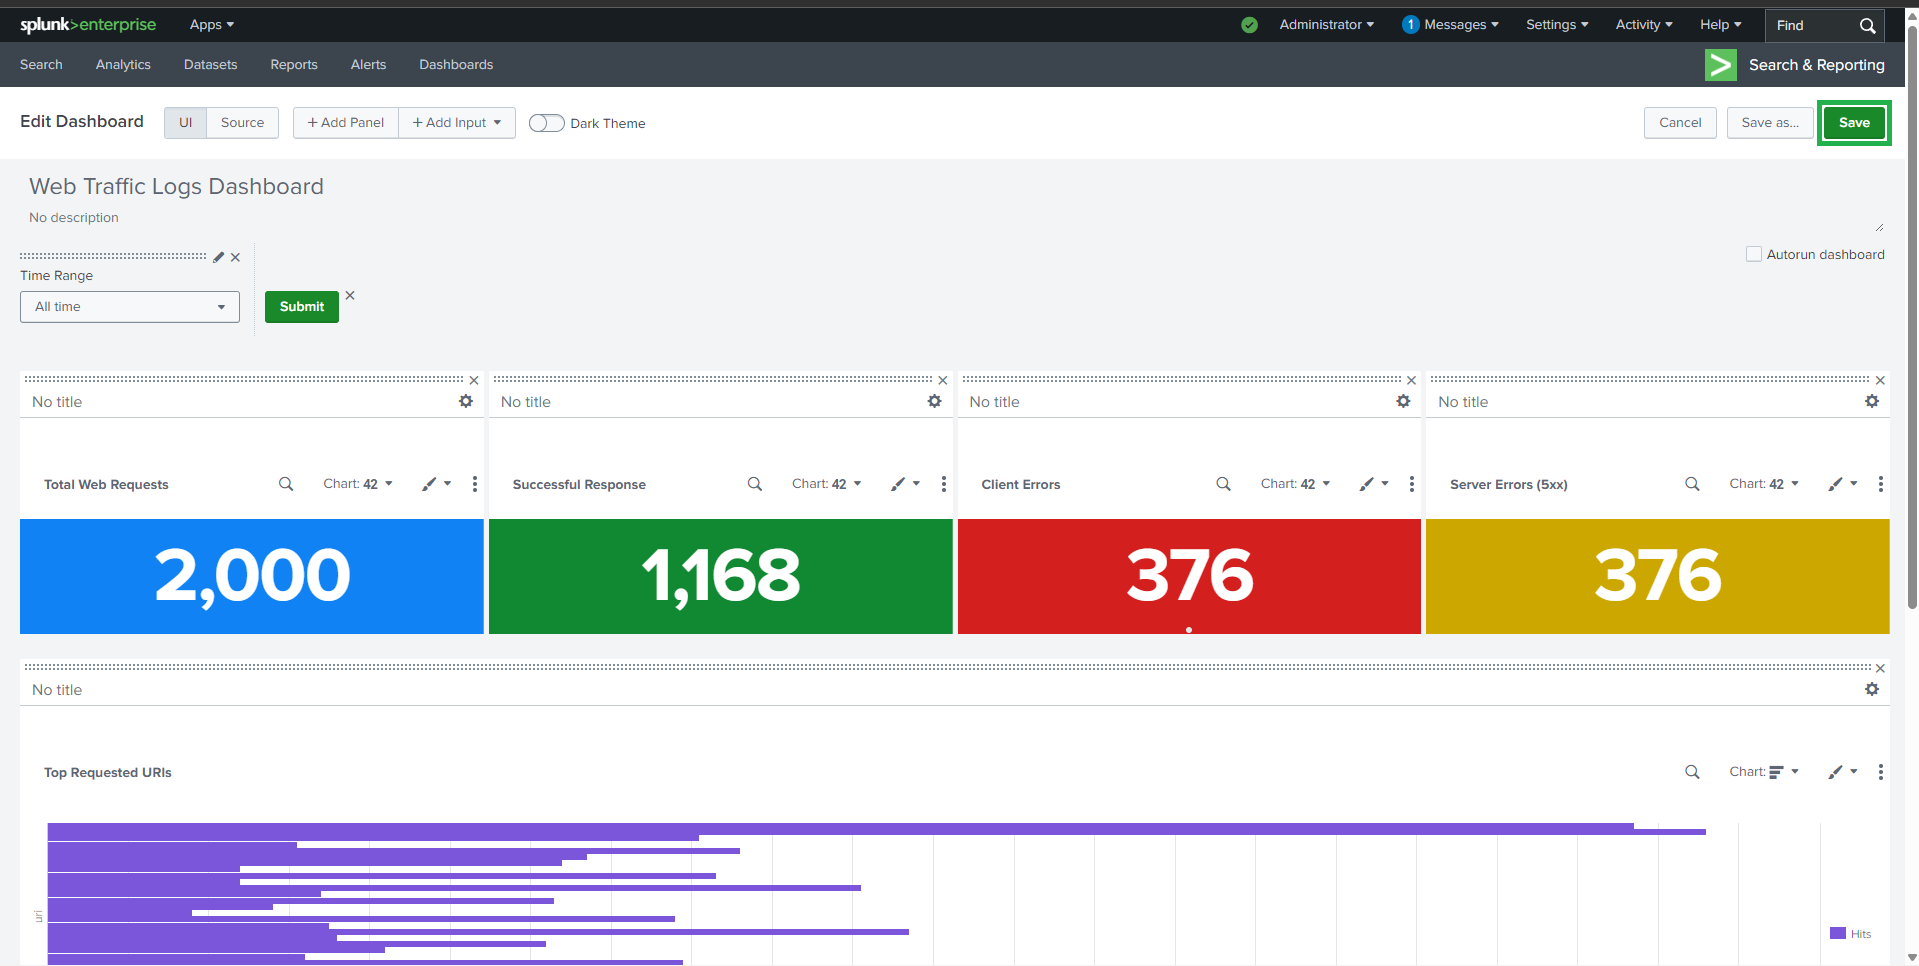
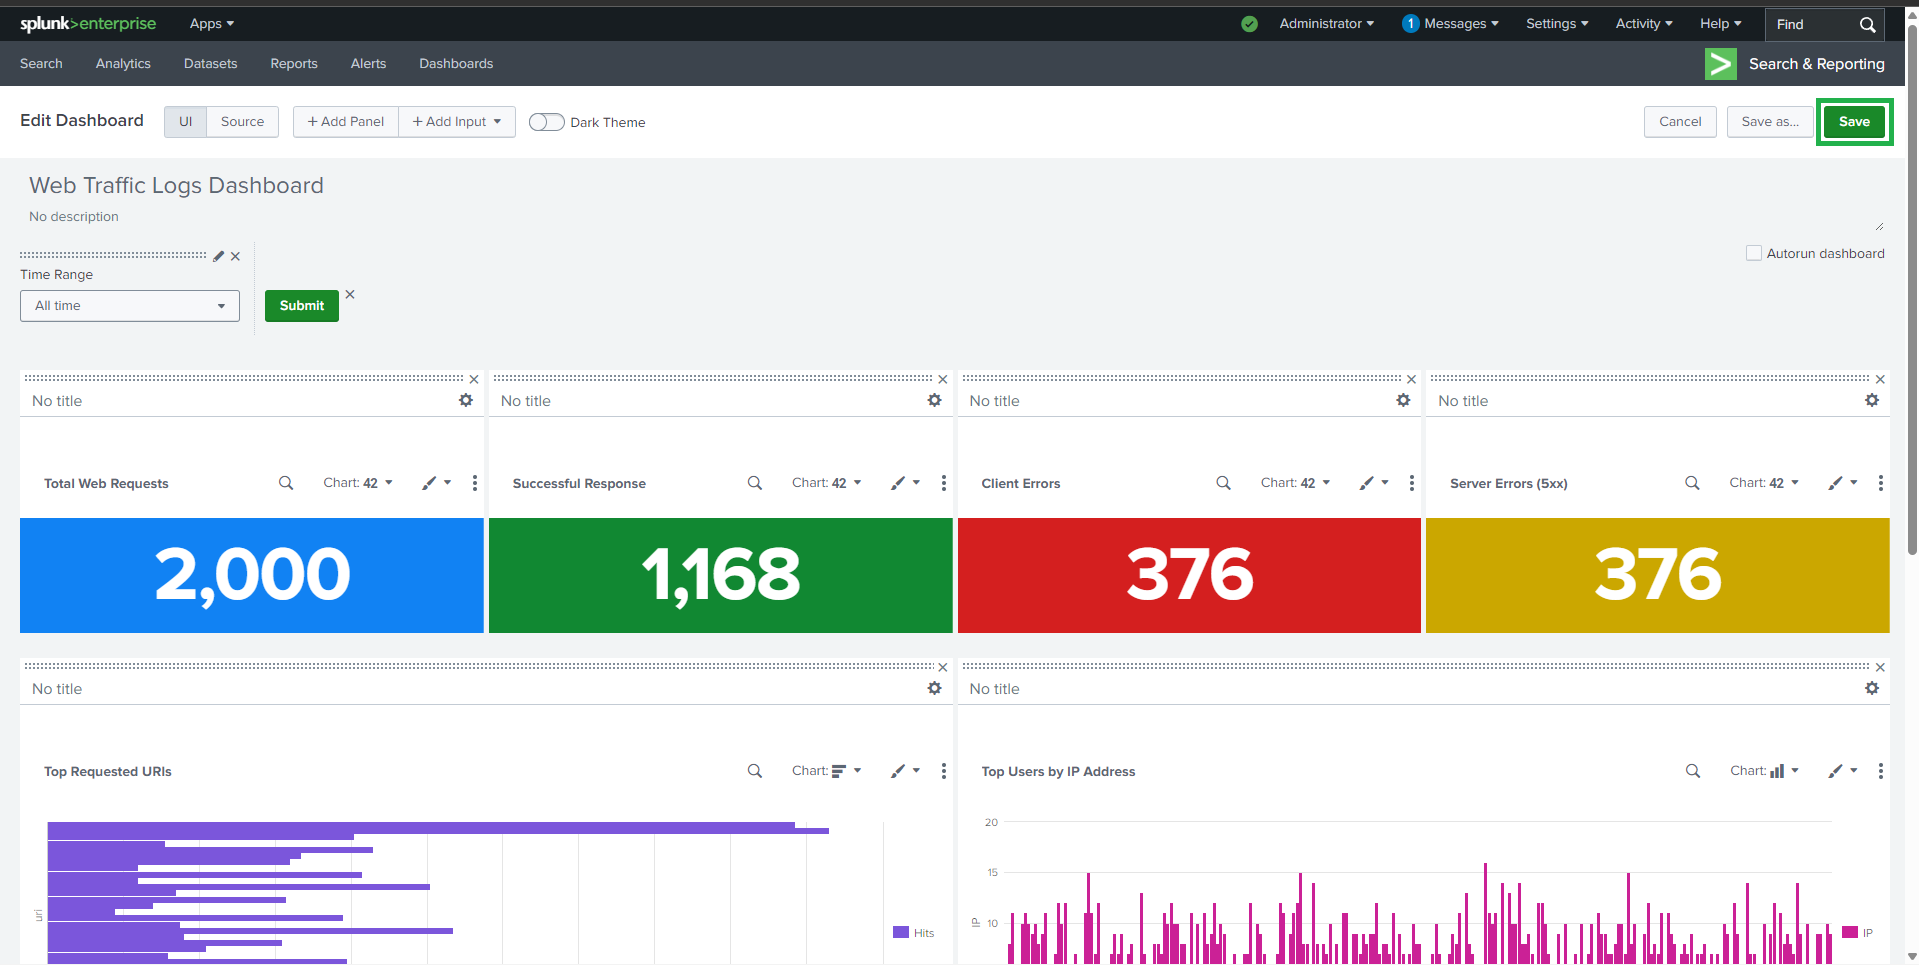
## 📊 Dashboard 创建
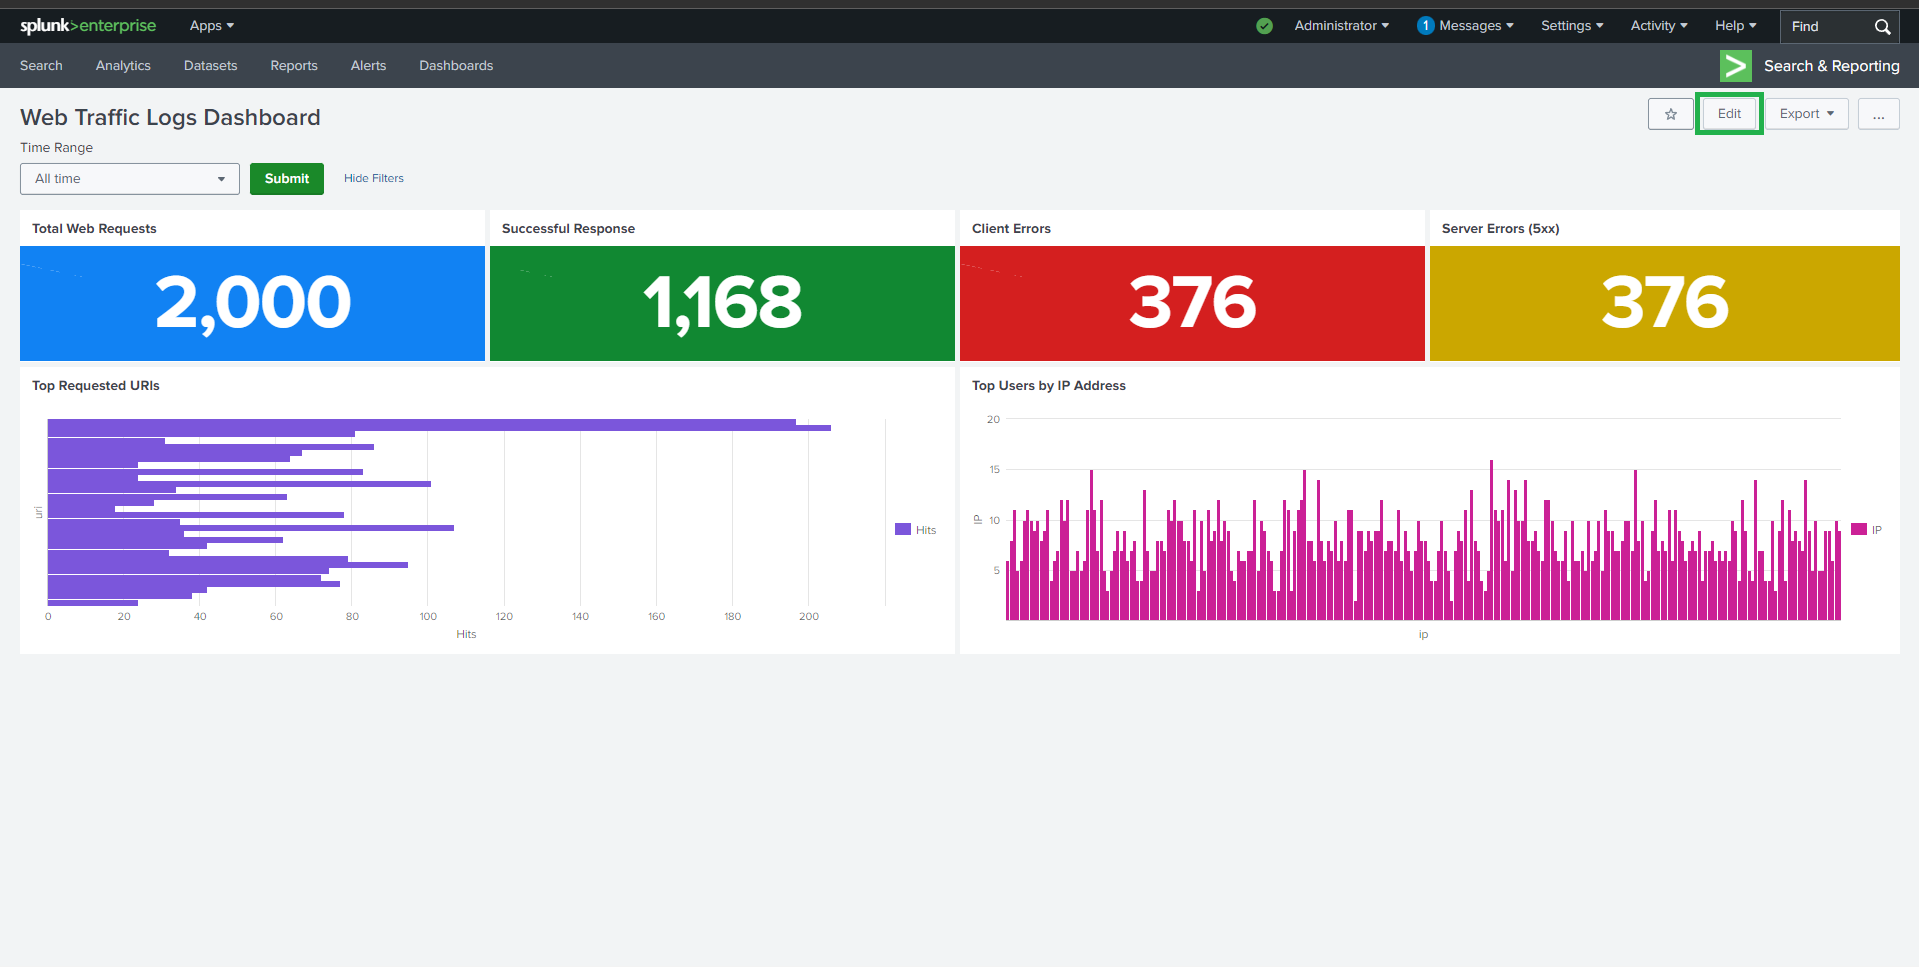
### Dashboard 详情
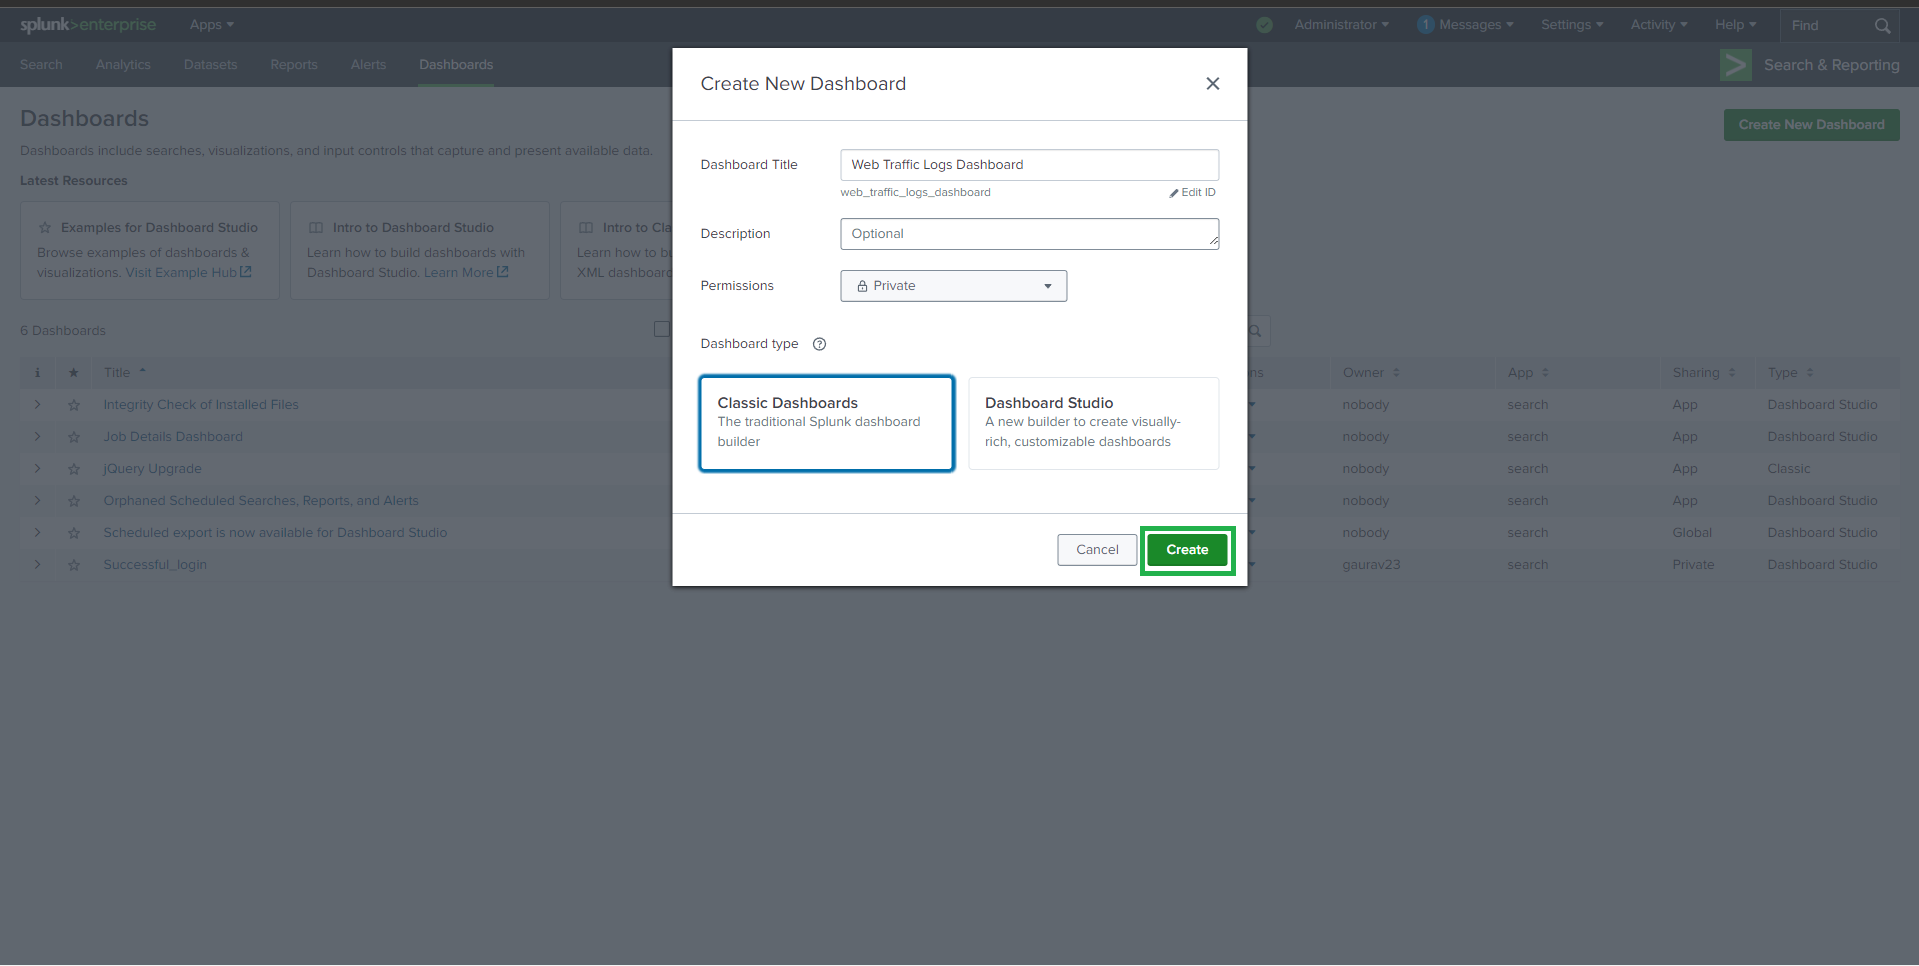
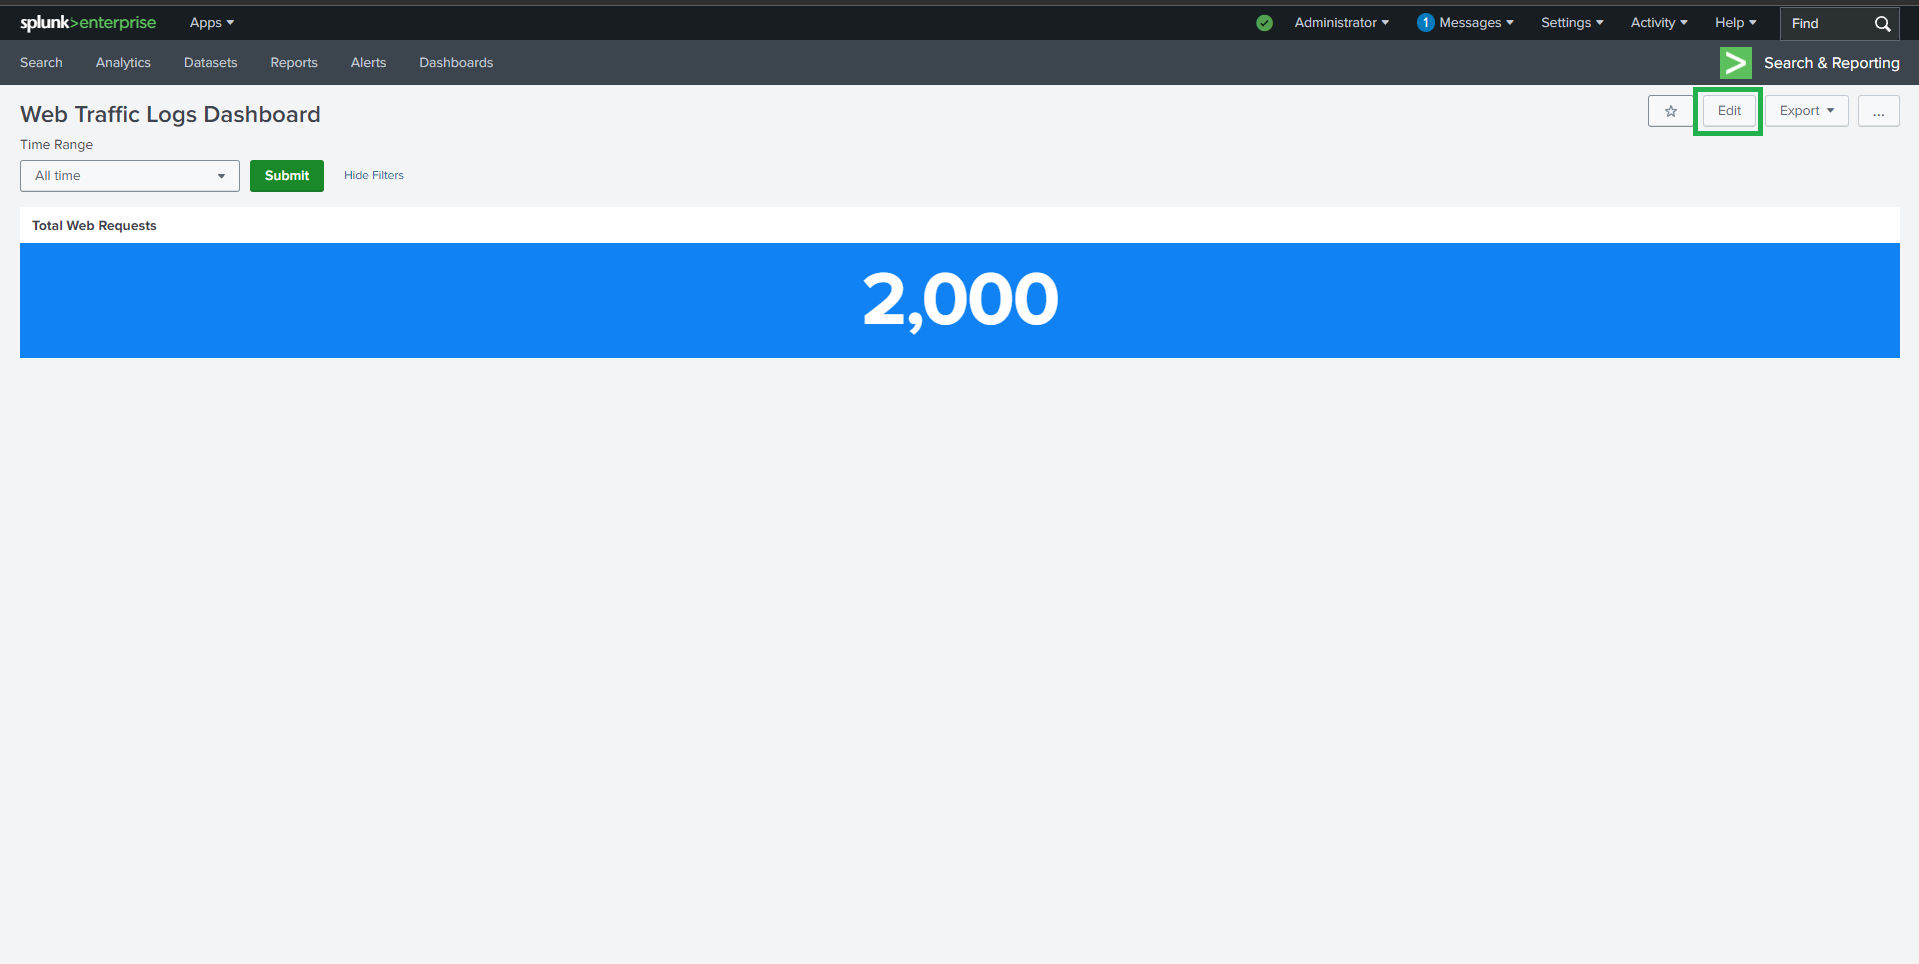
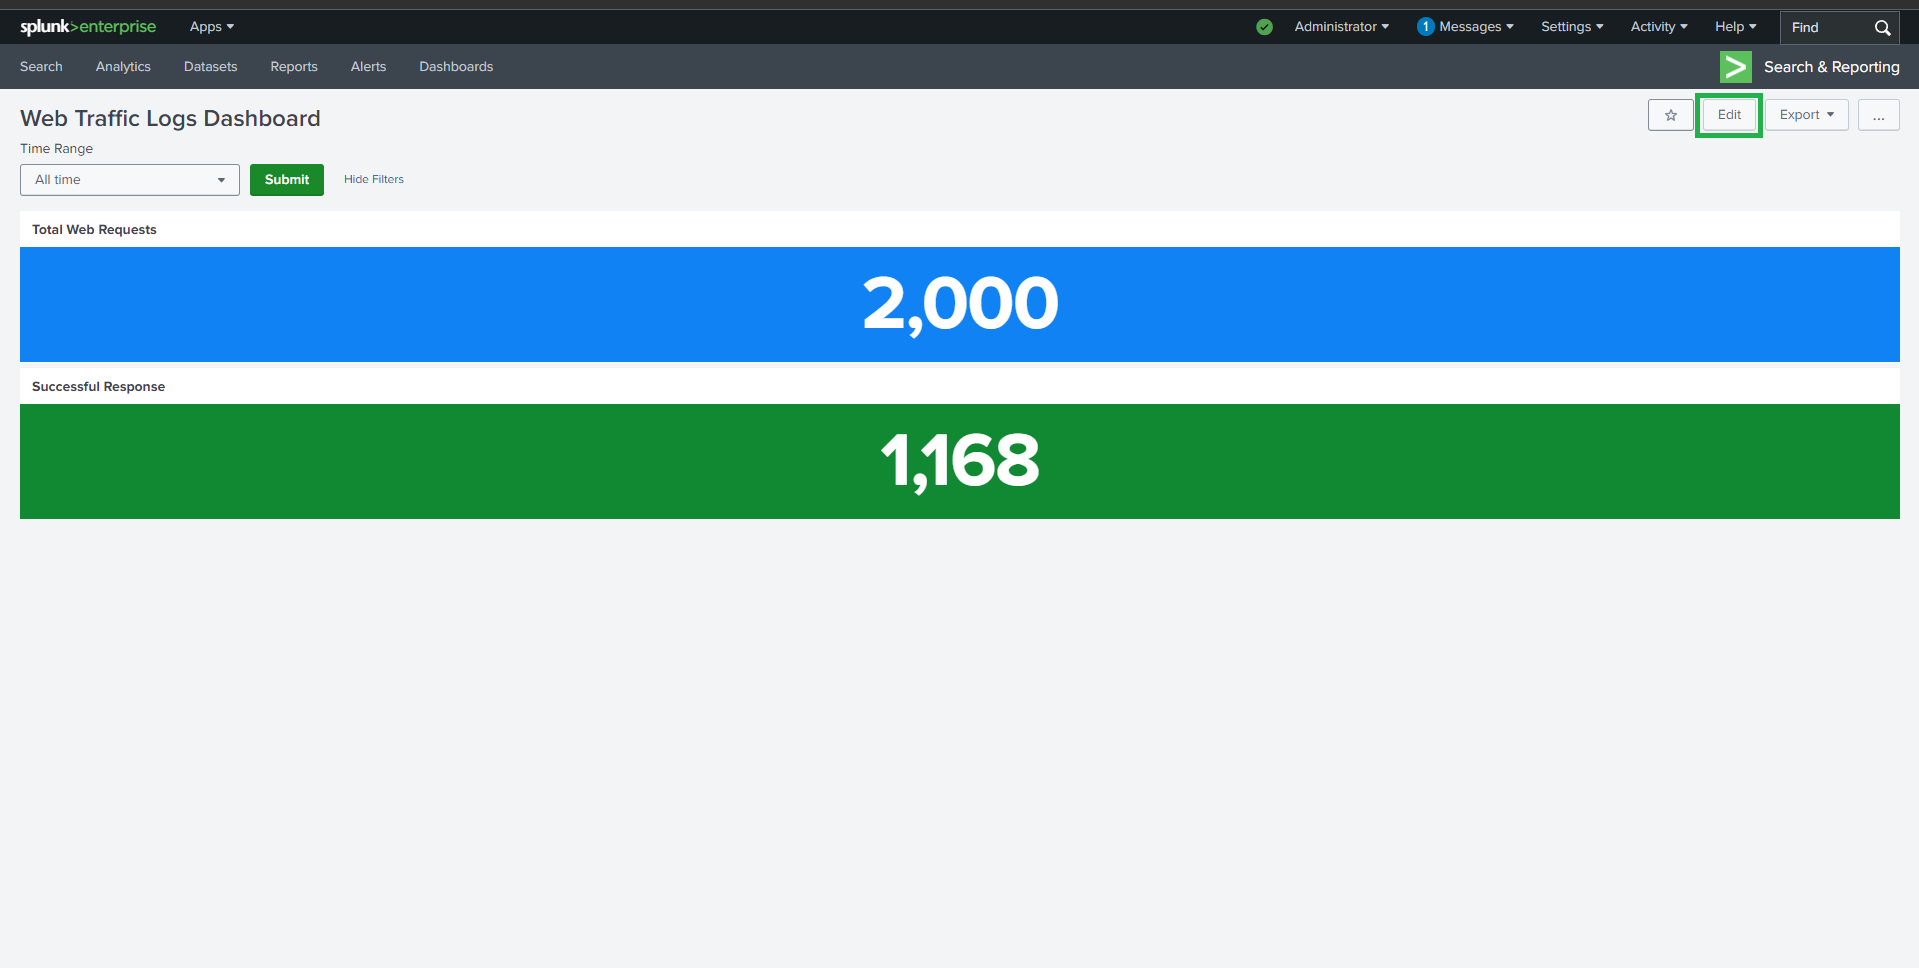
* **Dashboard Name**: Web Traffic Logs Dashboard
* **Dashboard Type**: Classic Dashboard
* **Permissions**: Private
验证摄取:
```
#### source="apache_logs.json"
---
## 📊 Dashboard 创建
### Dashboard 详情
* **Dashboard Name**: Web Traffic Logs Dashboard
* **Dashboard Type**: Classic Dashboard
* **Permissions**: Private
 ##
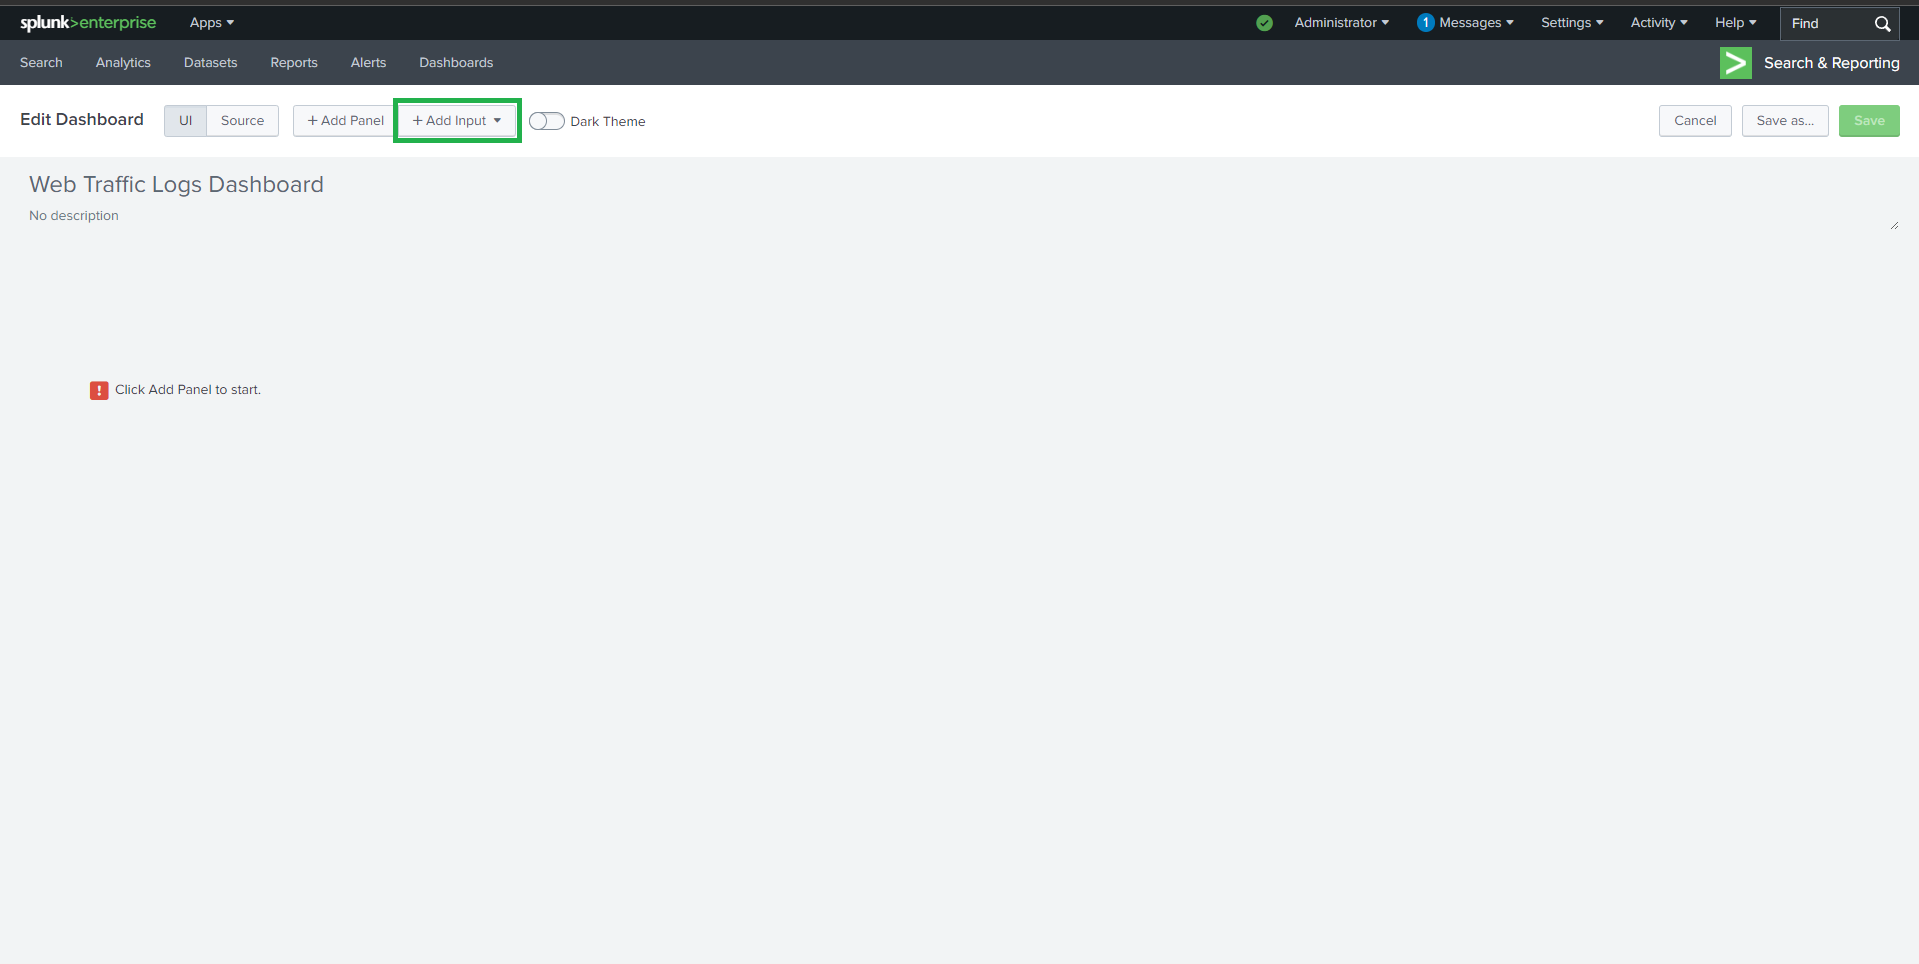
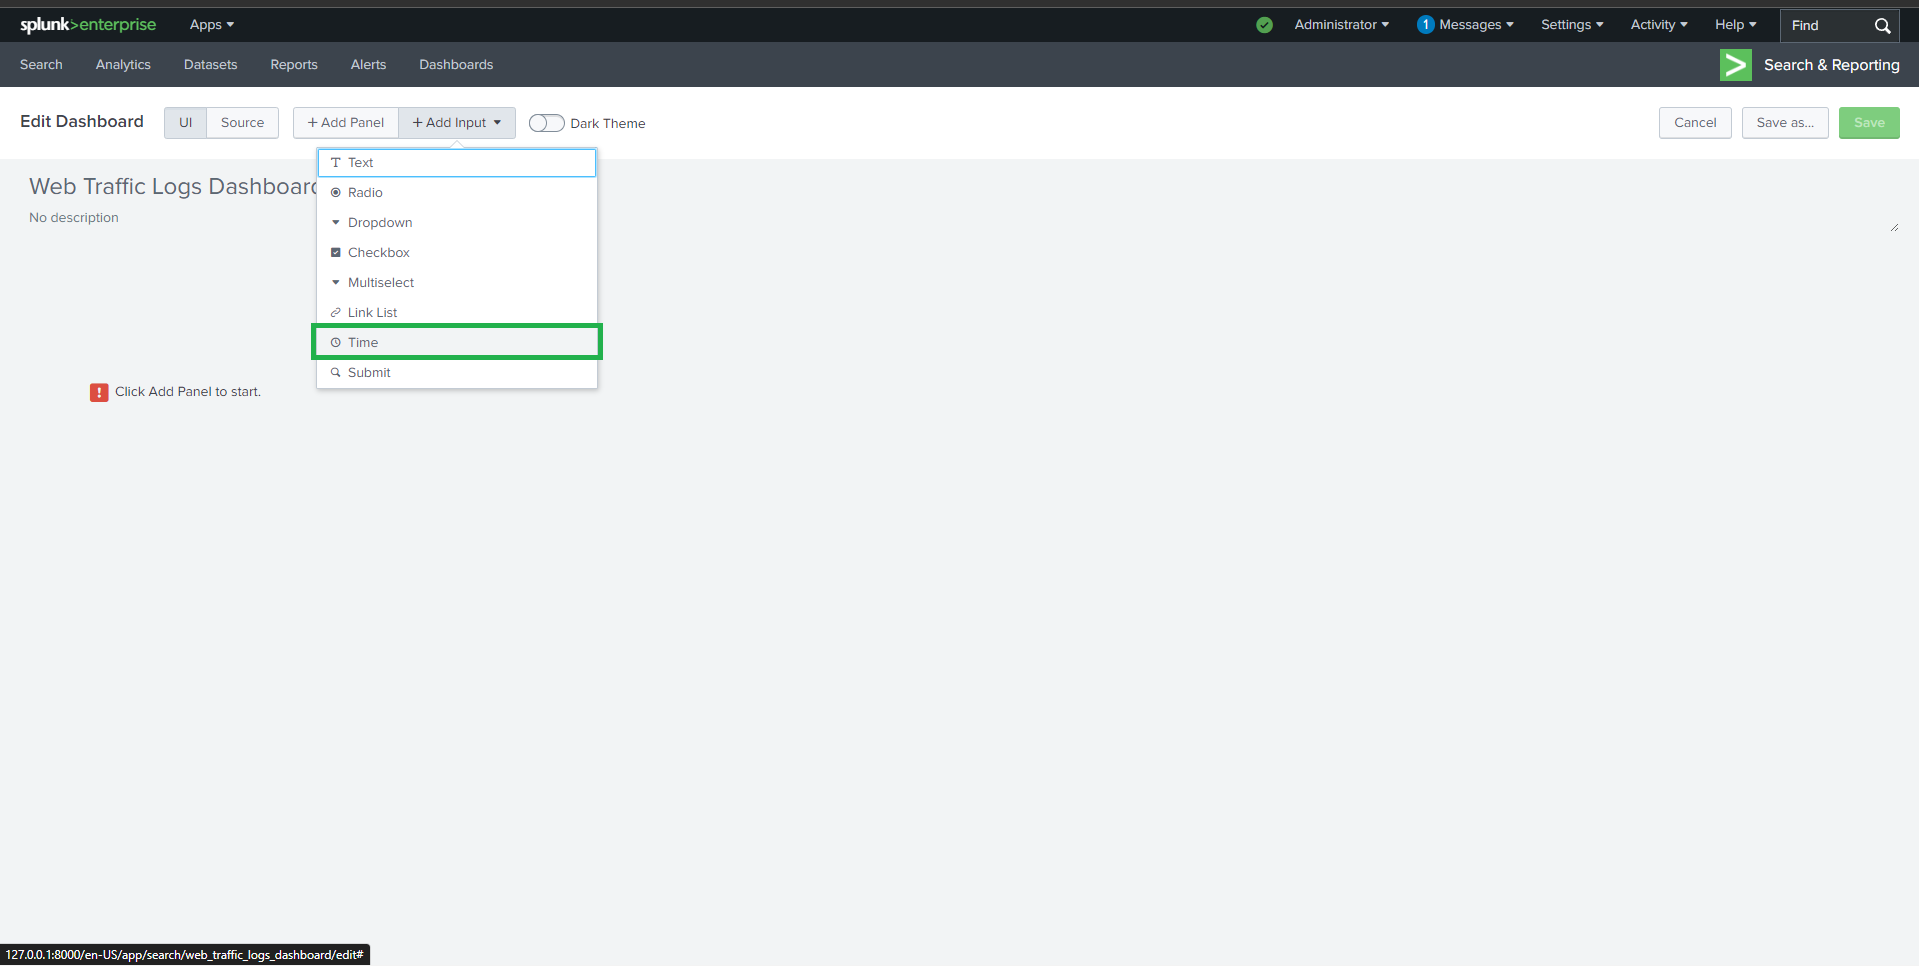
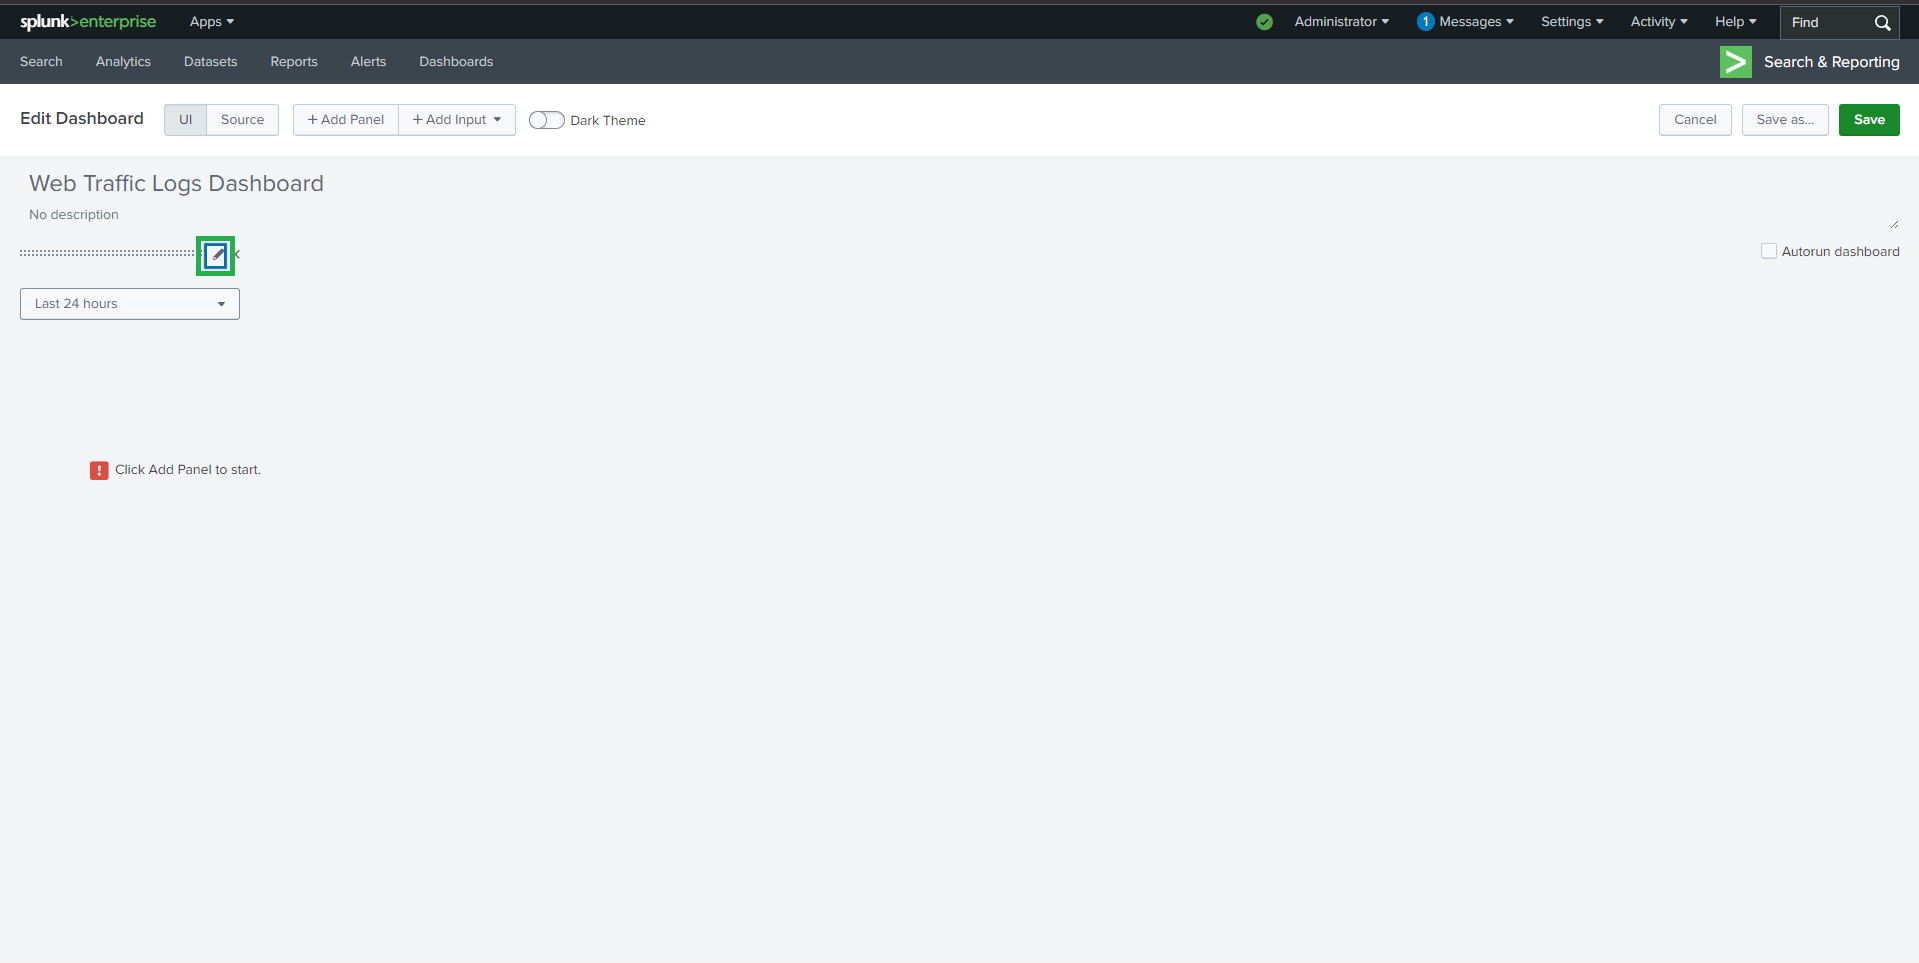
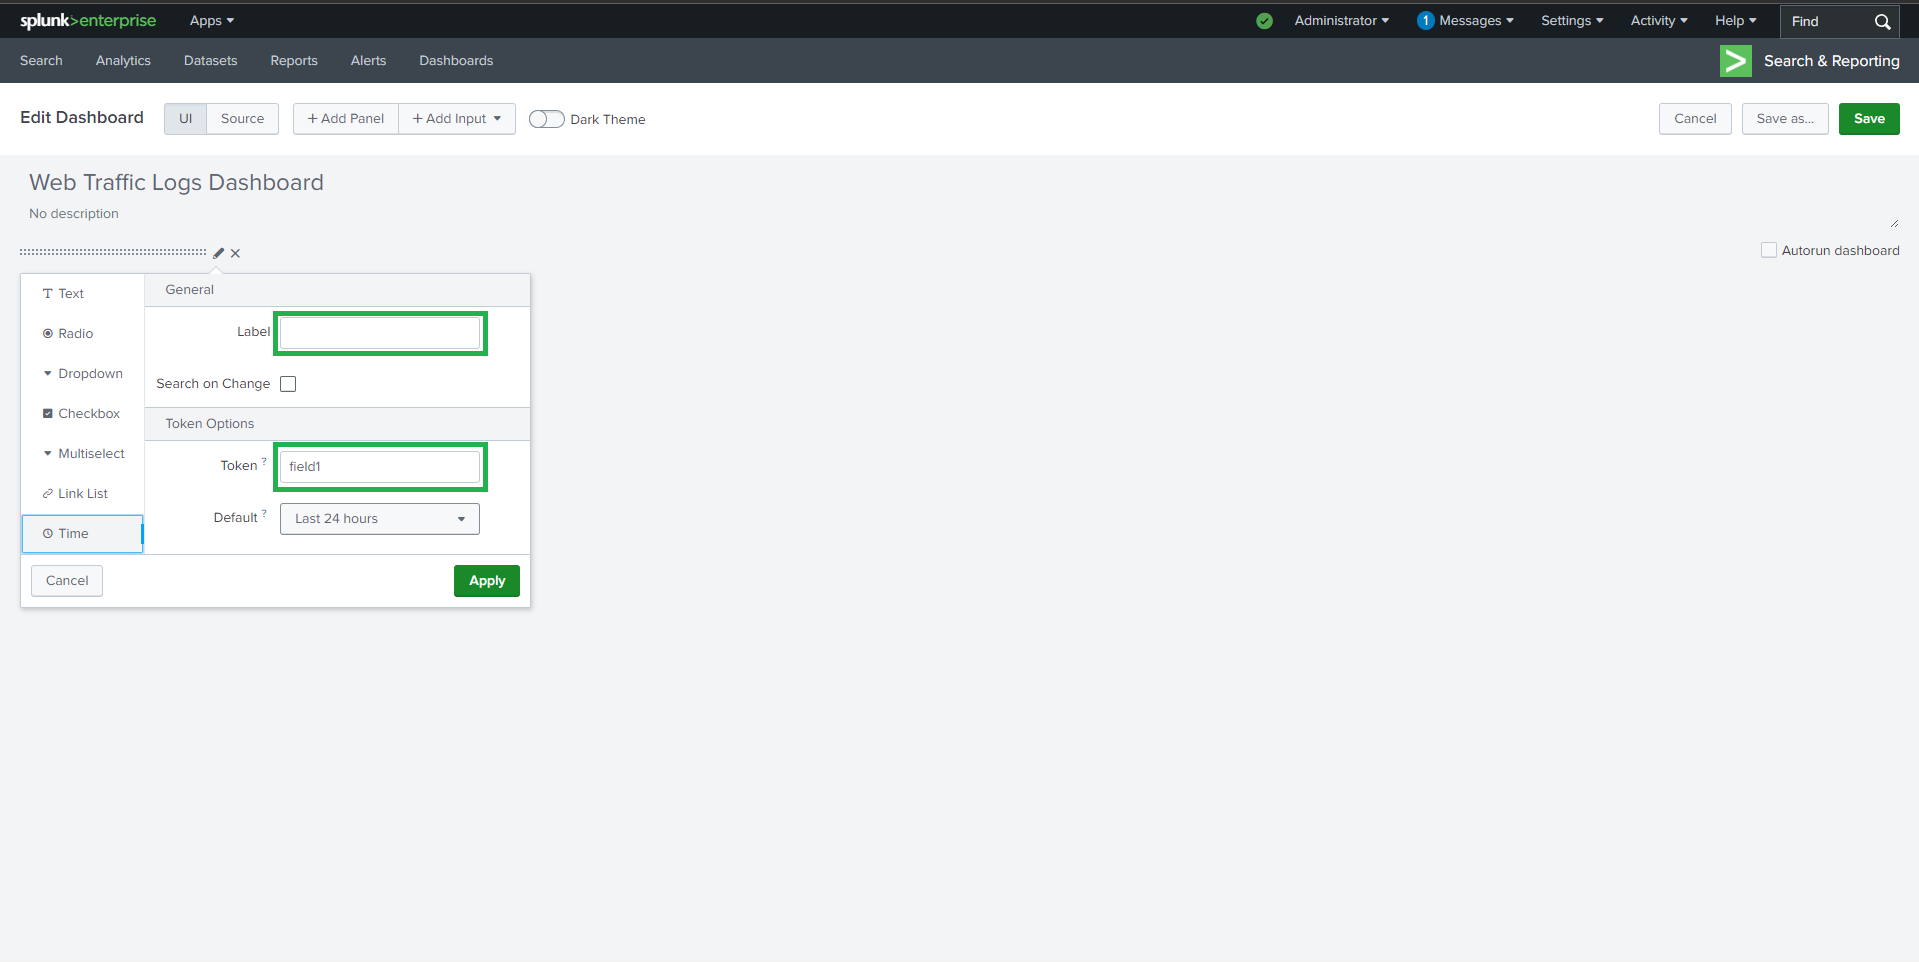
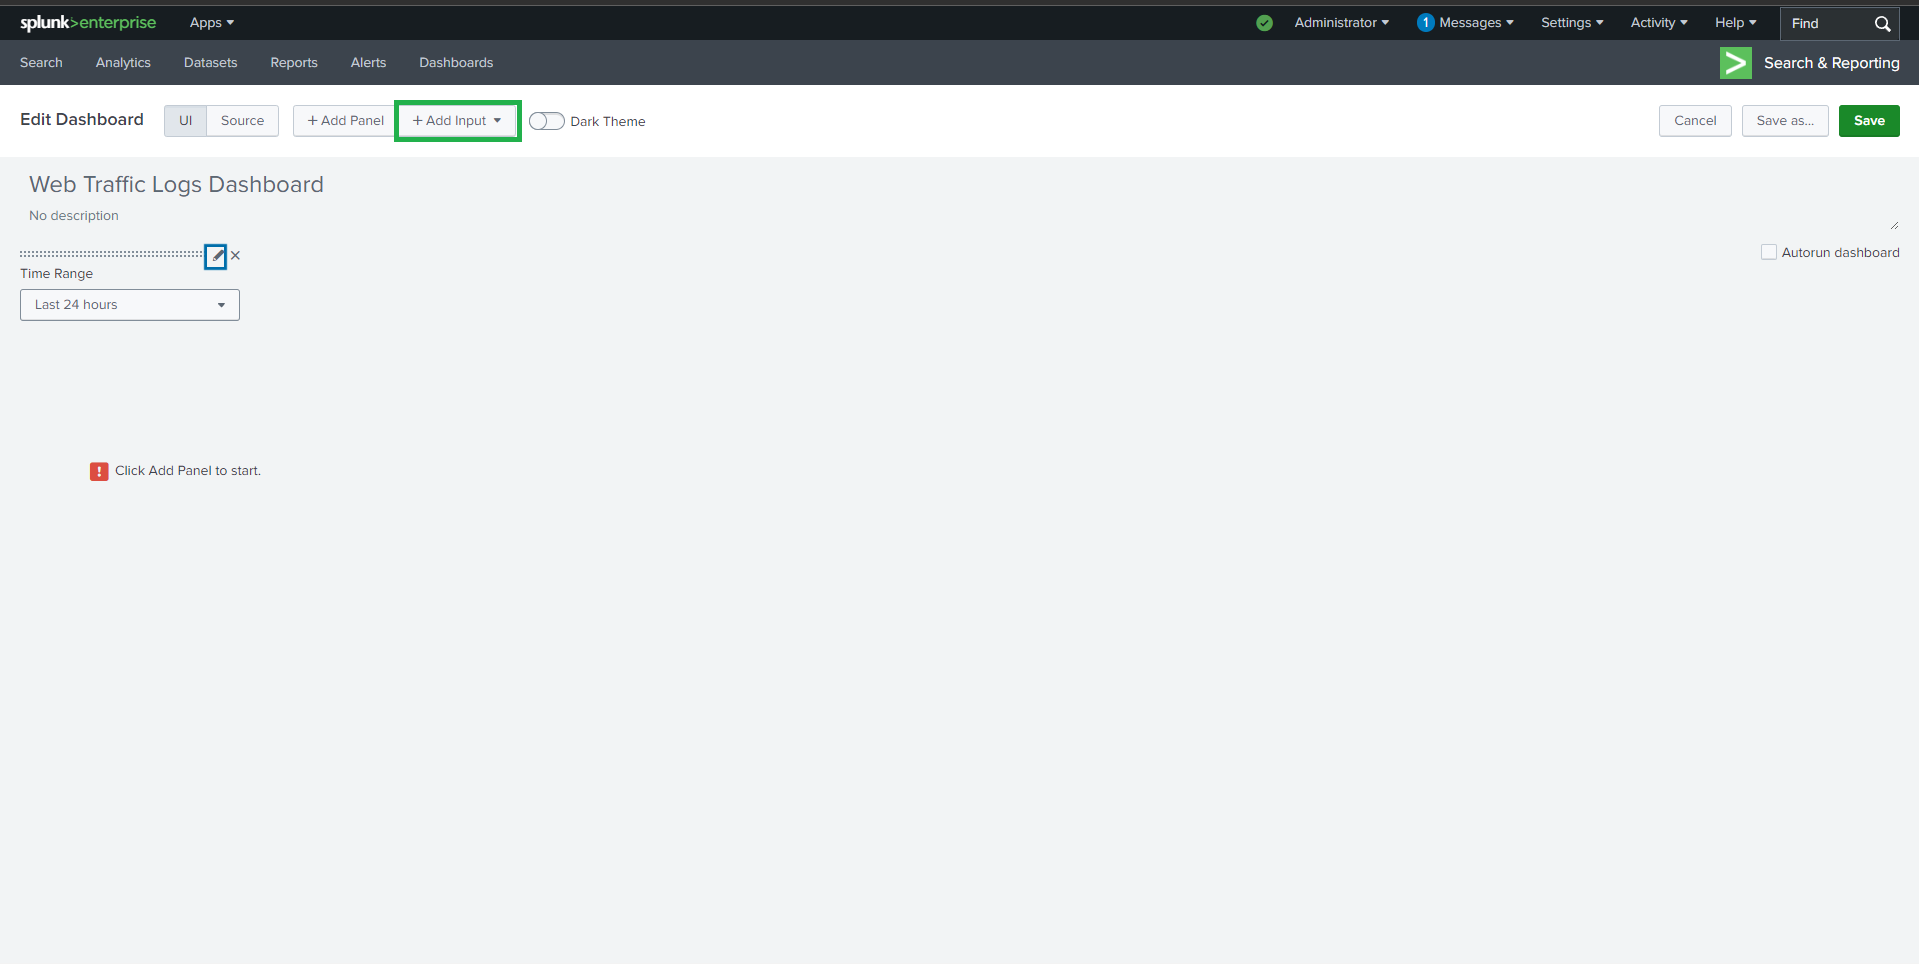
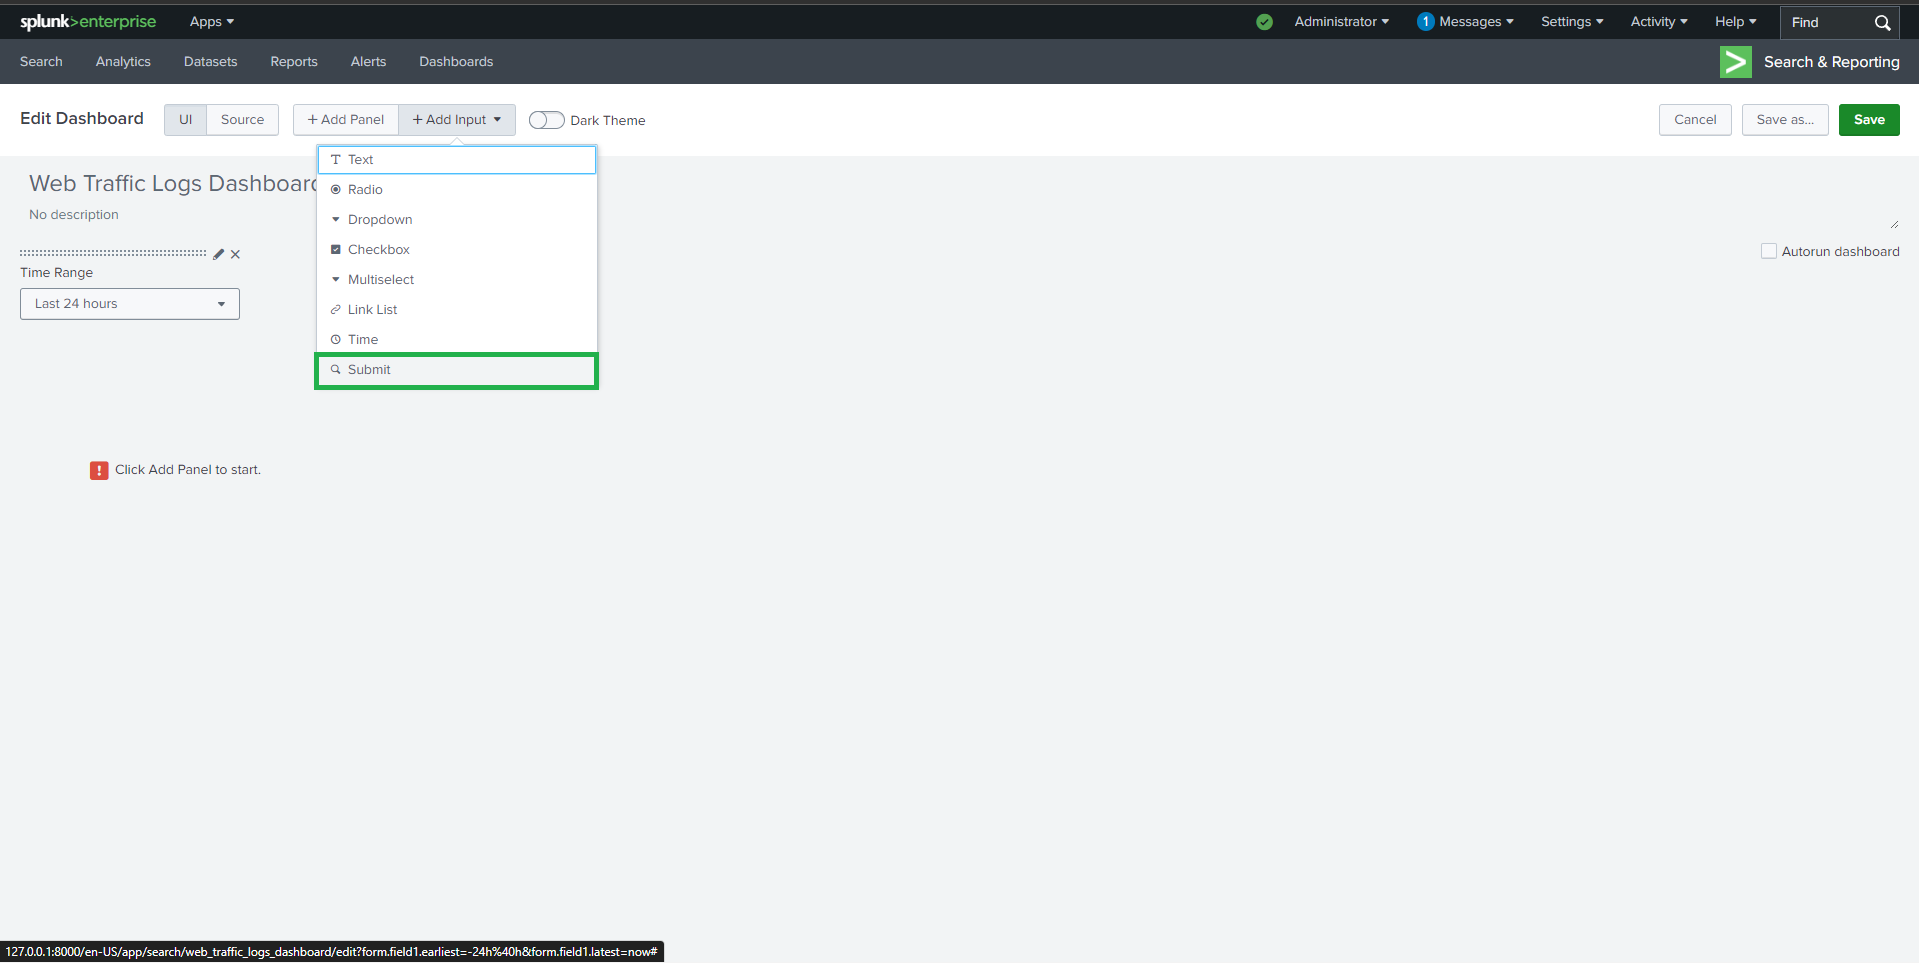
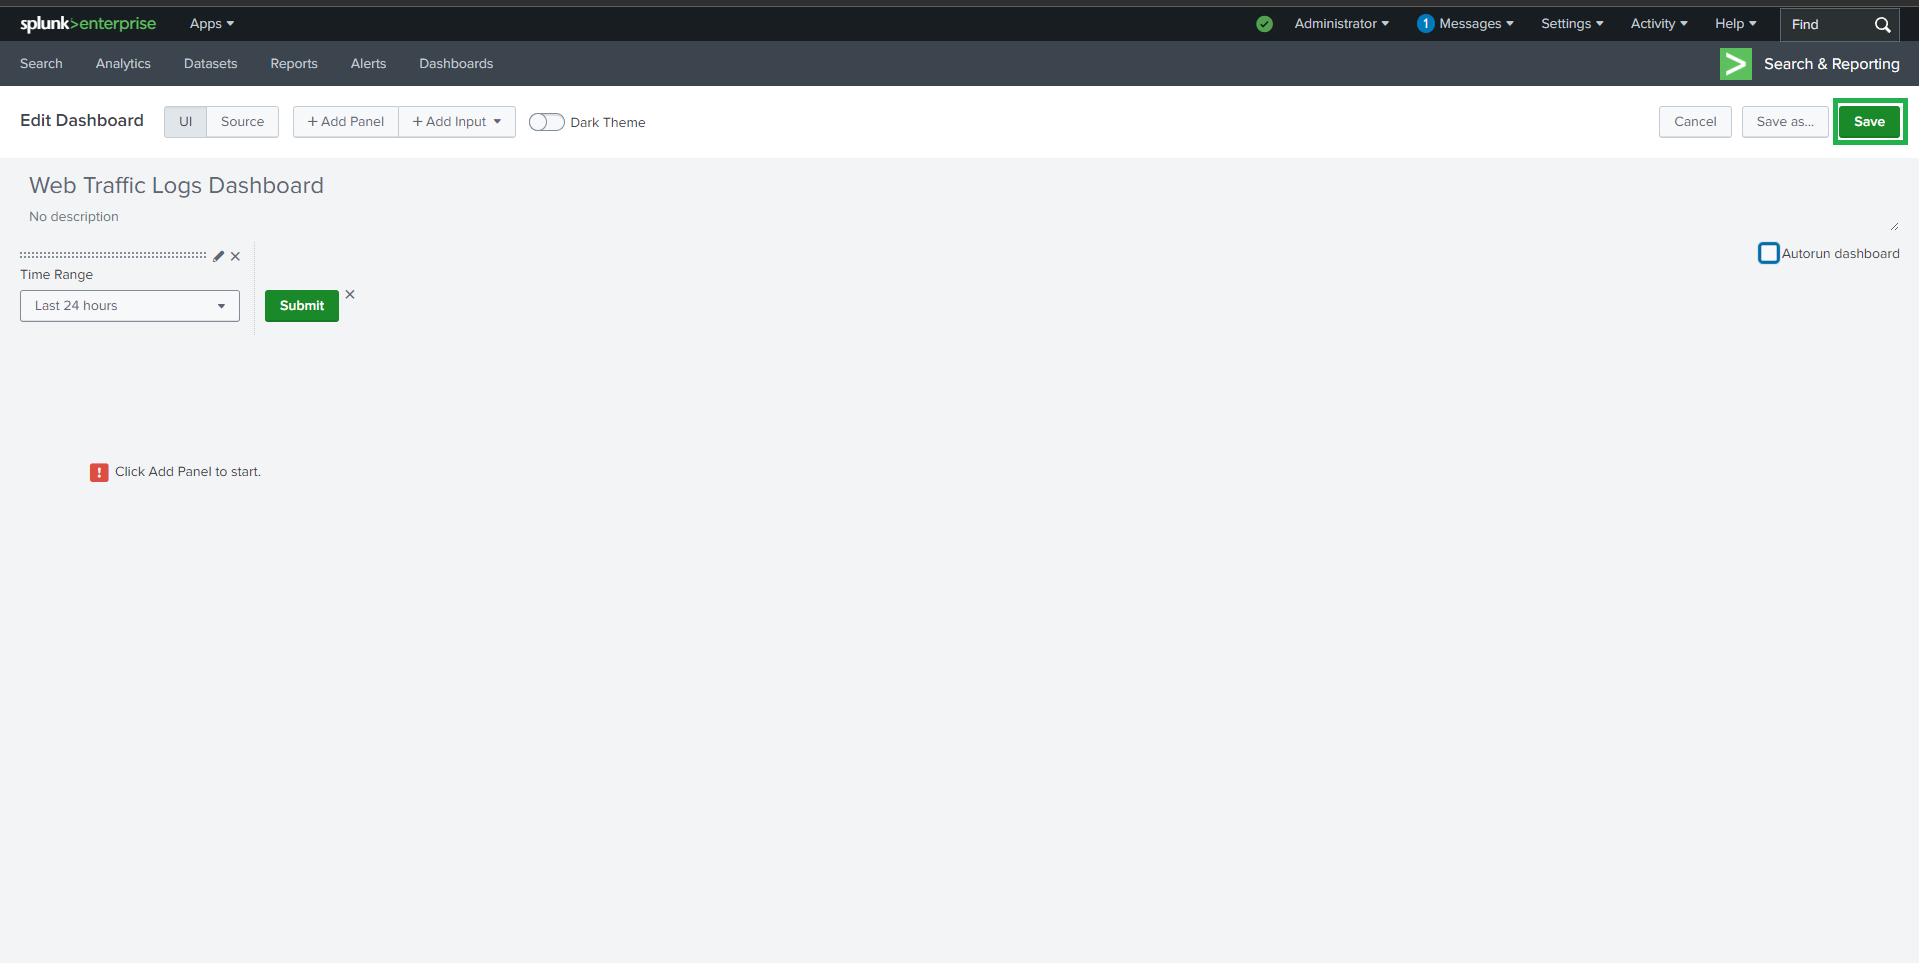
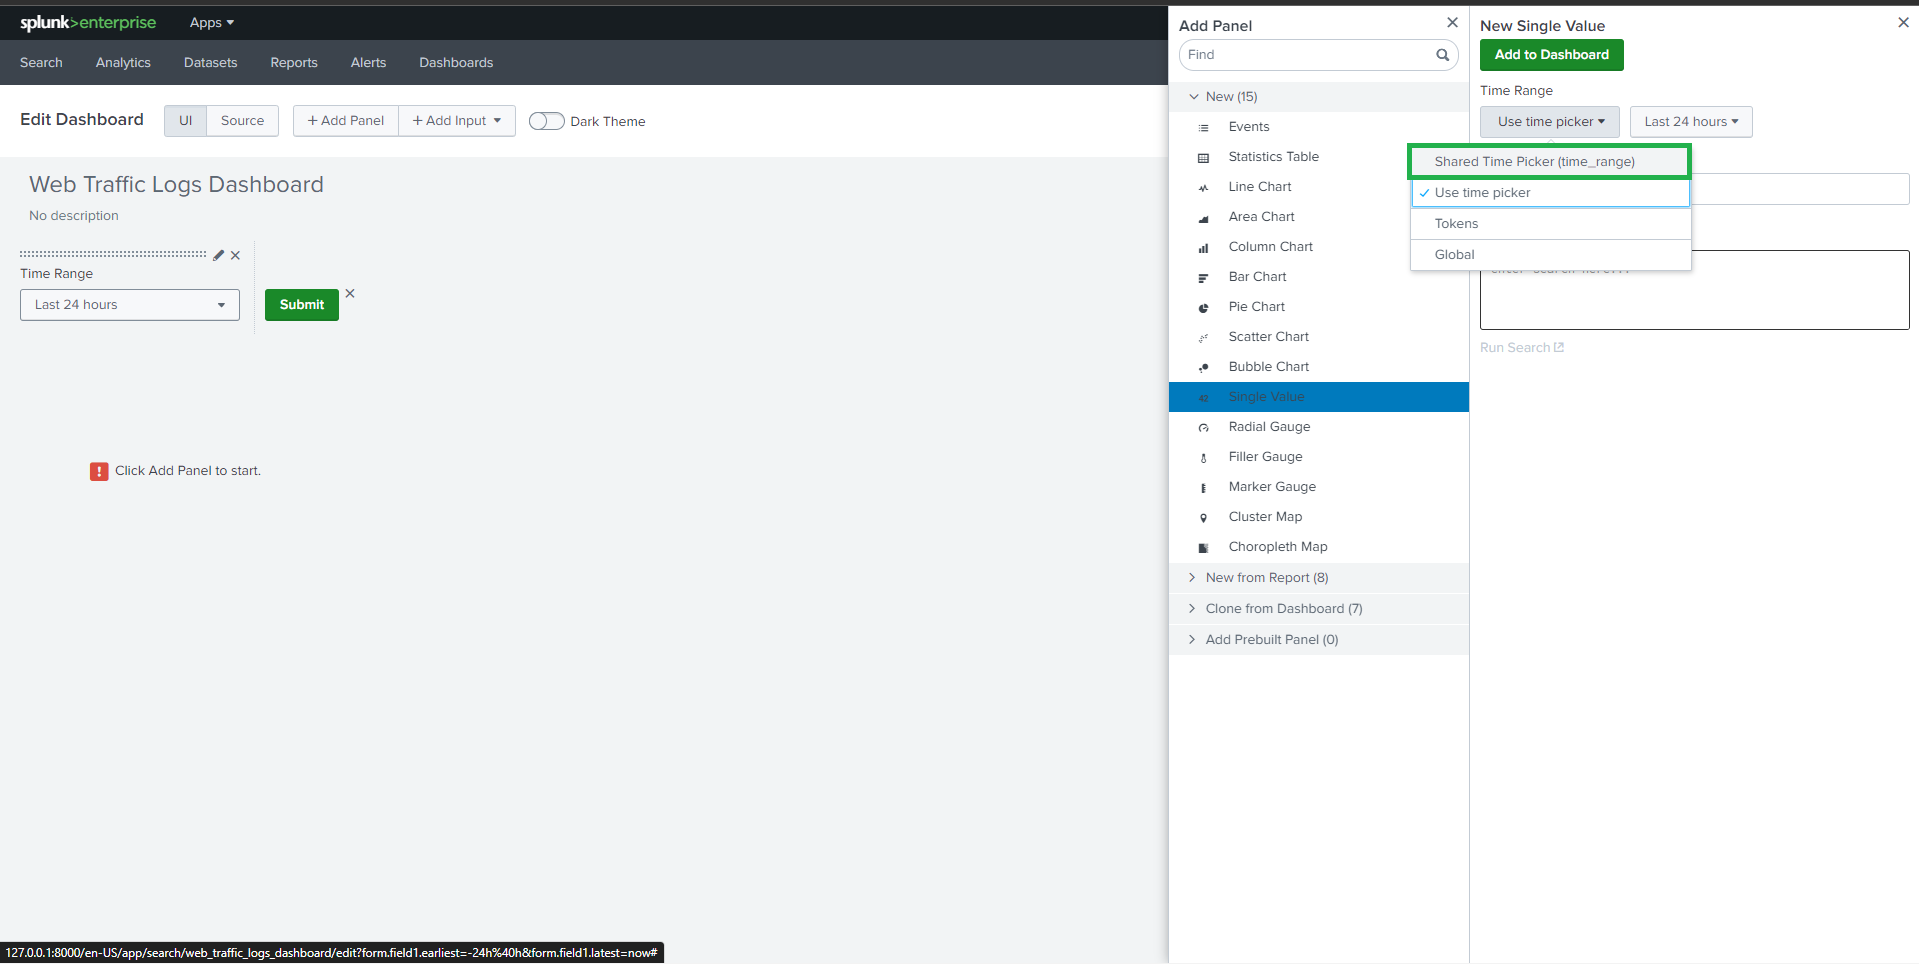
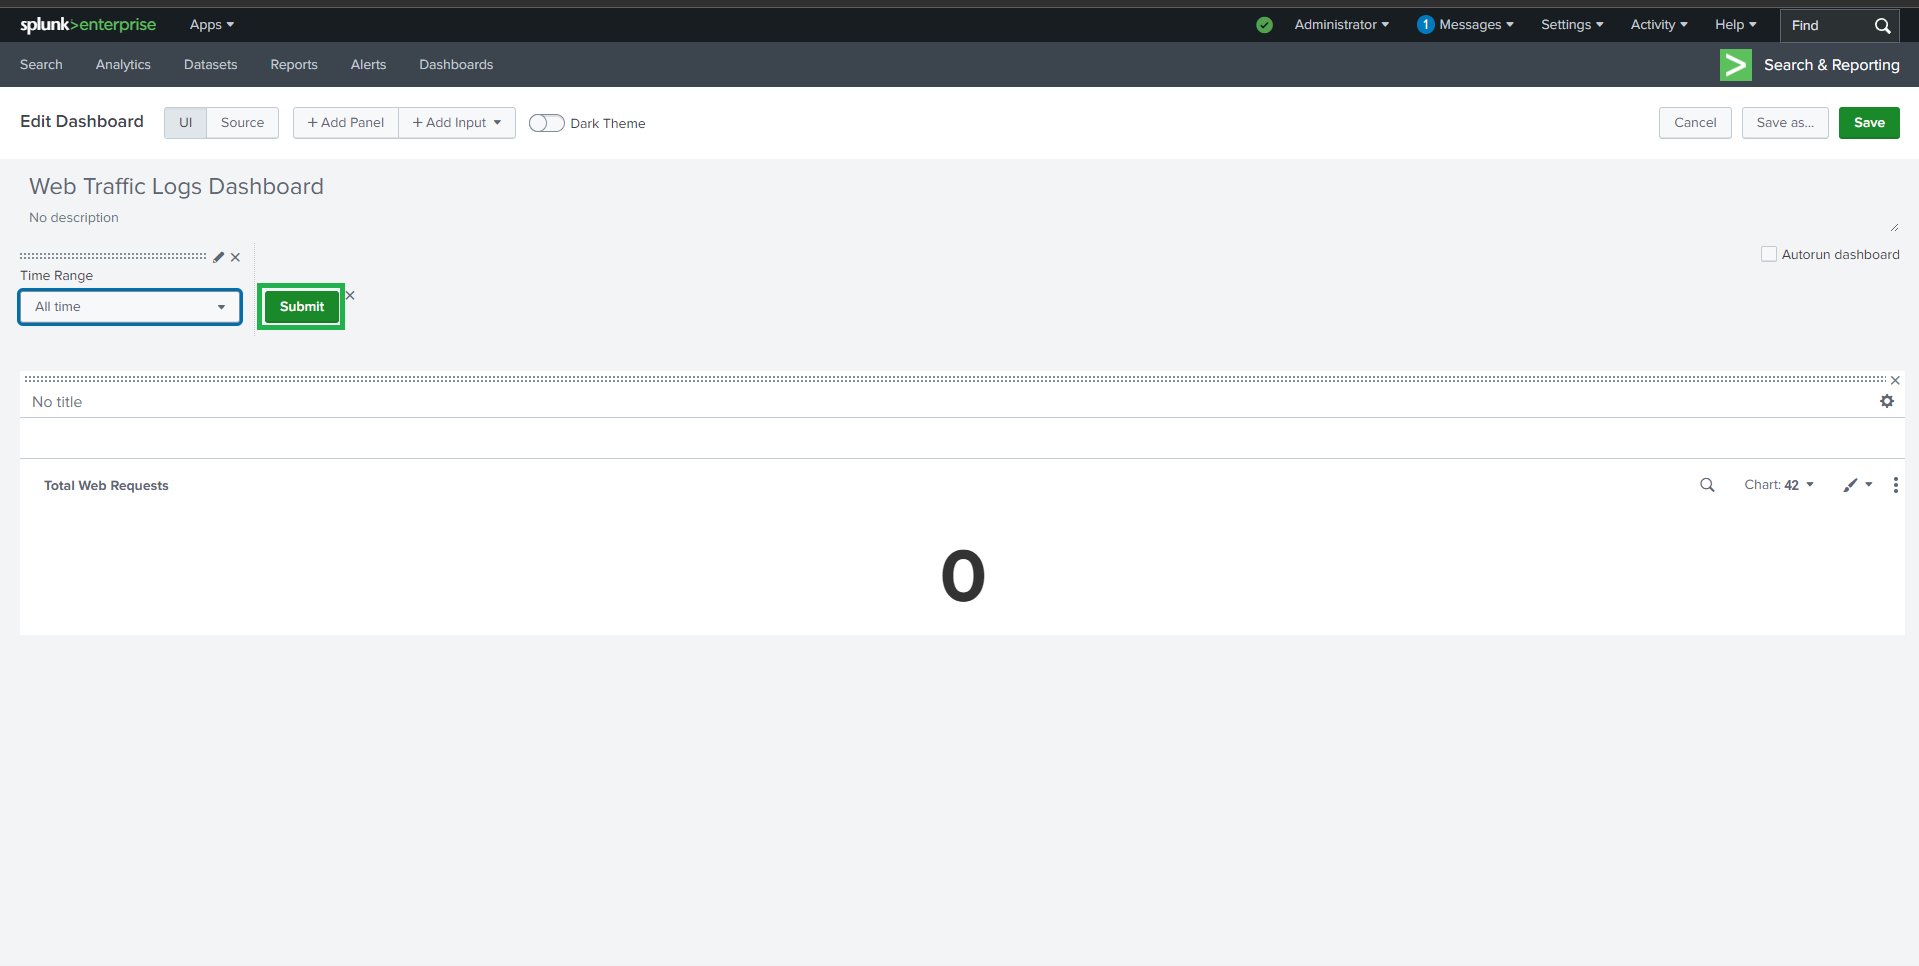
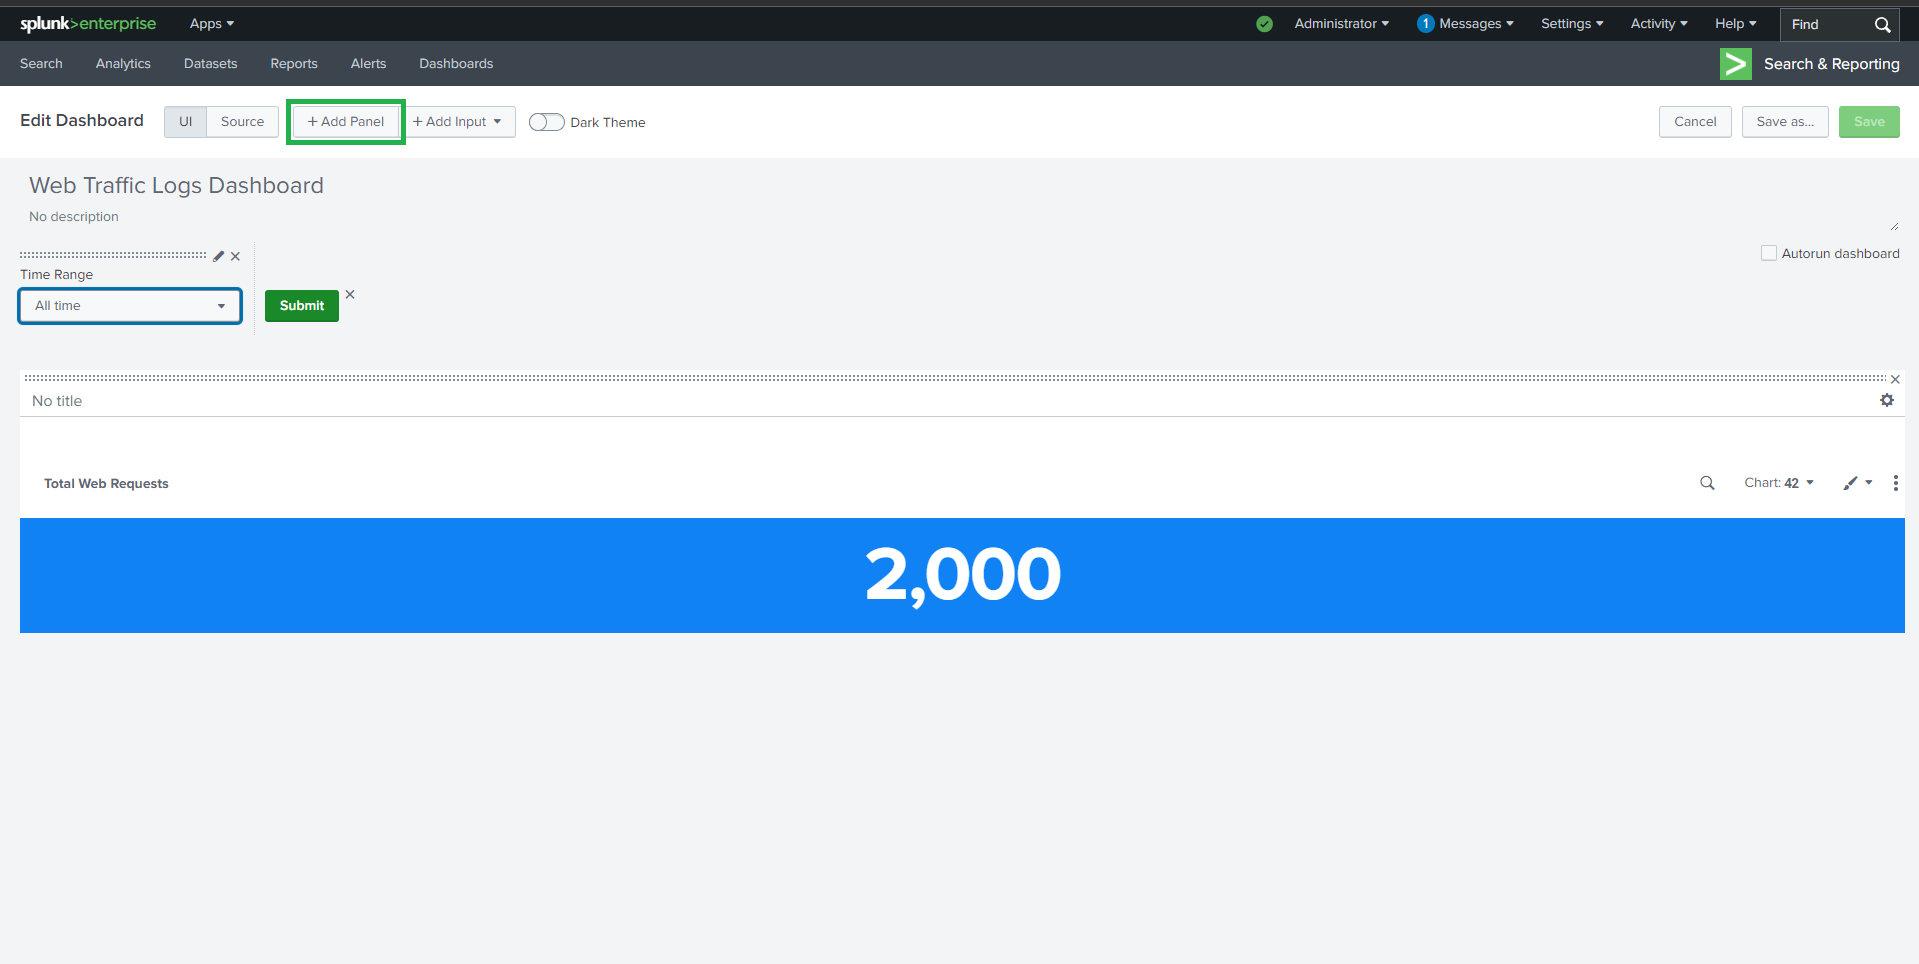
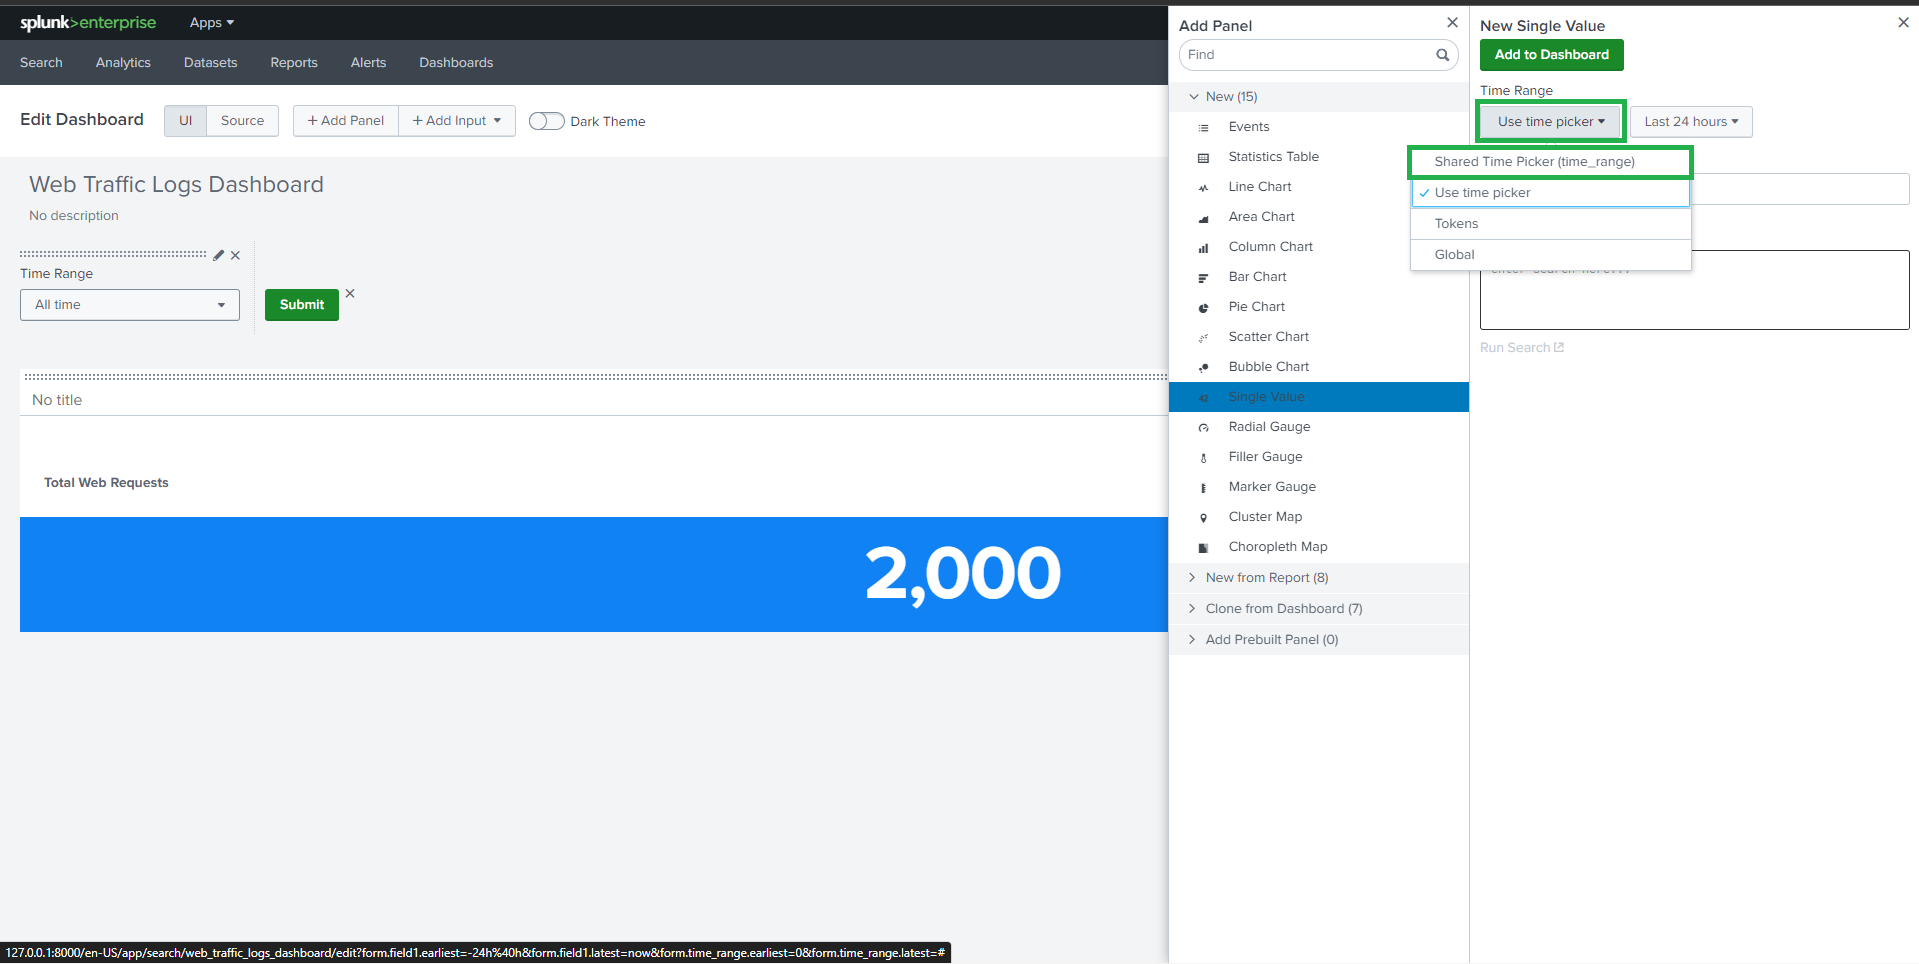
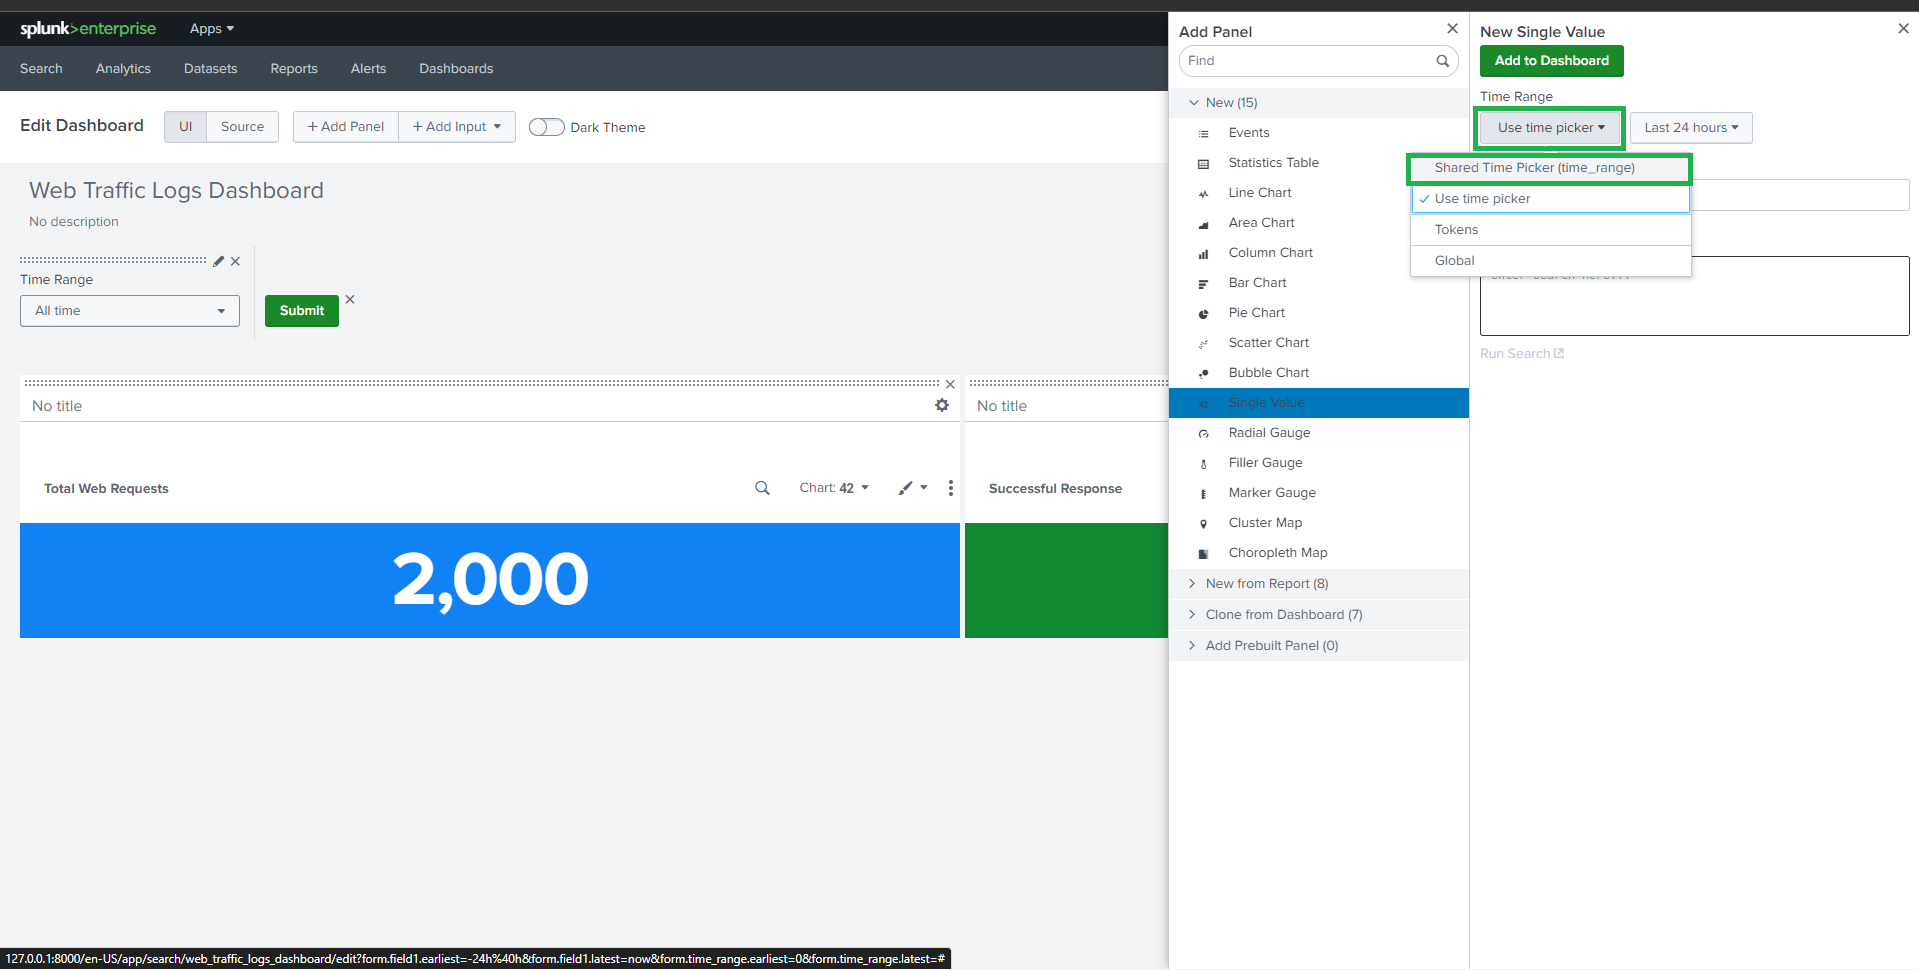
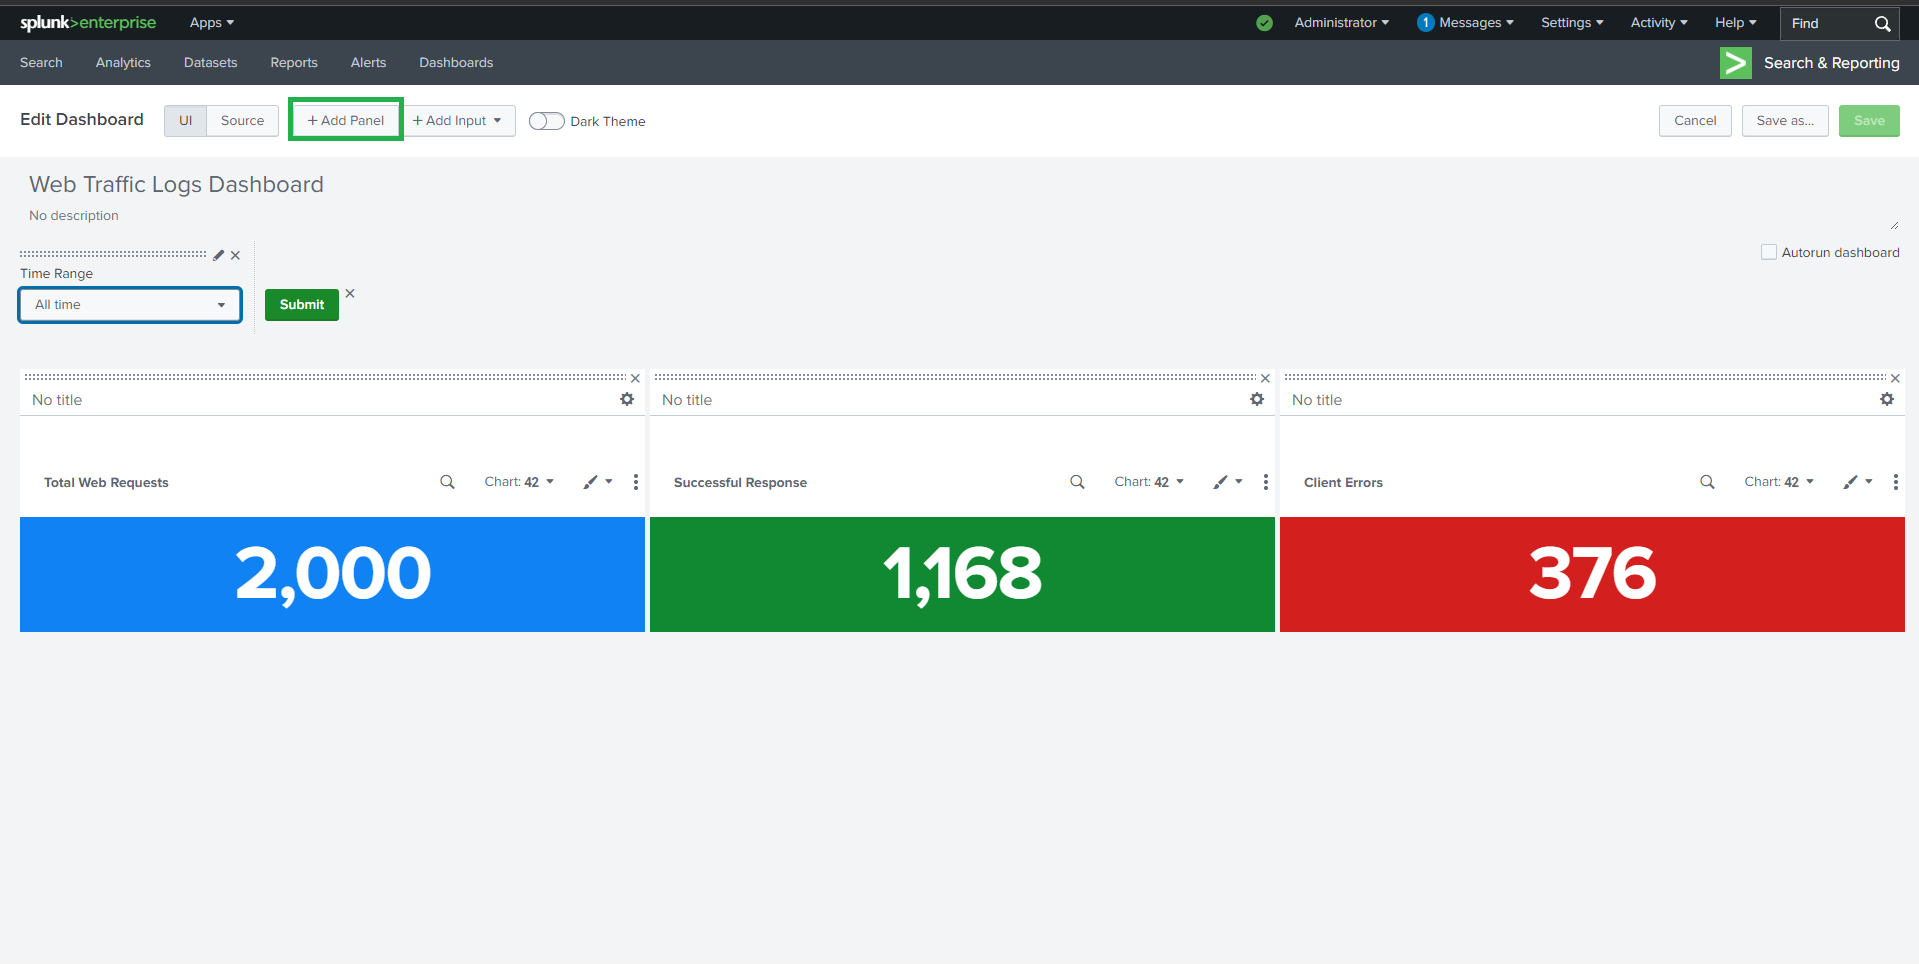
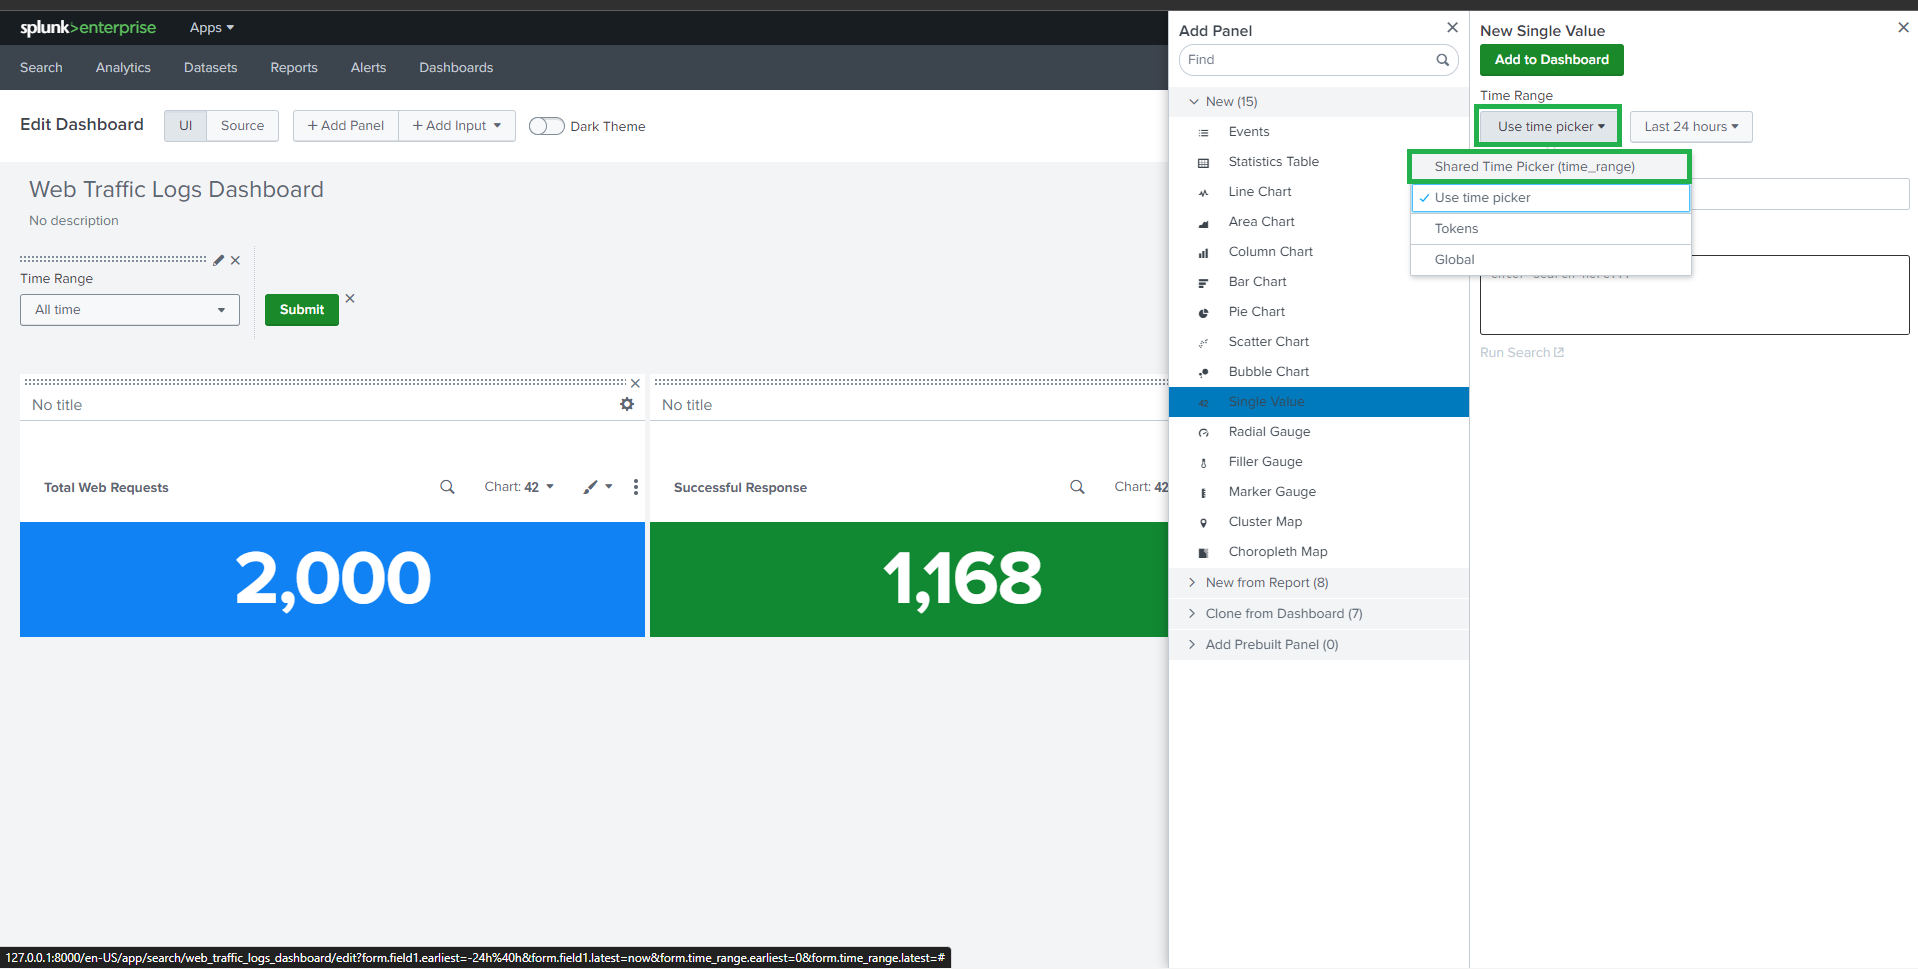
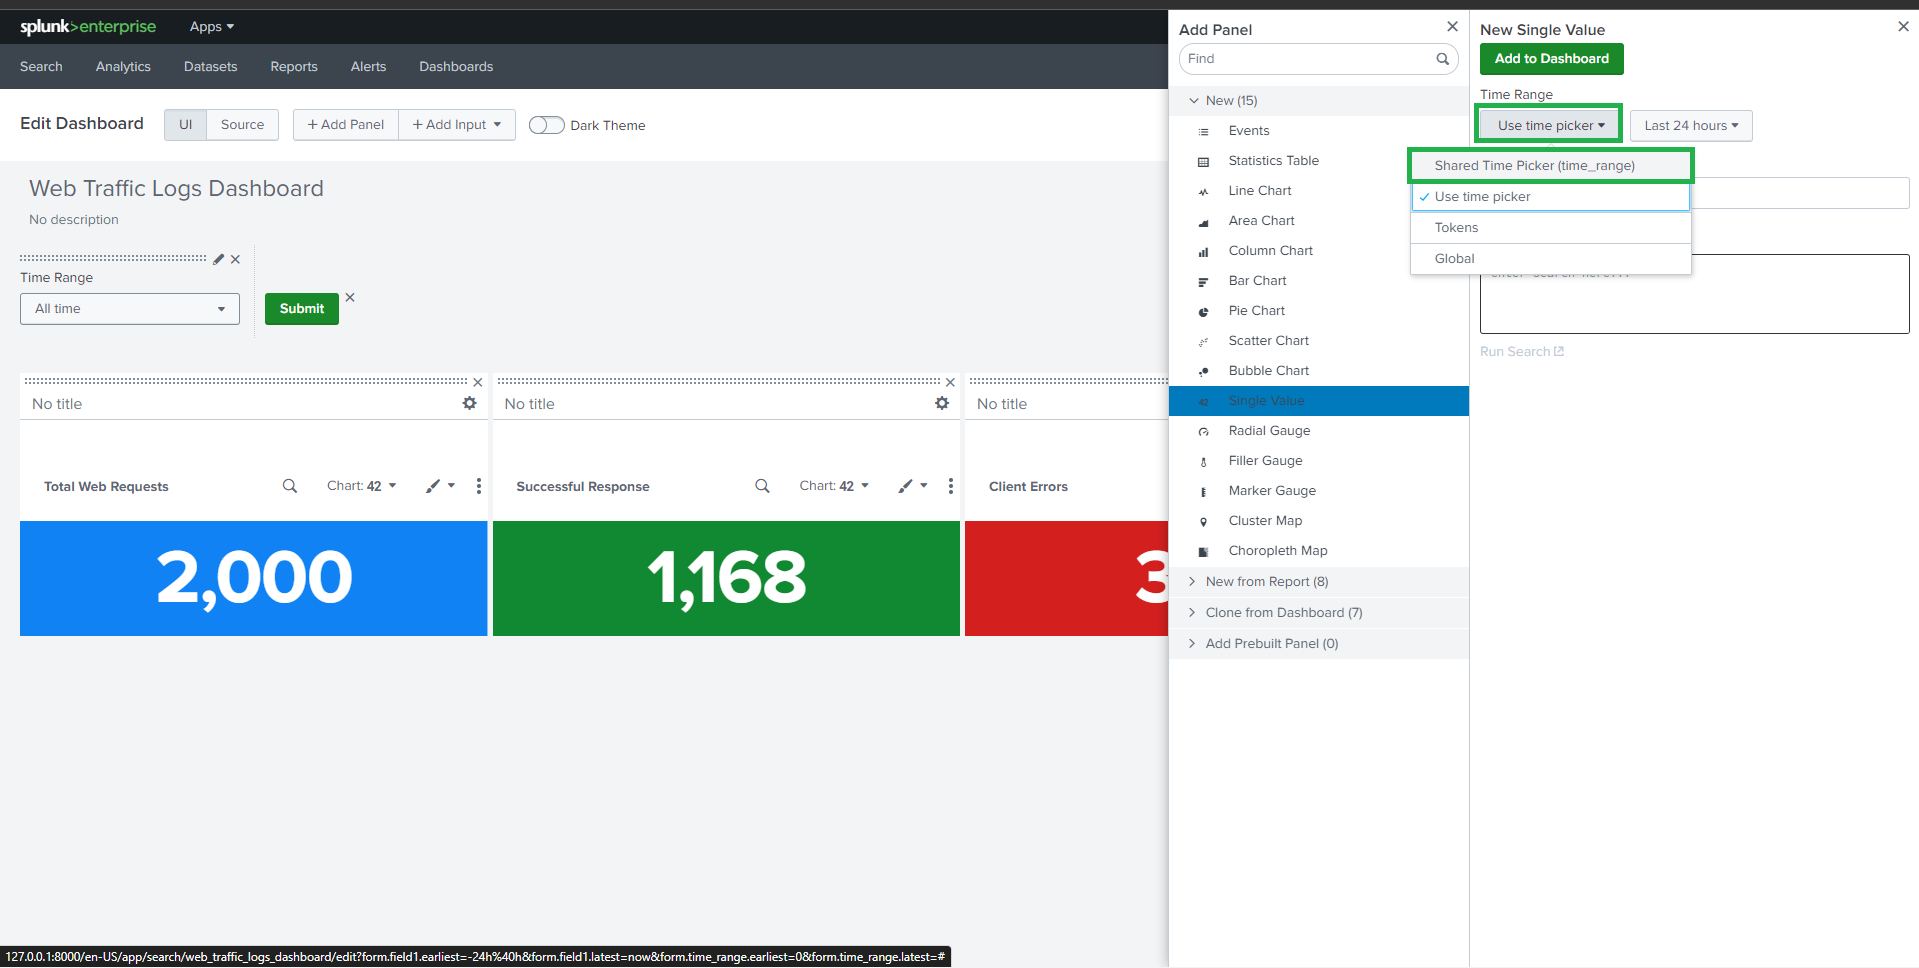
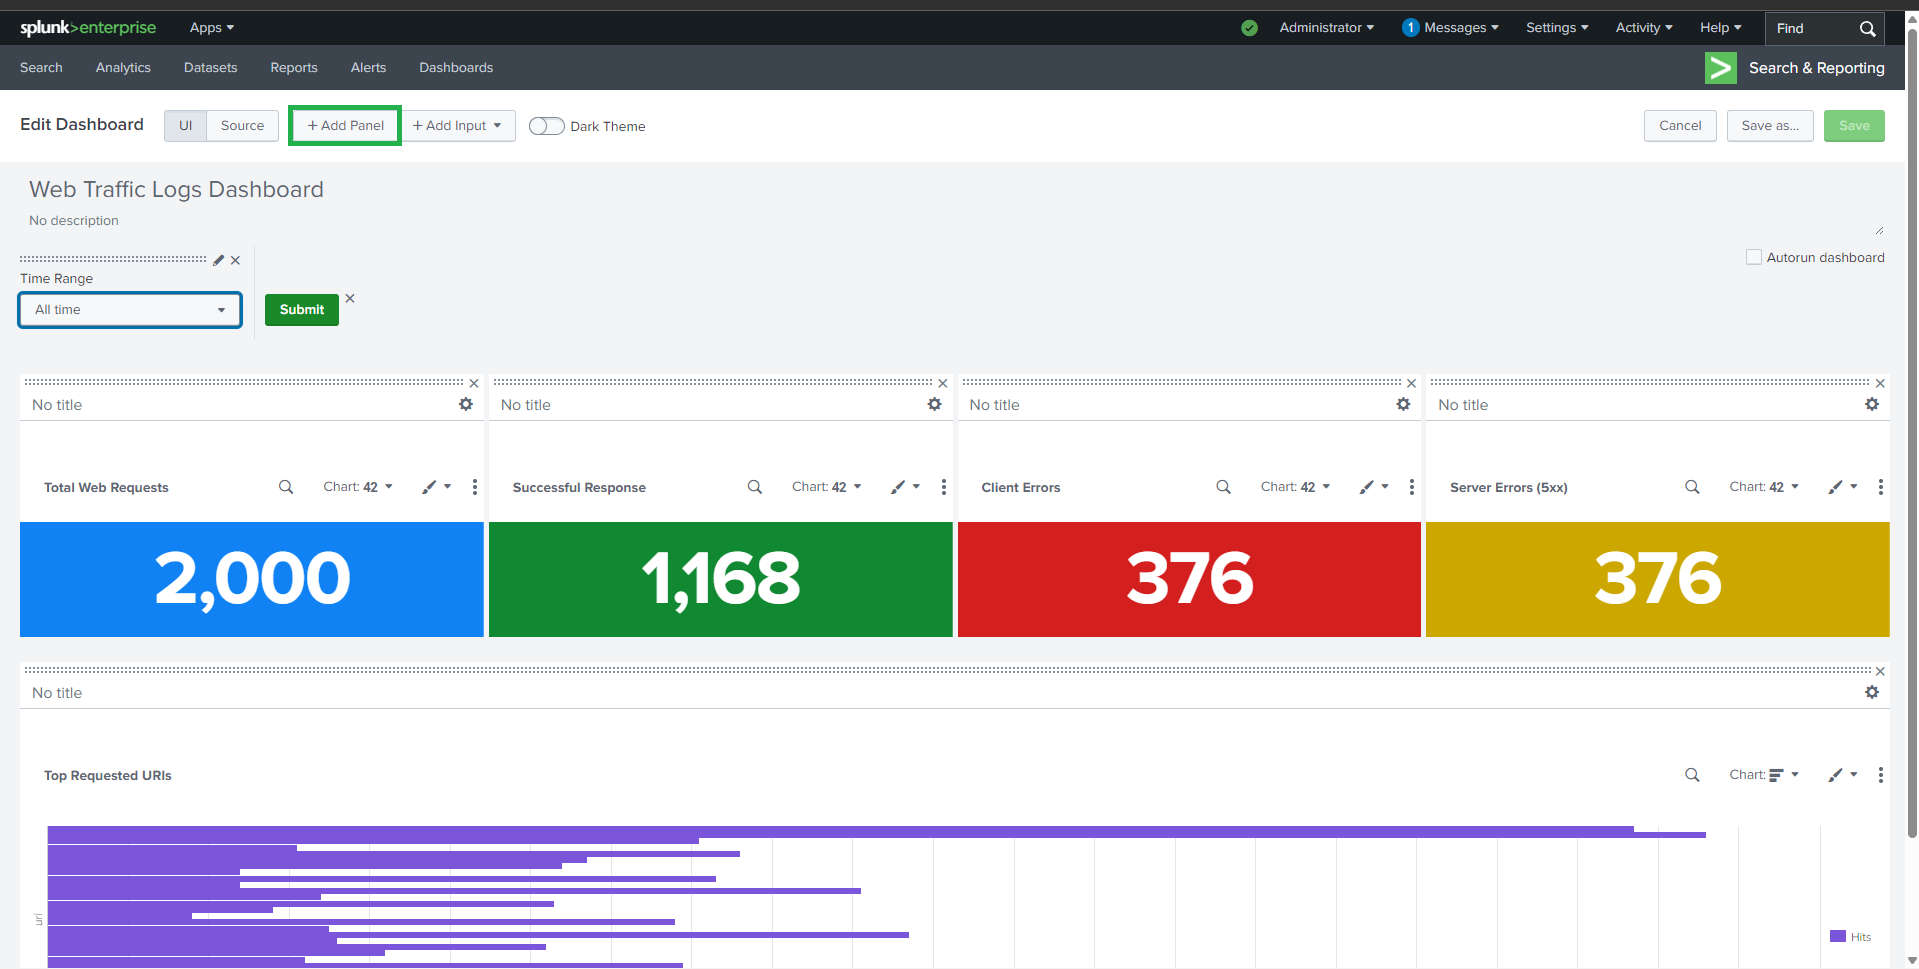
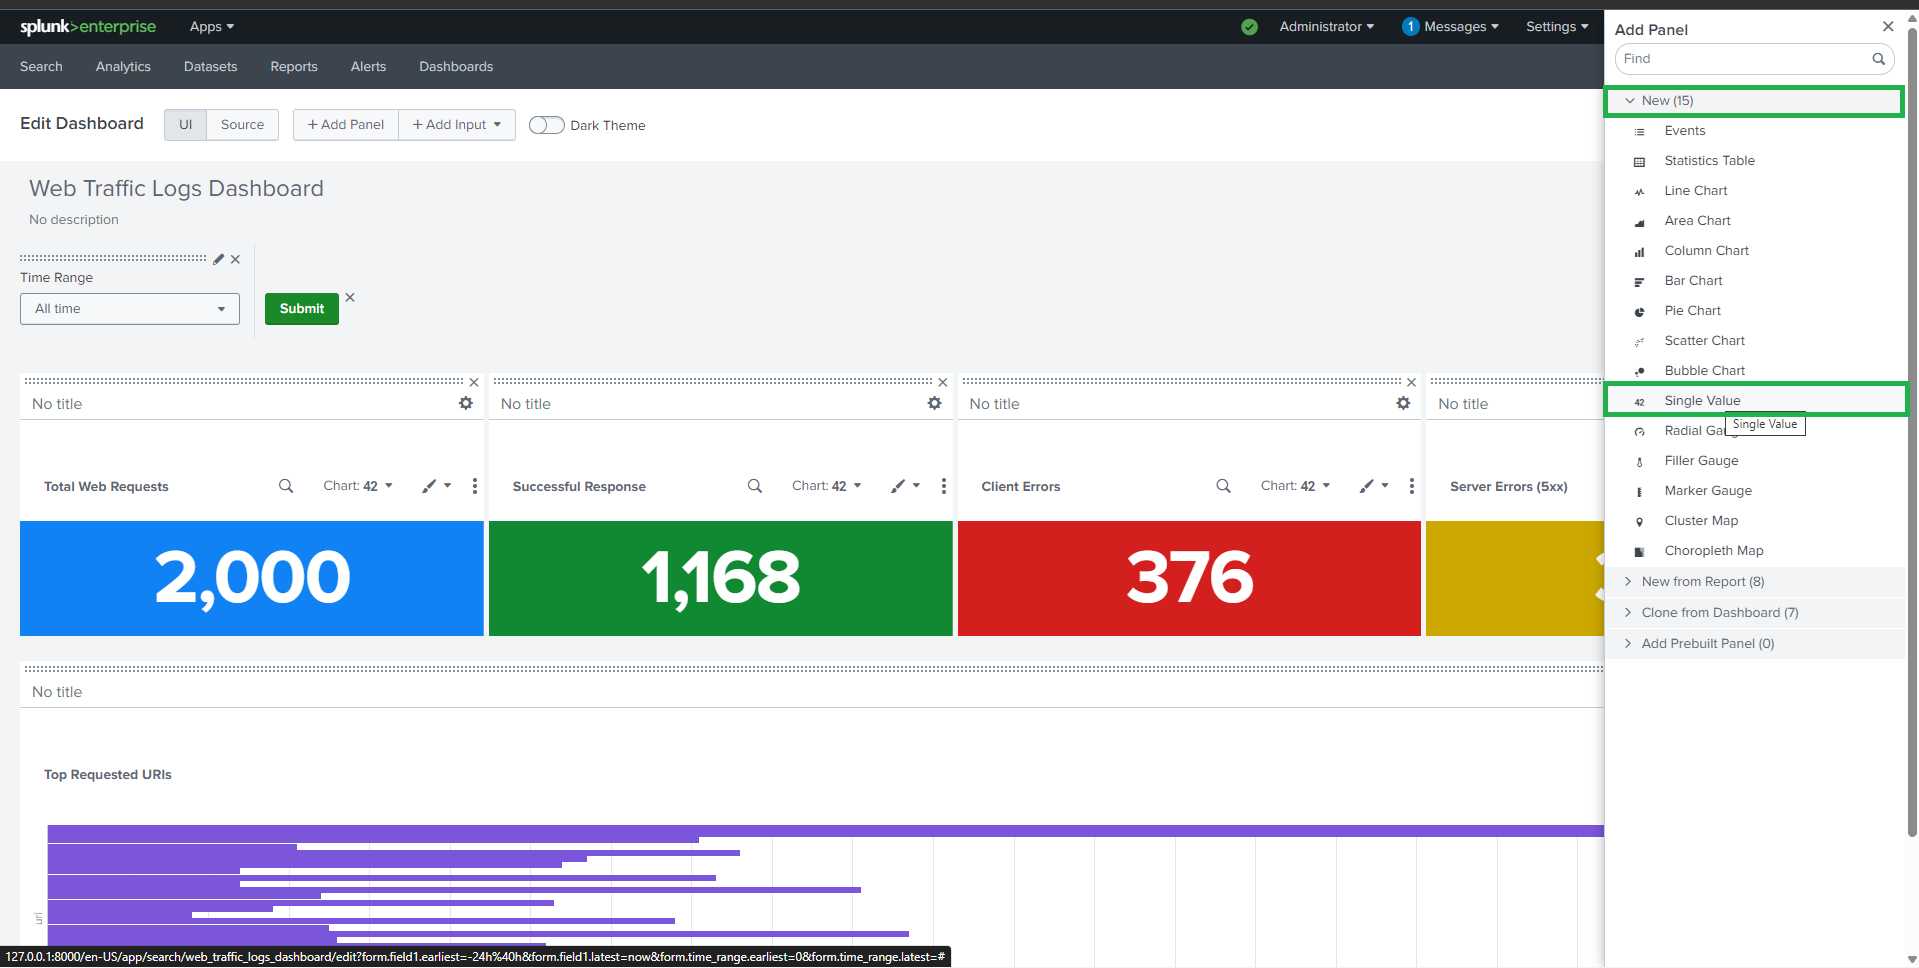
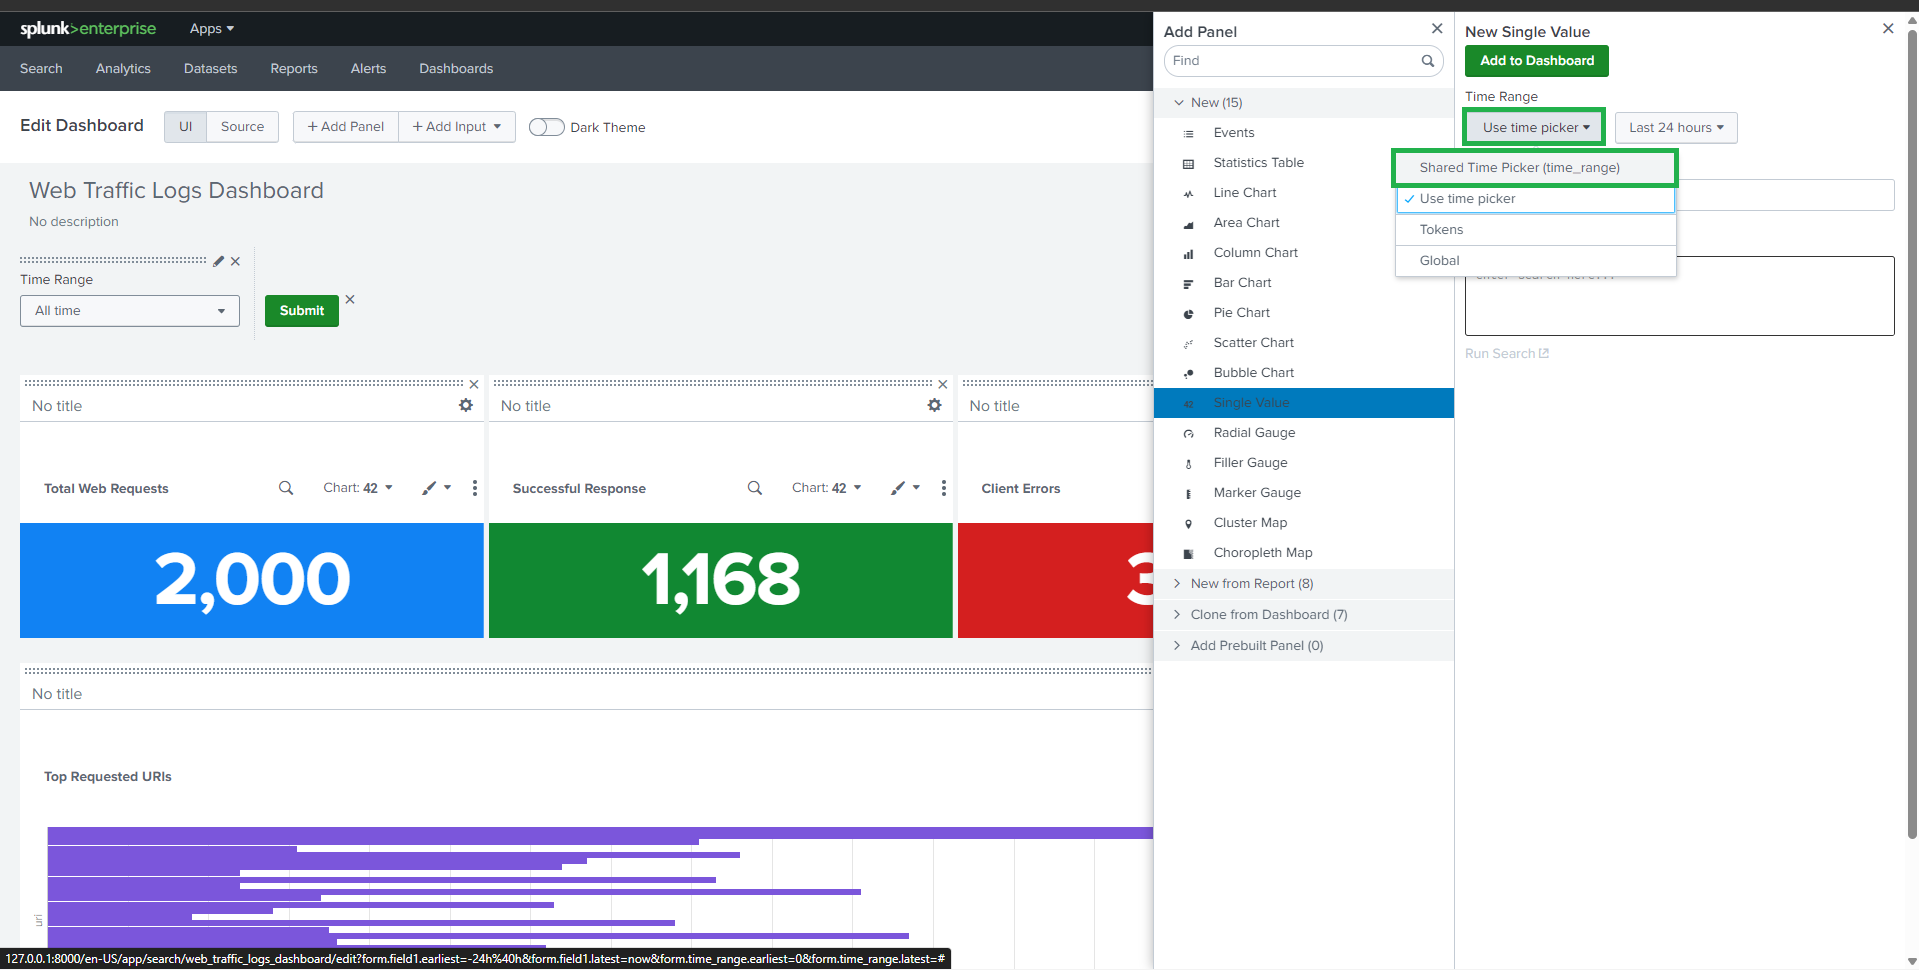
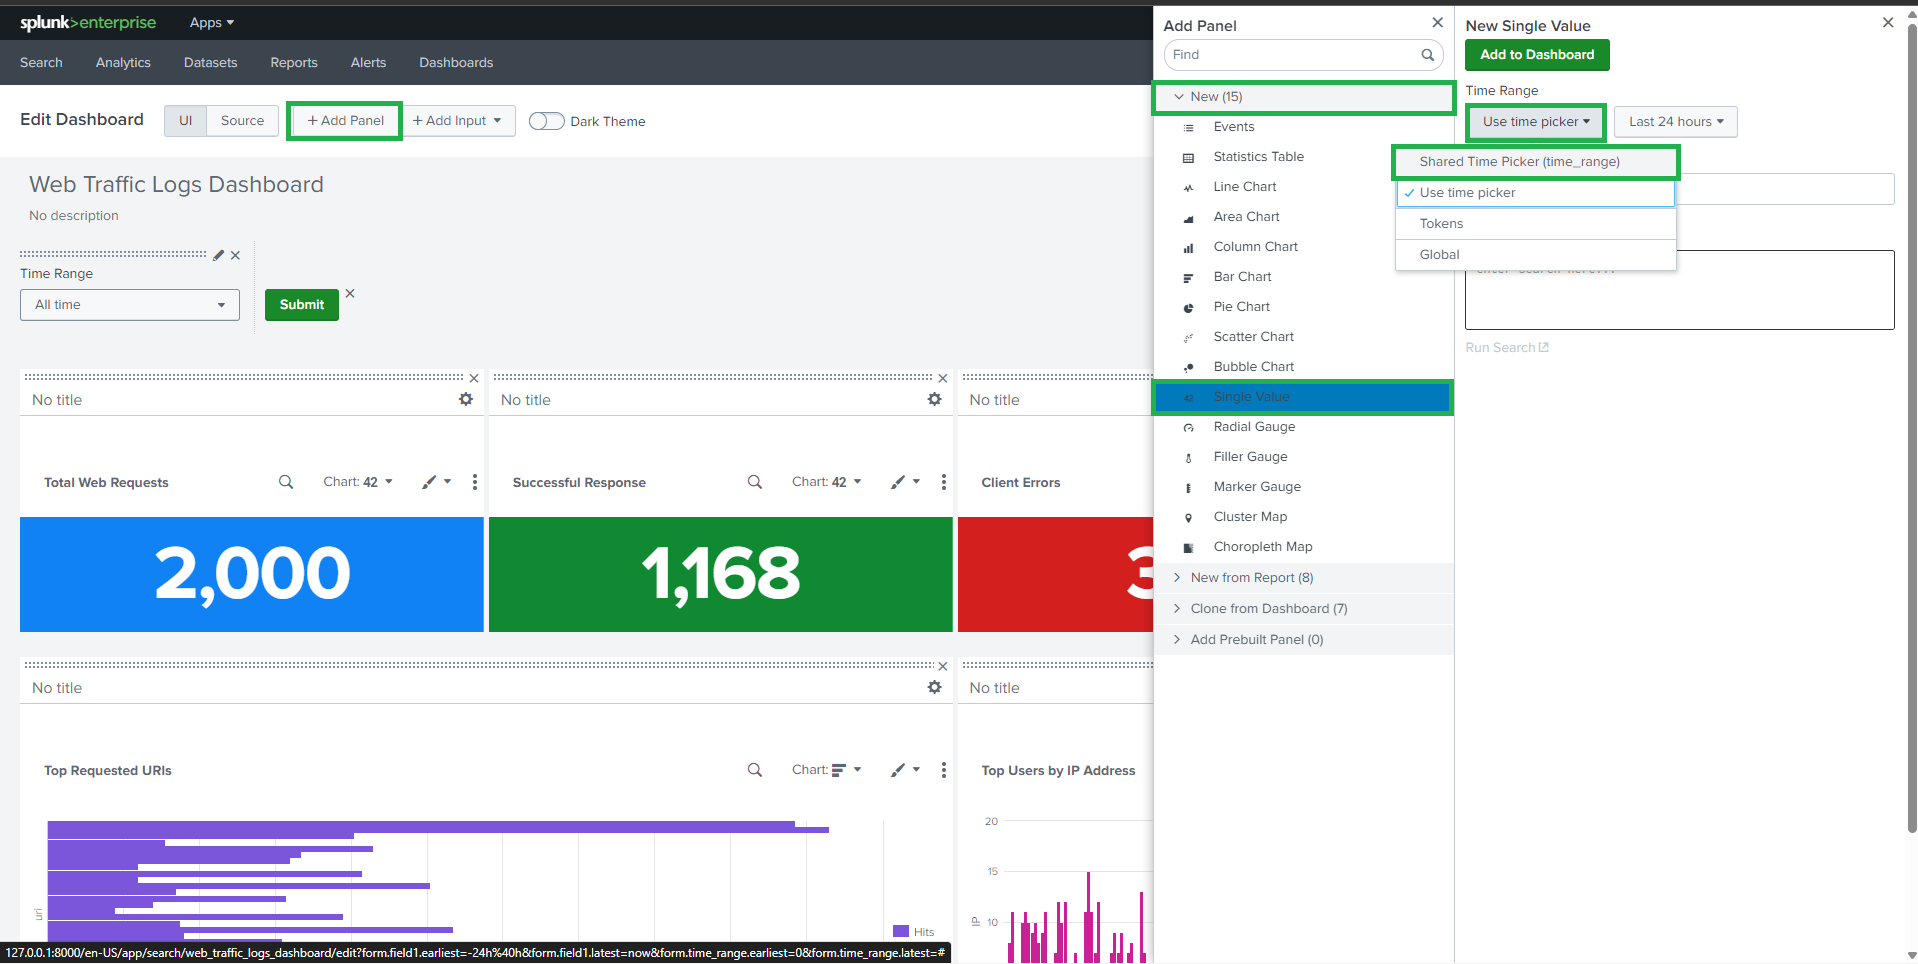
##  ## ⏱️ 任务 0:时间范围输入
A shared time picker is used to ensure consistency across all panels.
* **Label**: Time Range
* **Token**: `time_range`
> All panels use the shared time picker token `time_range`.
## ⏱️ 任务 0:时间范围输入
A shared time picker is used to ensure consistency across all panels.
* **Label**: Time Range
* **Token**: `time_range`
> All panels use the shared time picker token `time_range`.
 ##
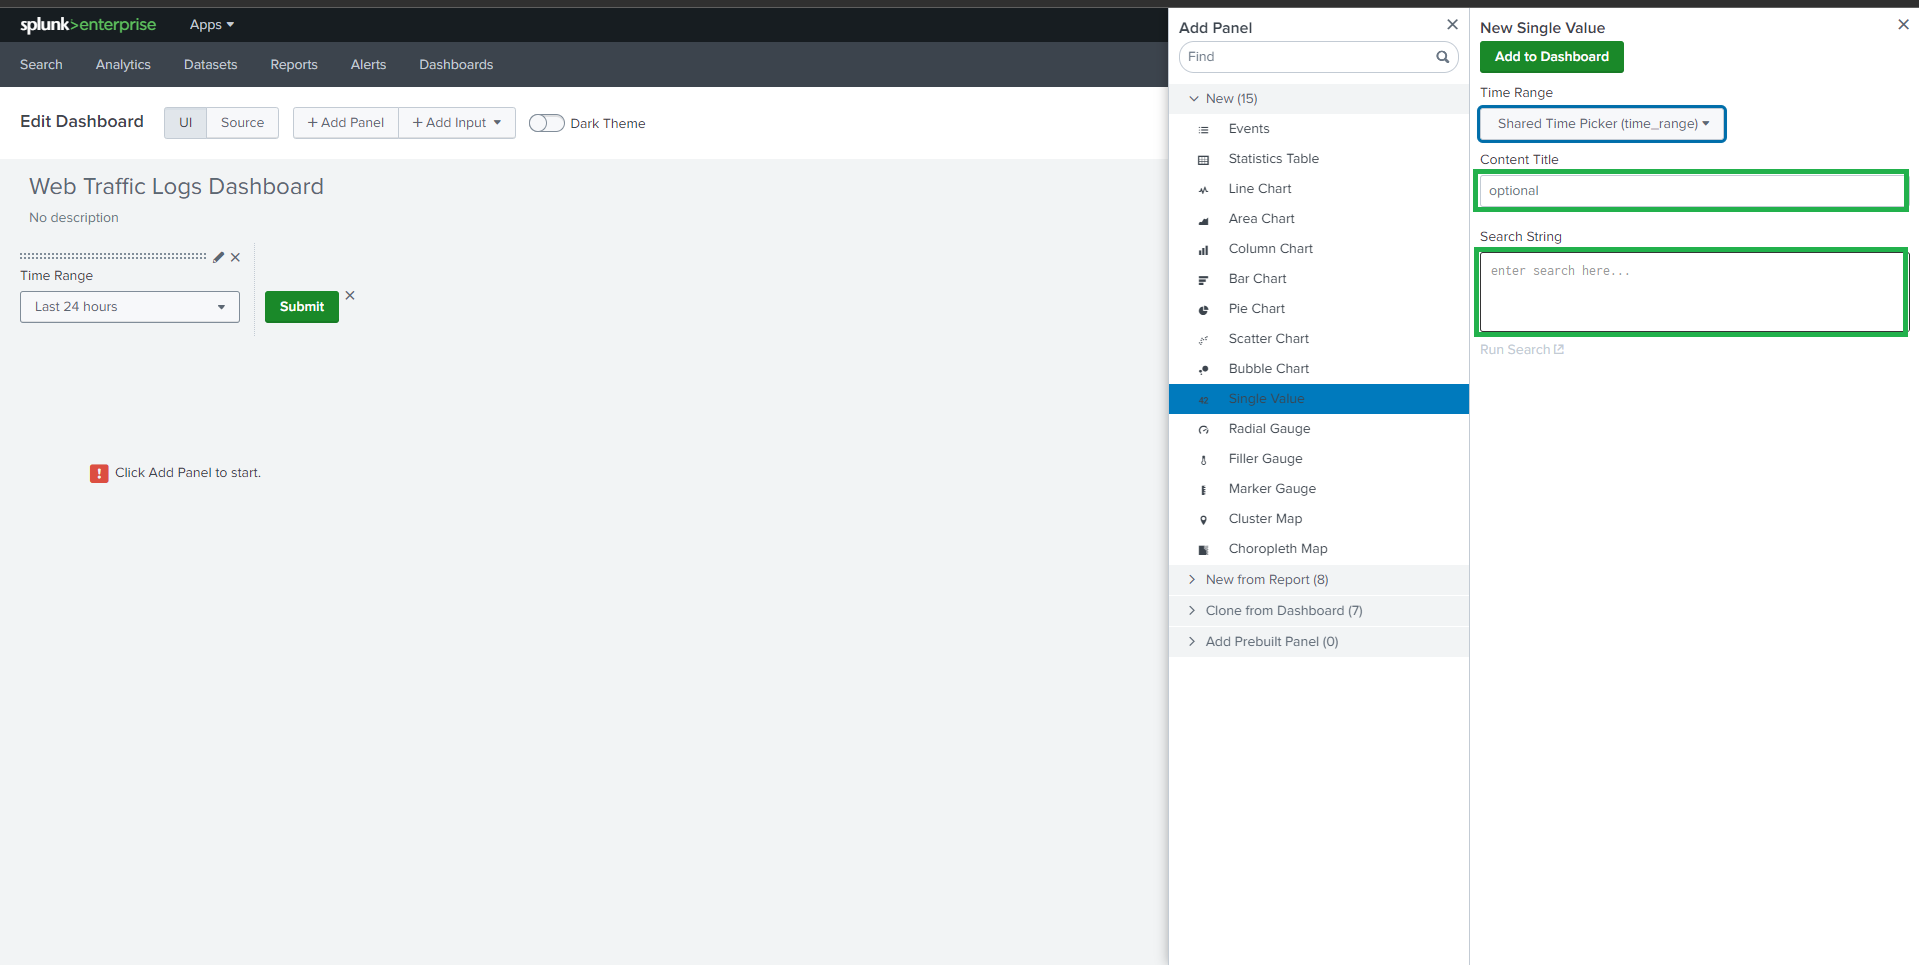
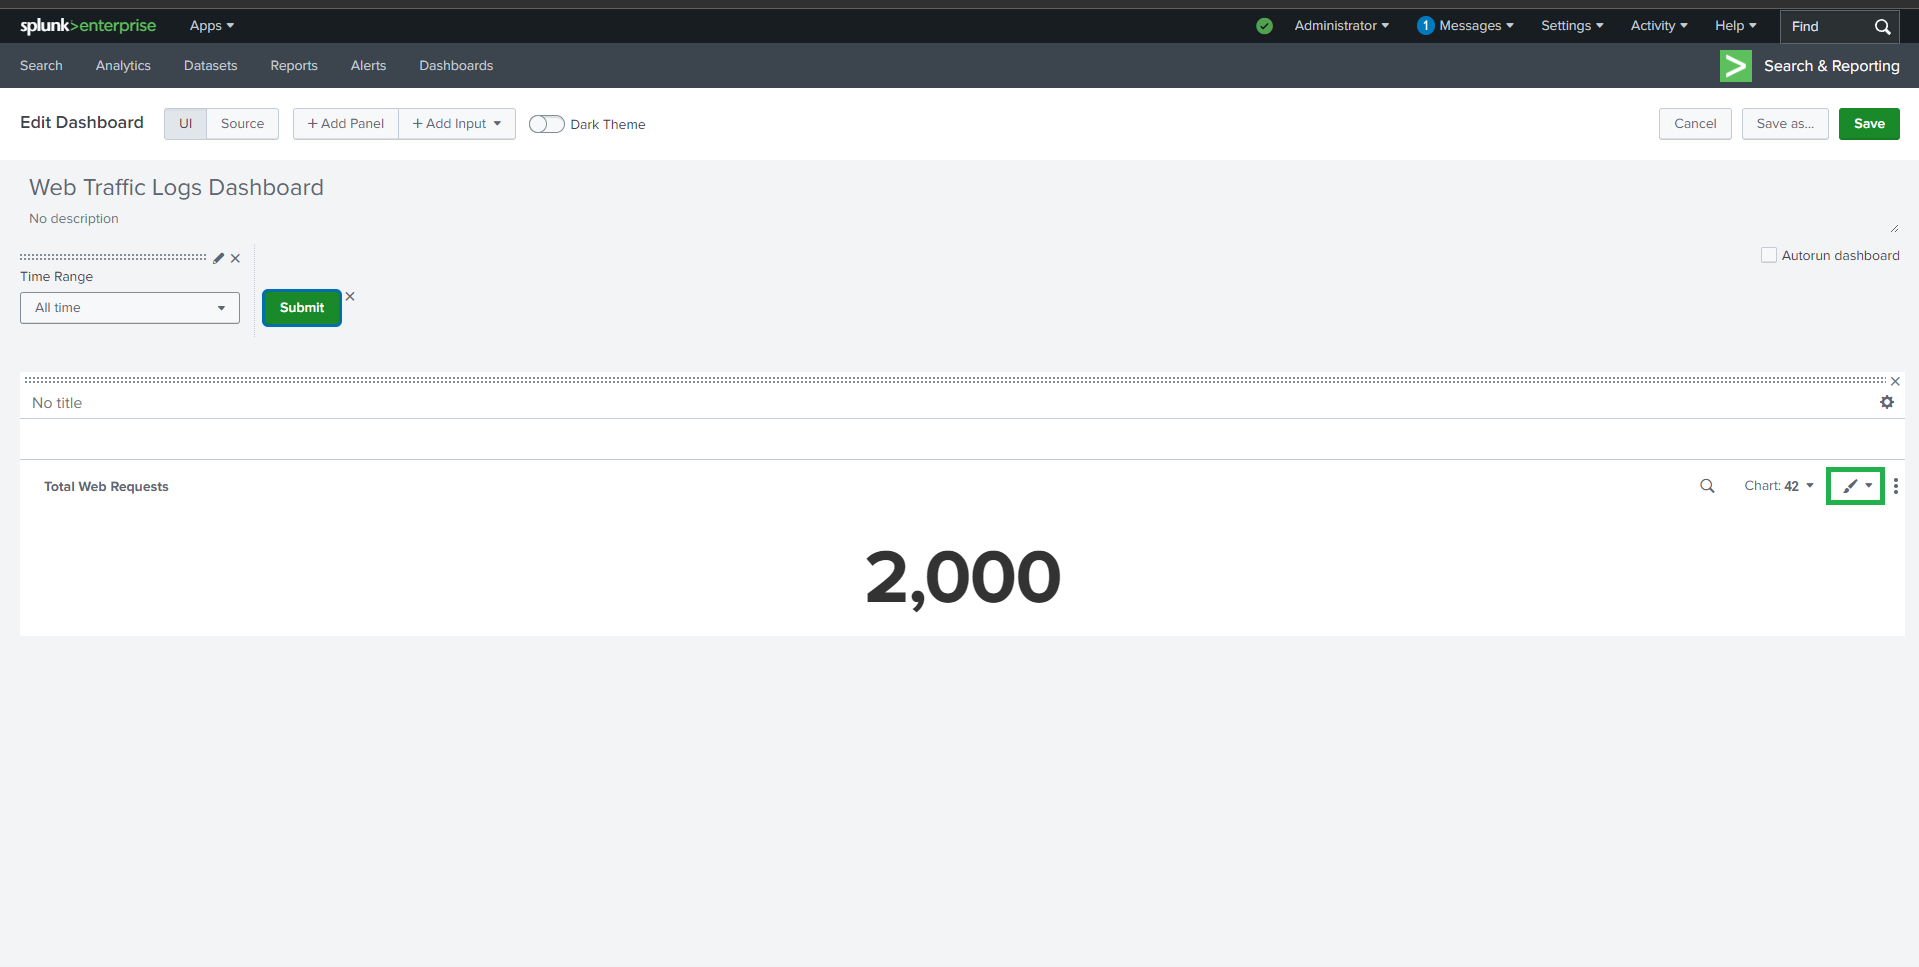
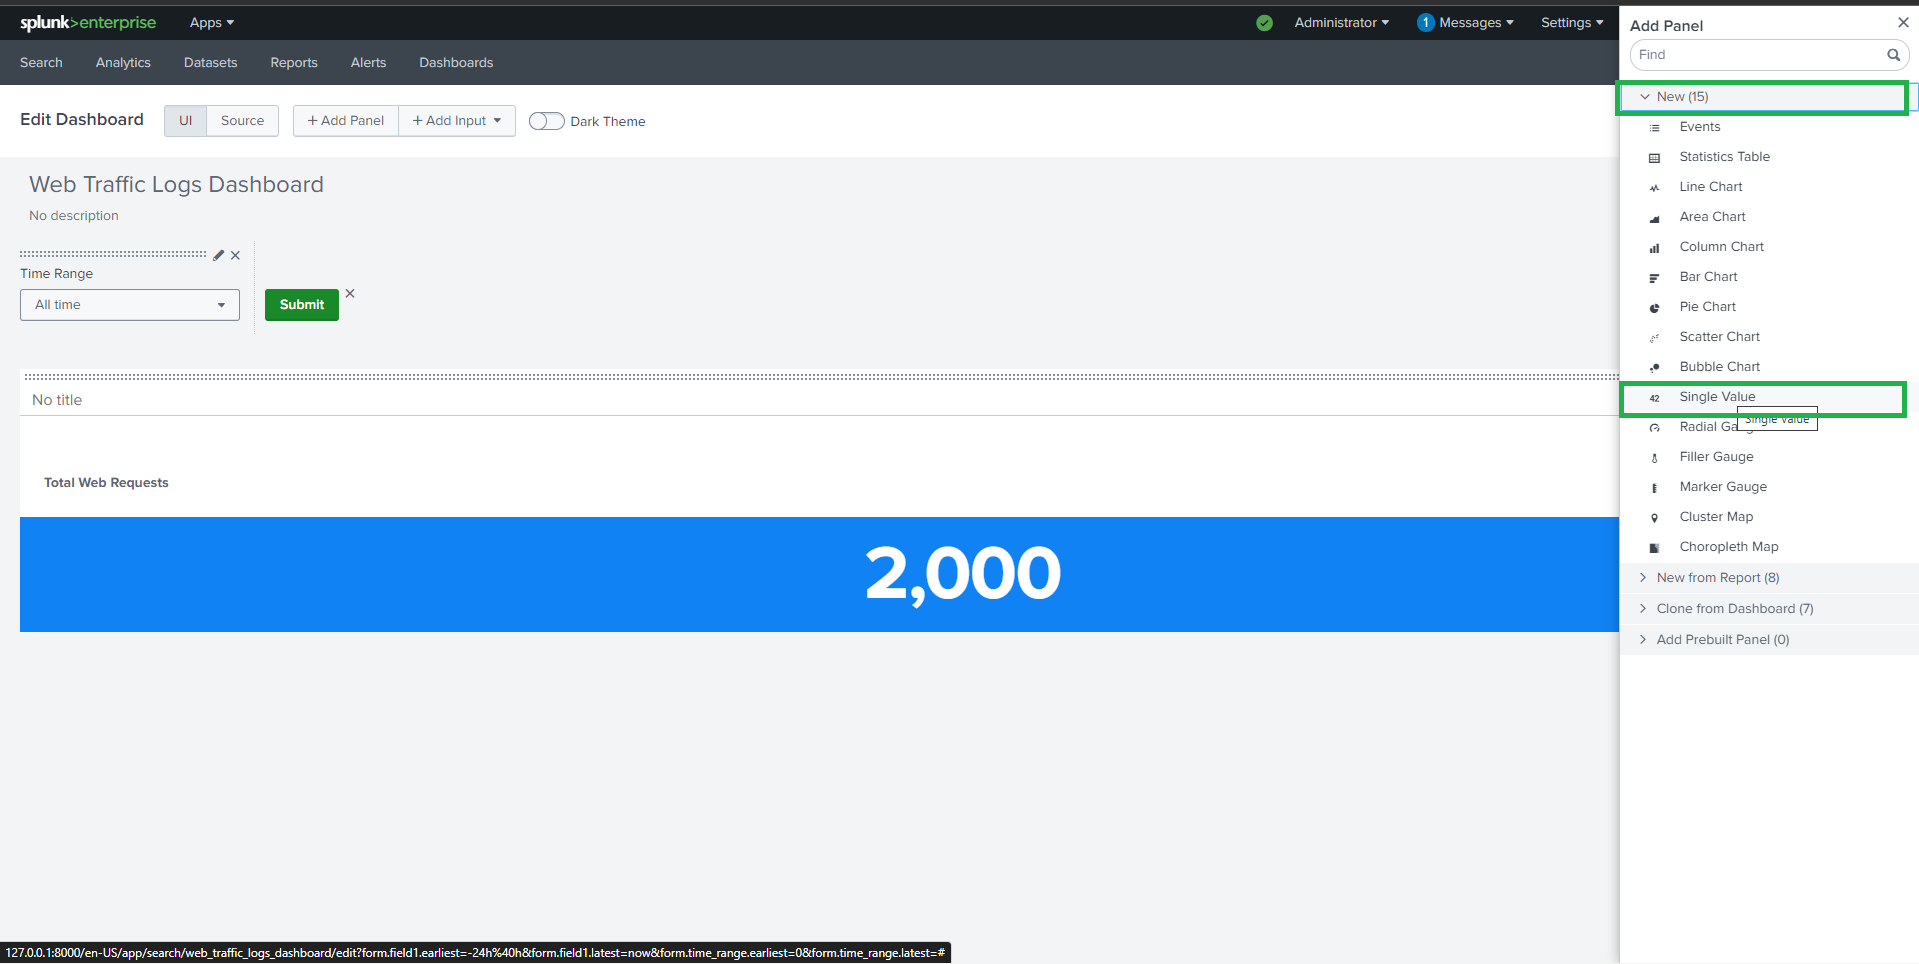
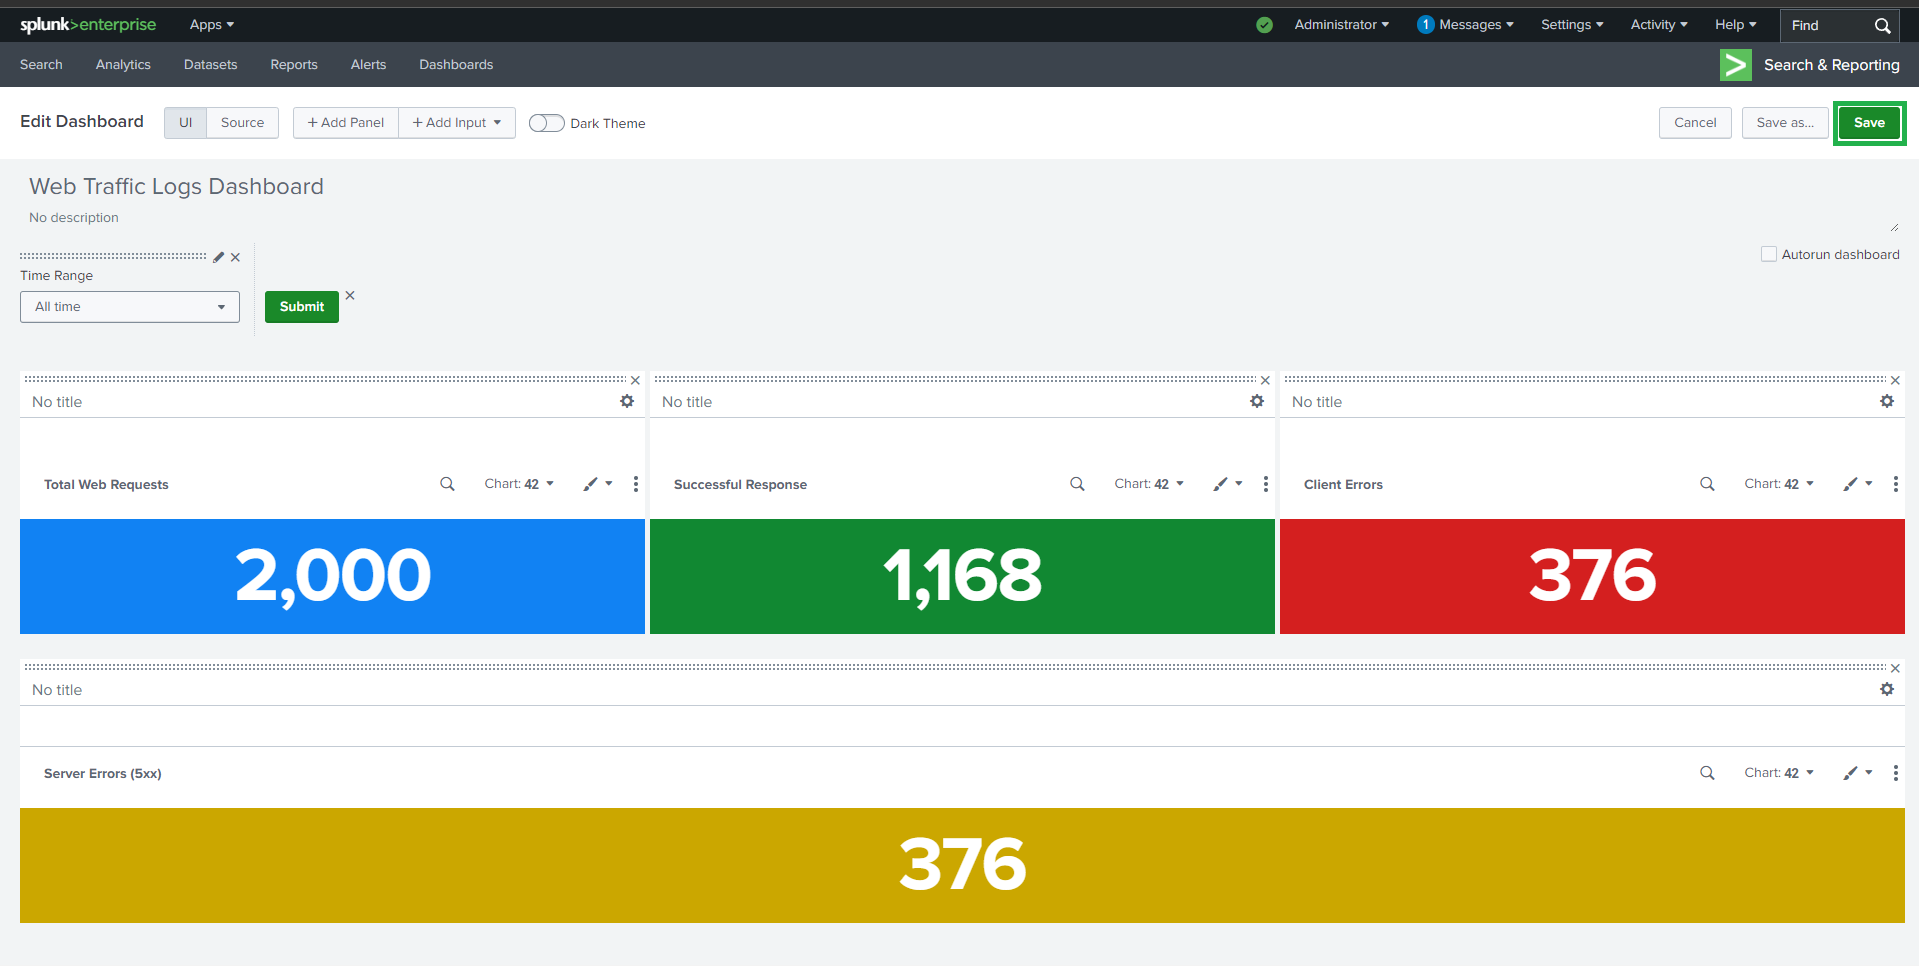
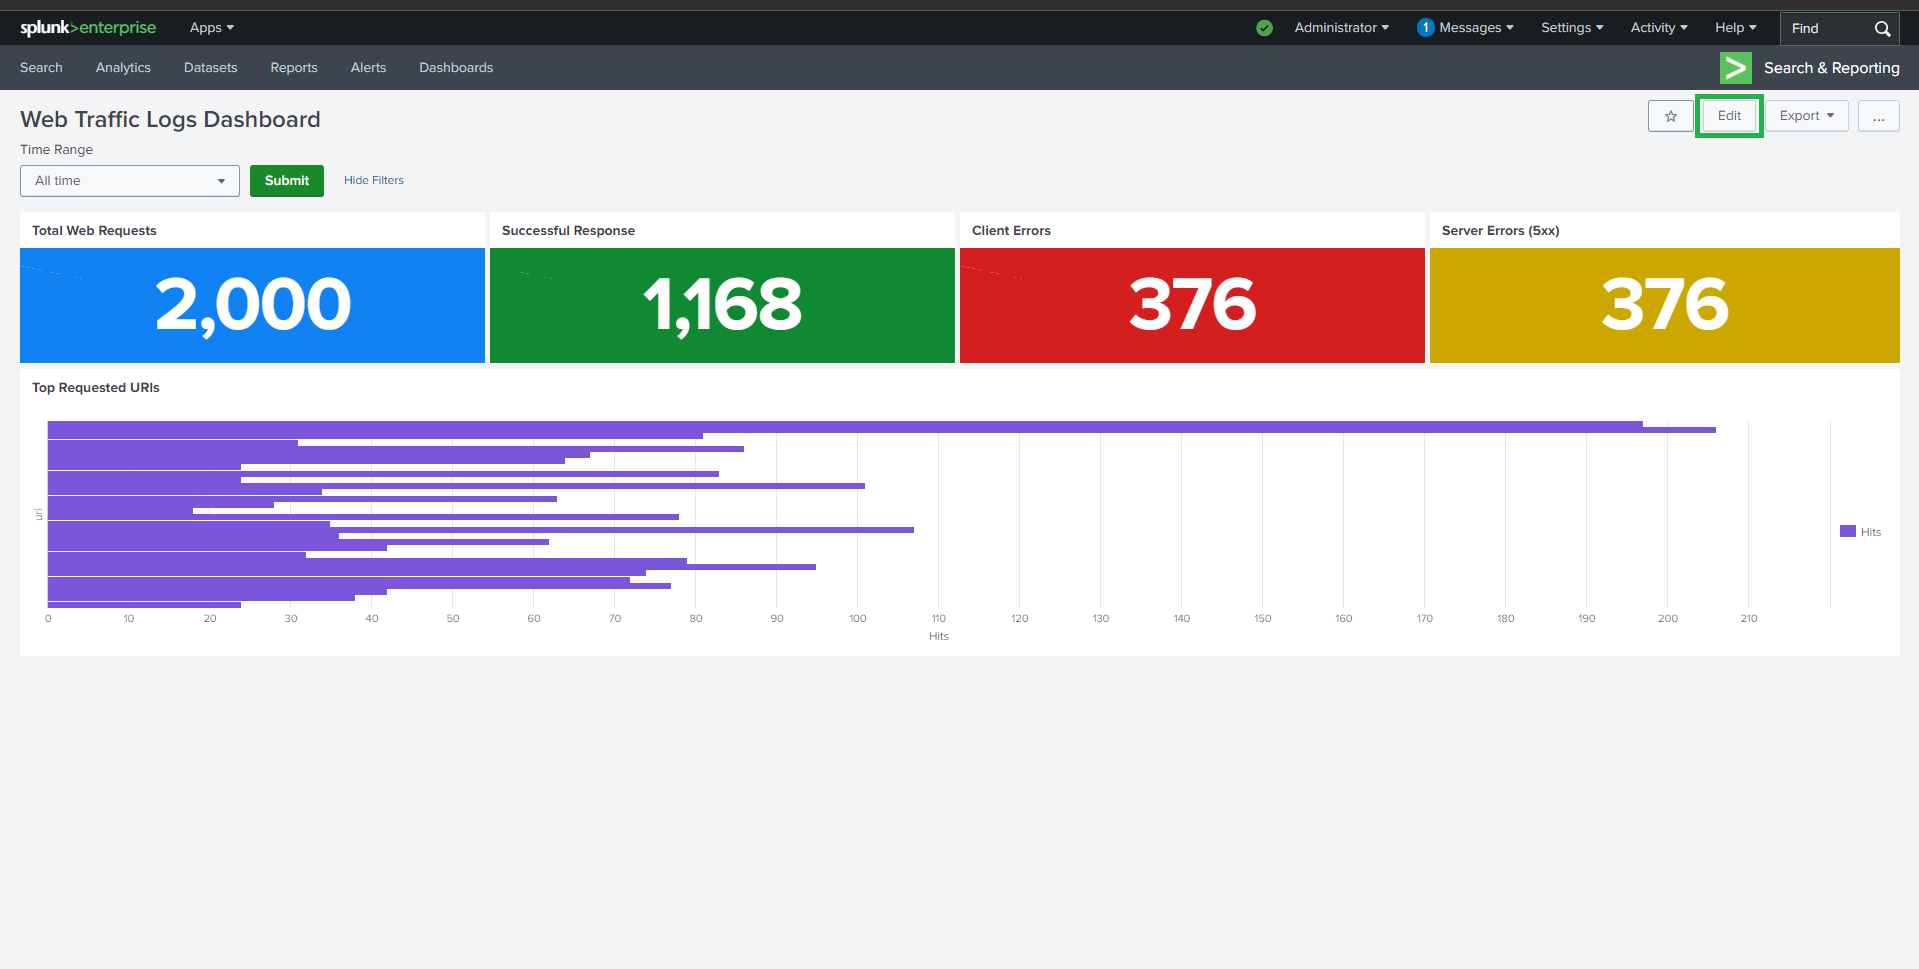
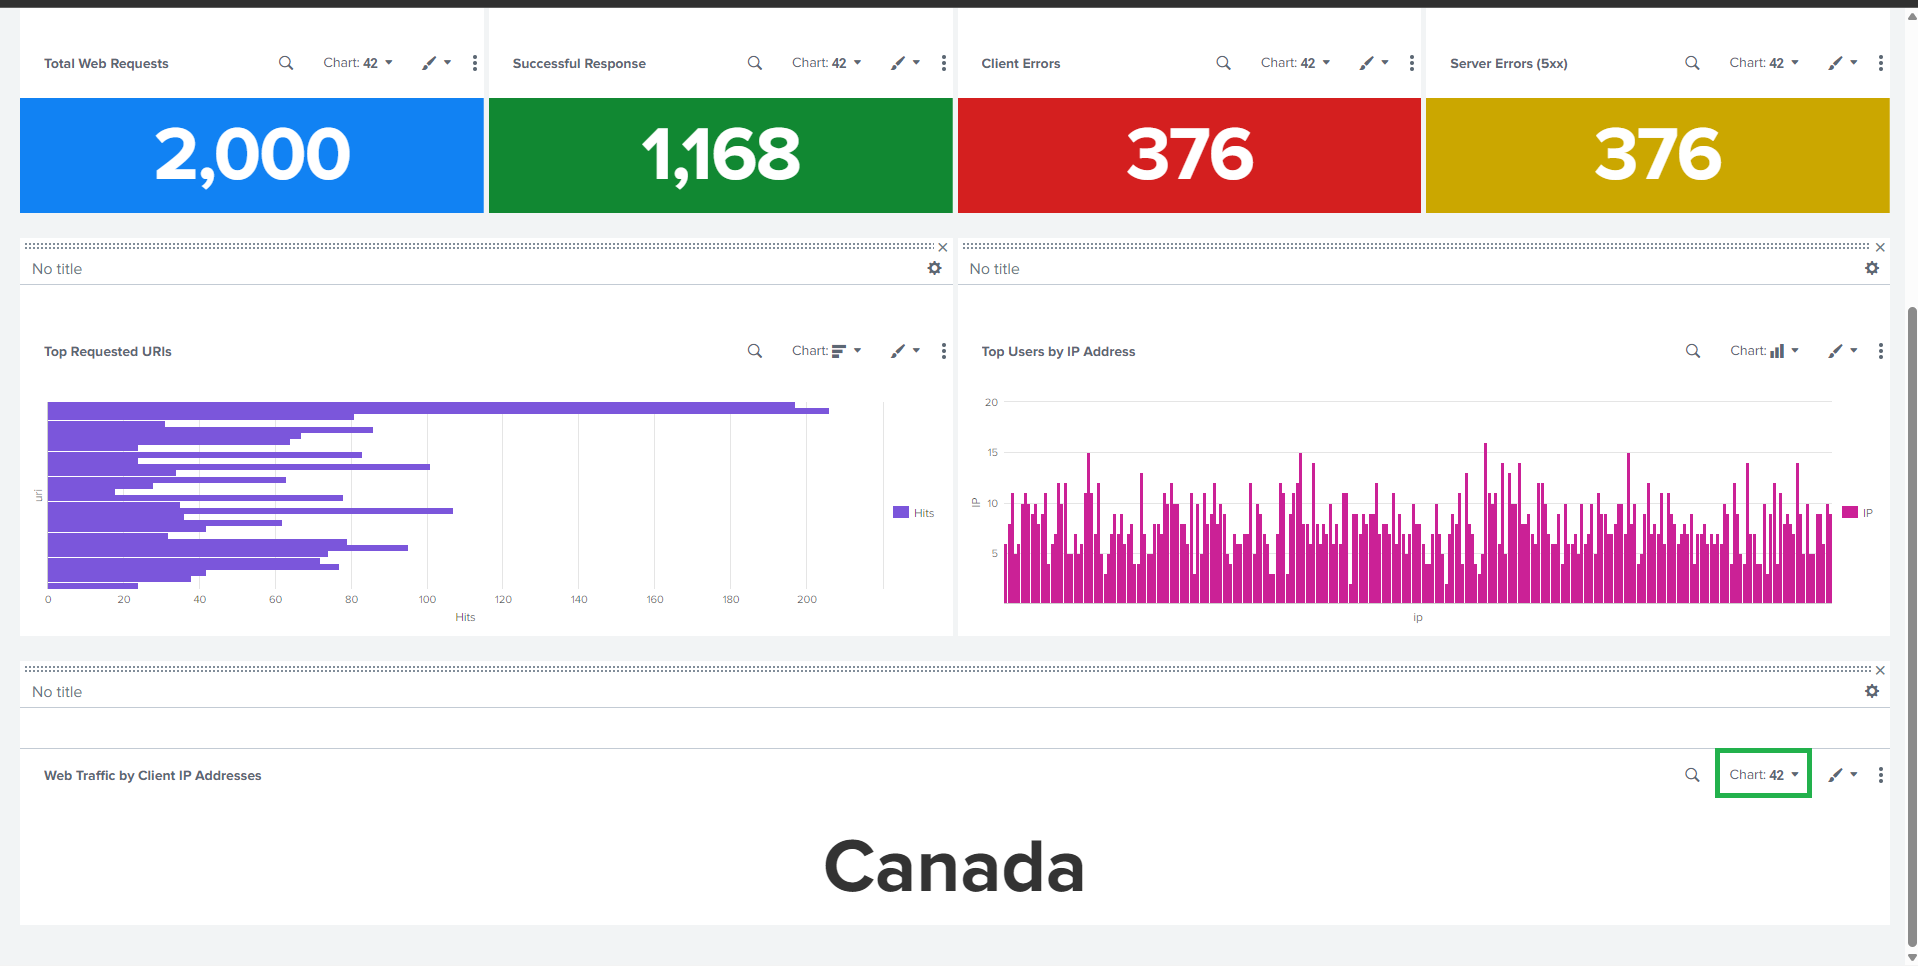
##  ## 📈 任务 1:Web 活动
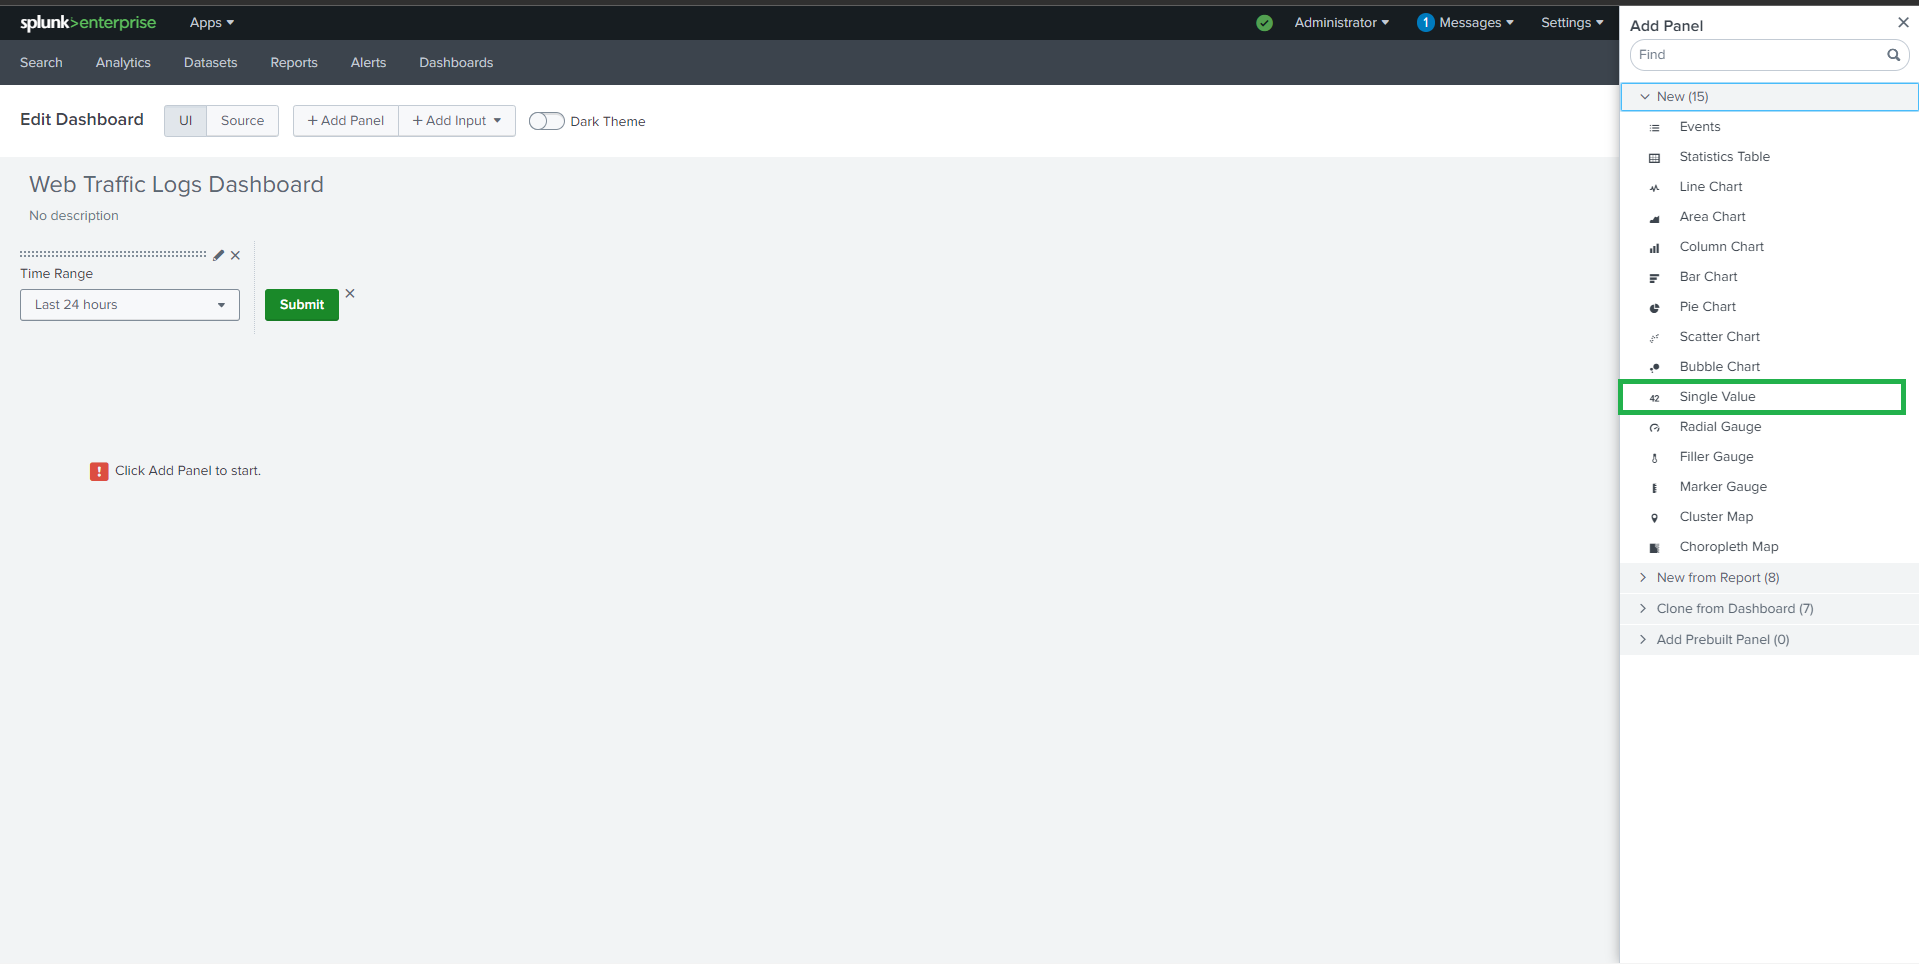
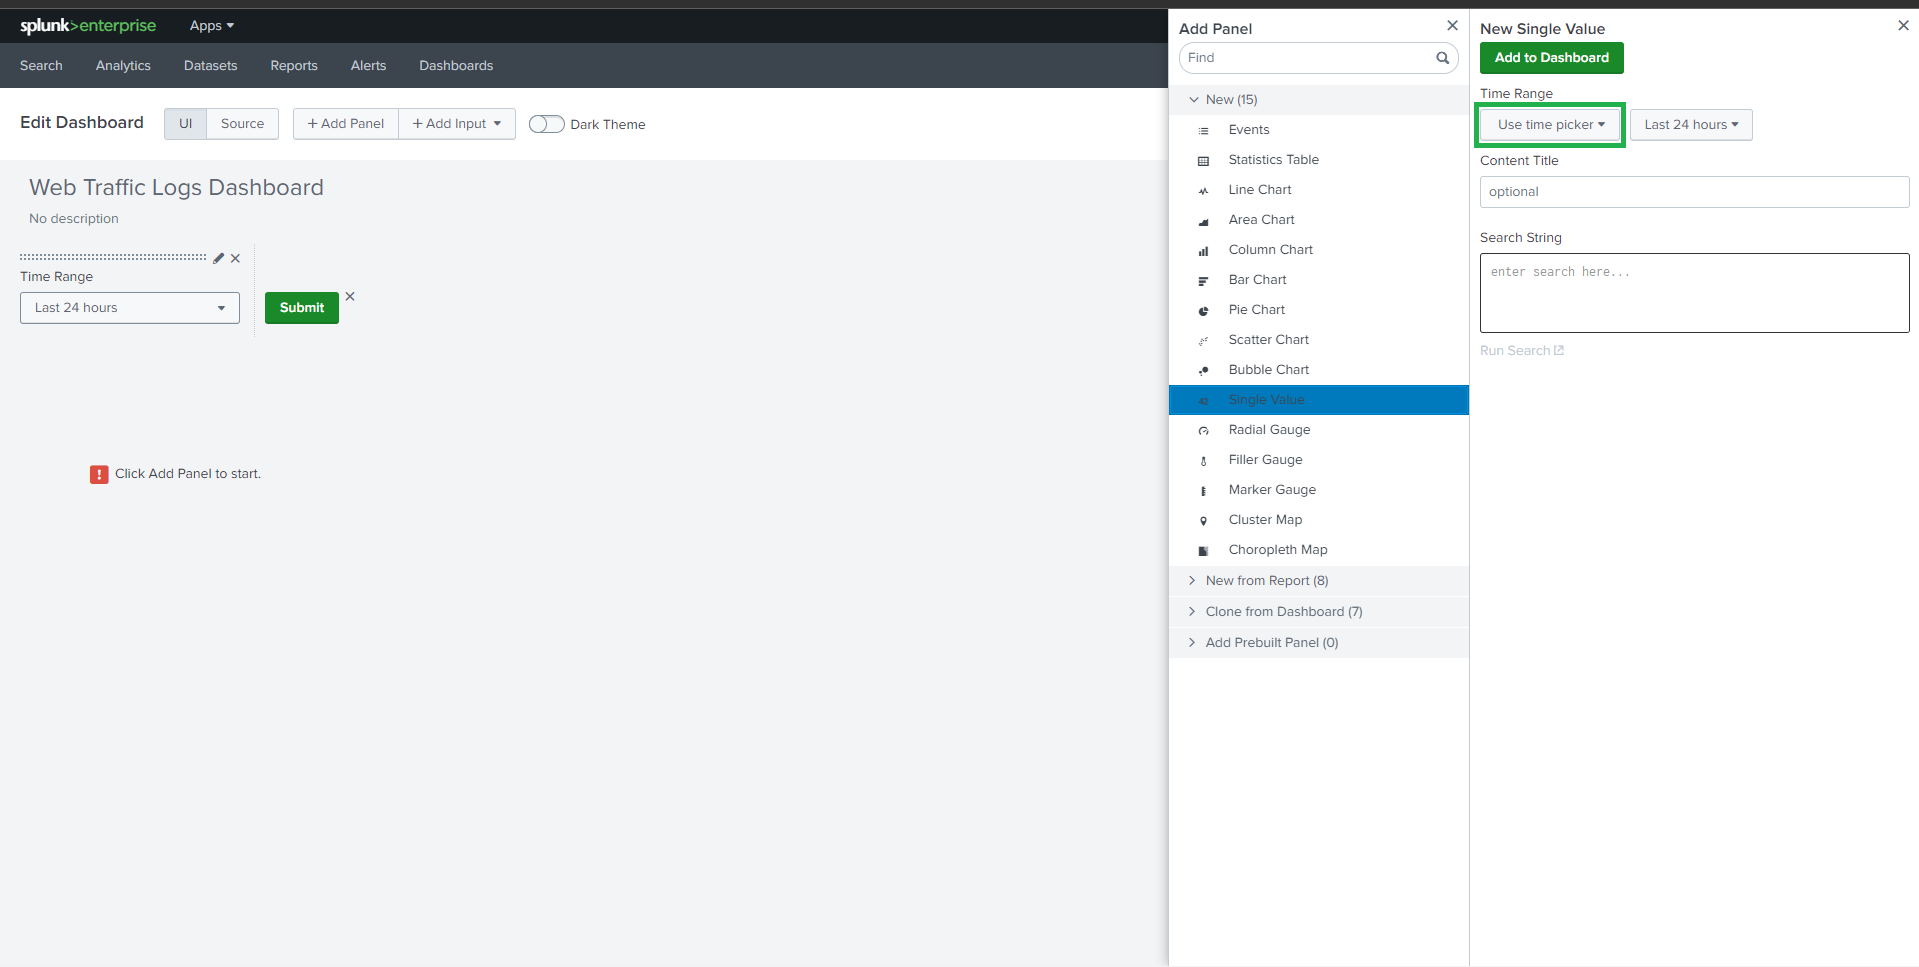
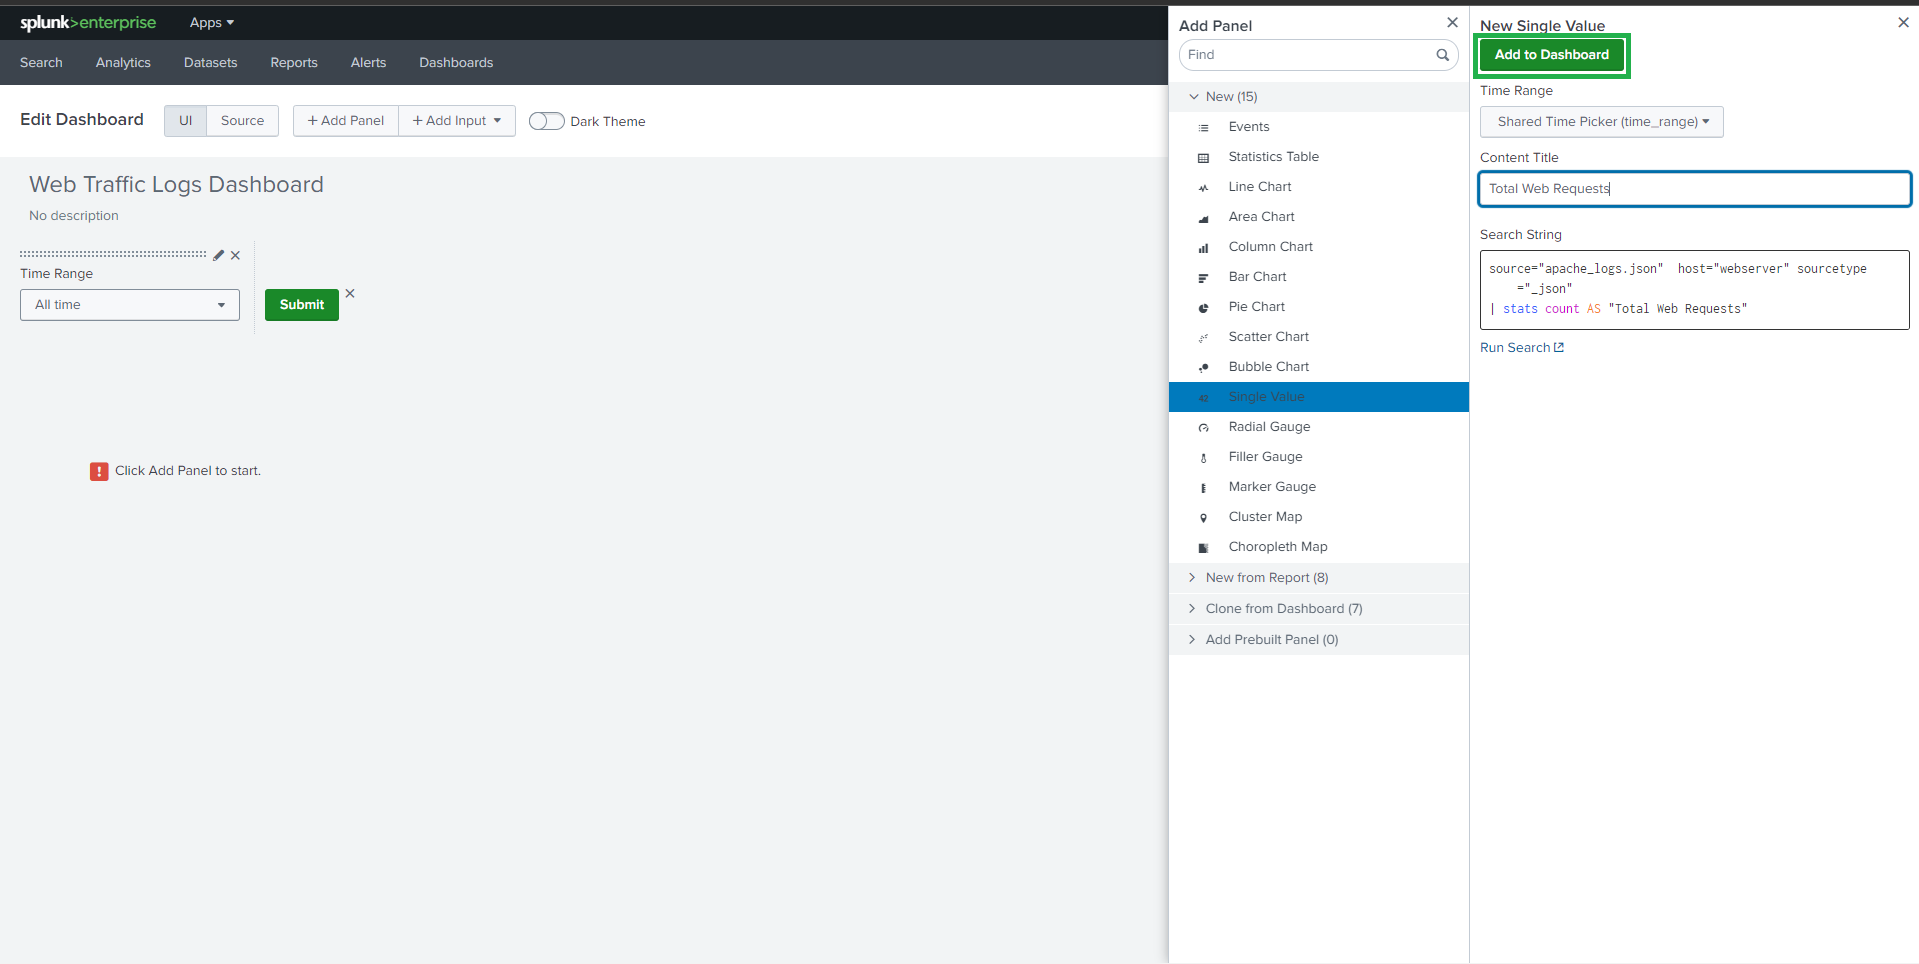
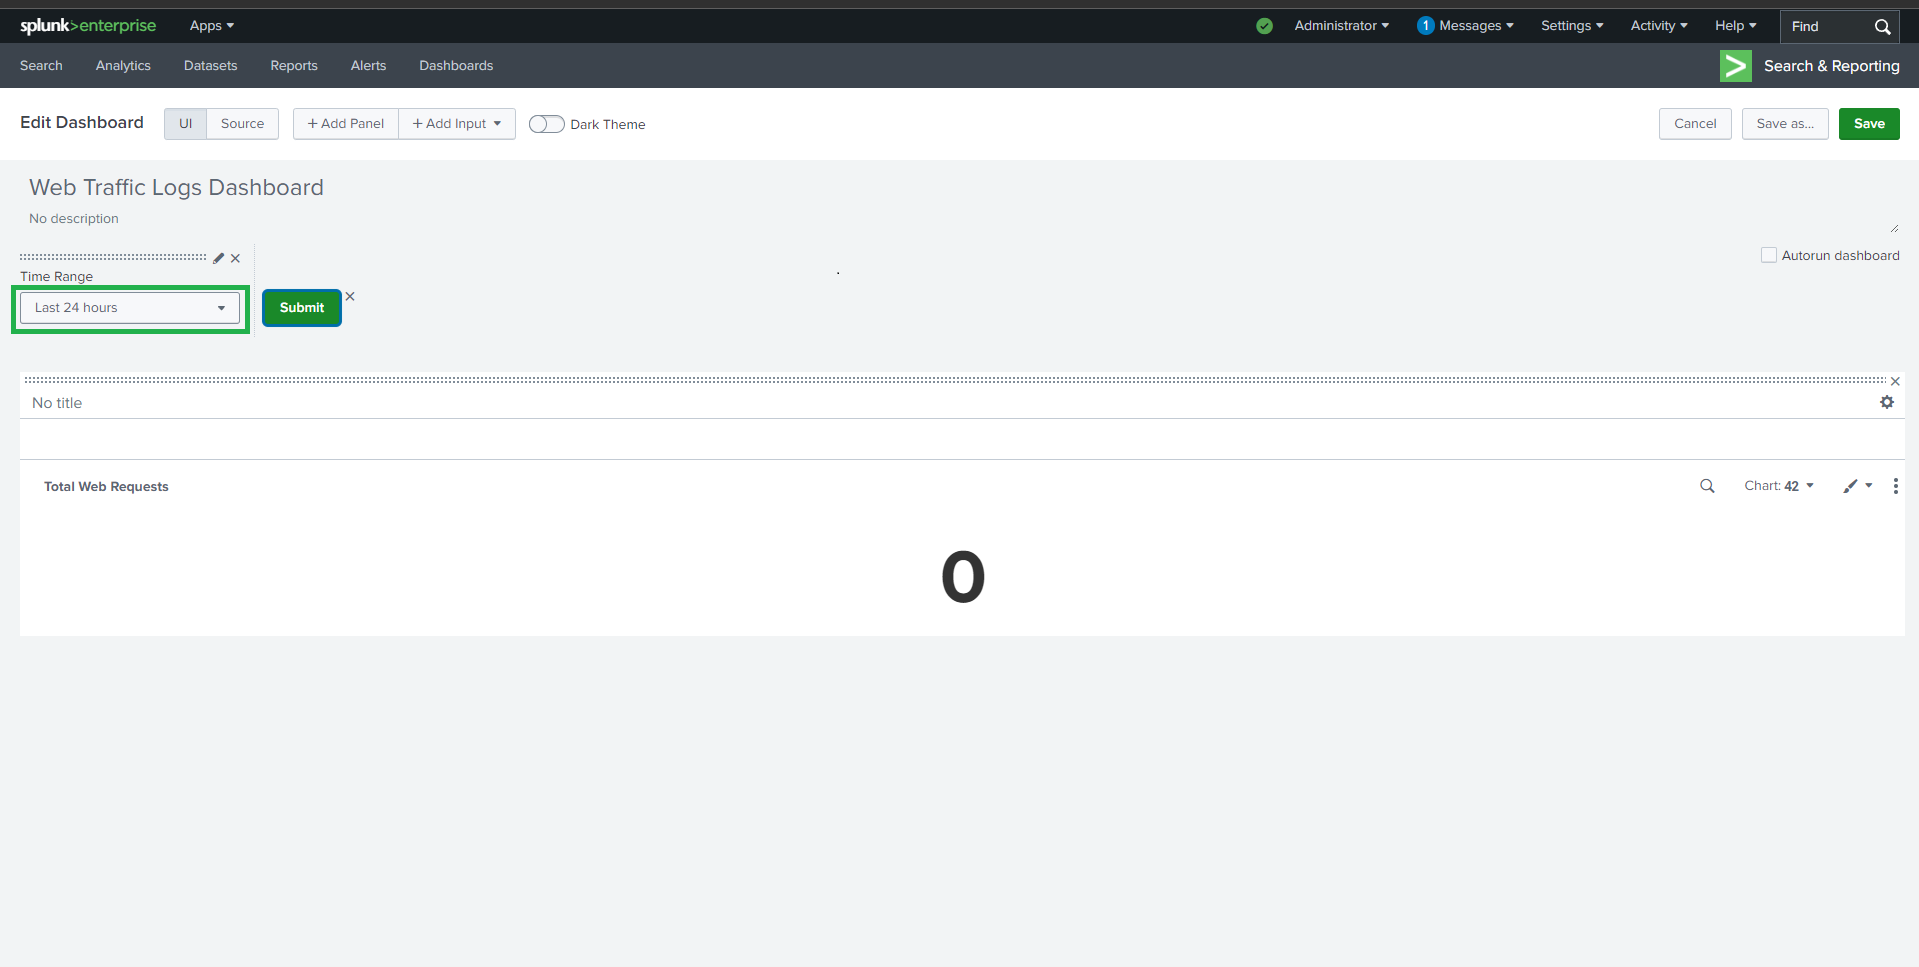
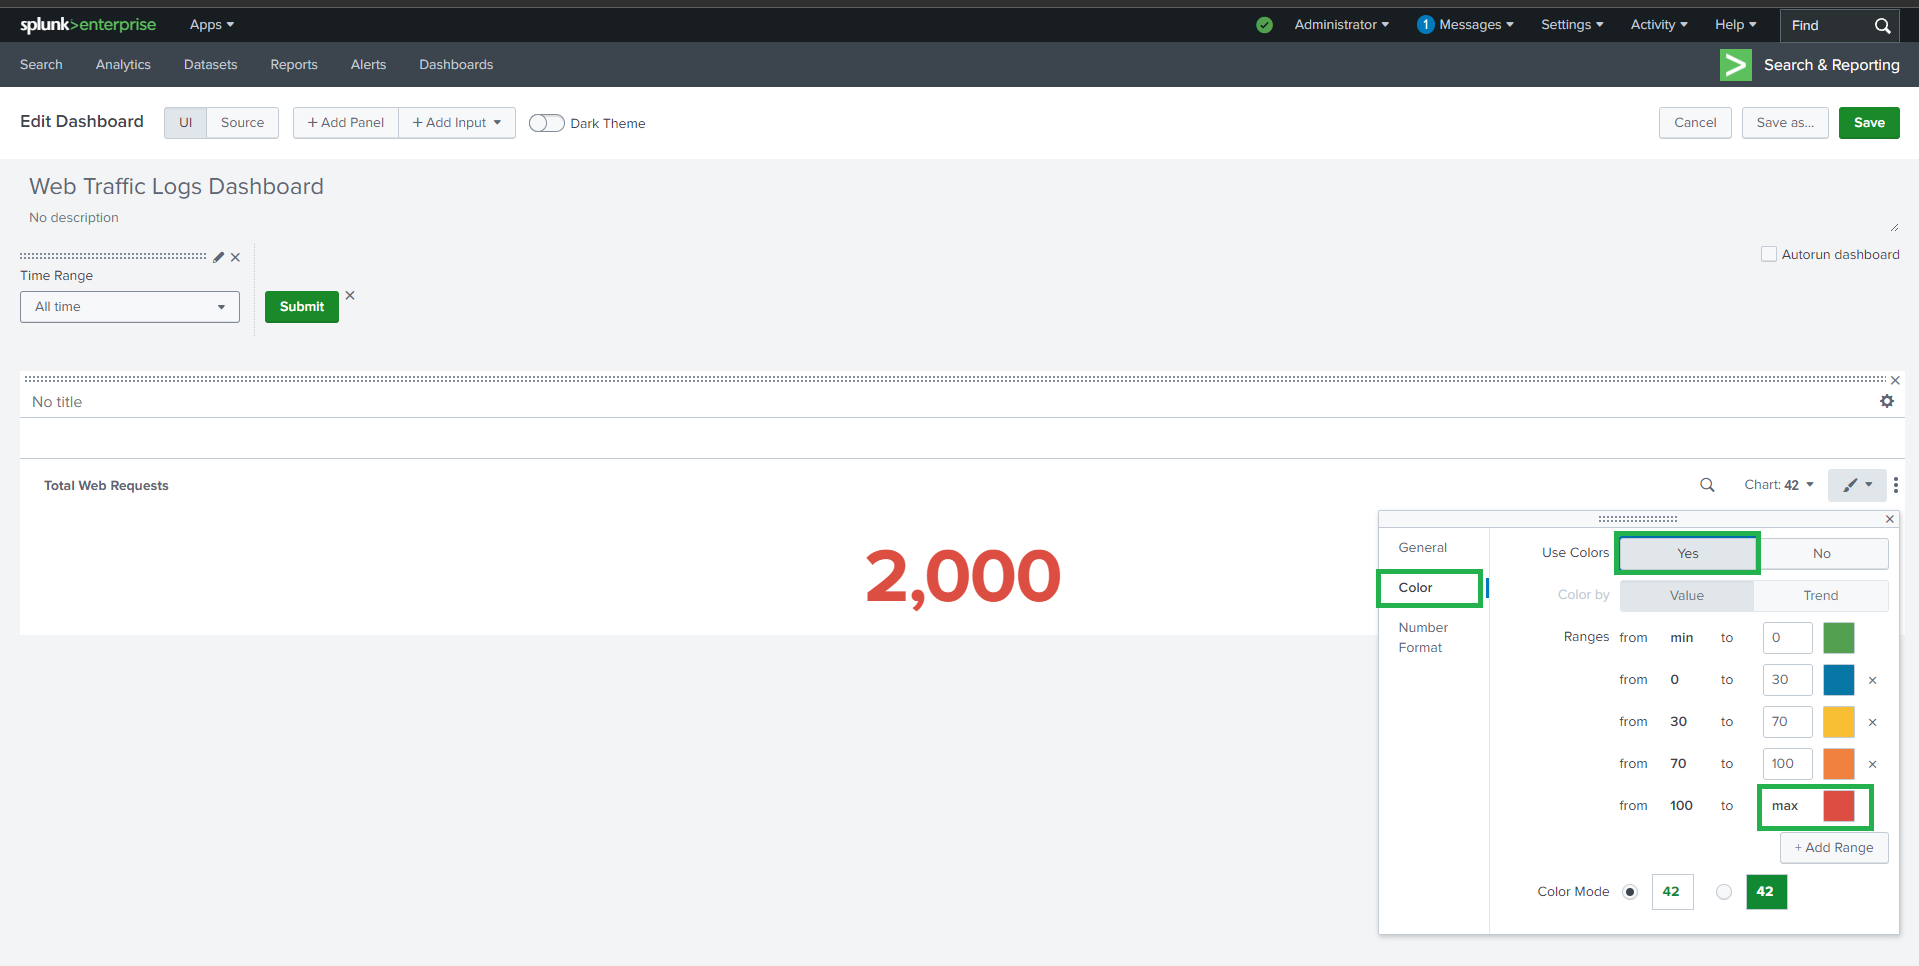
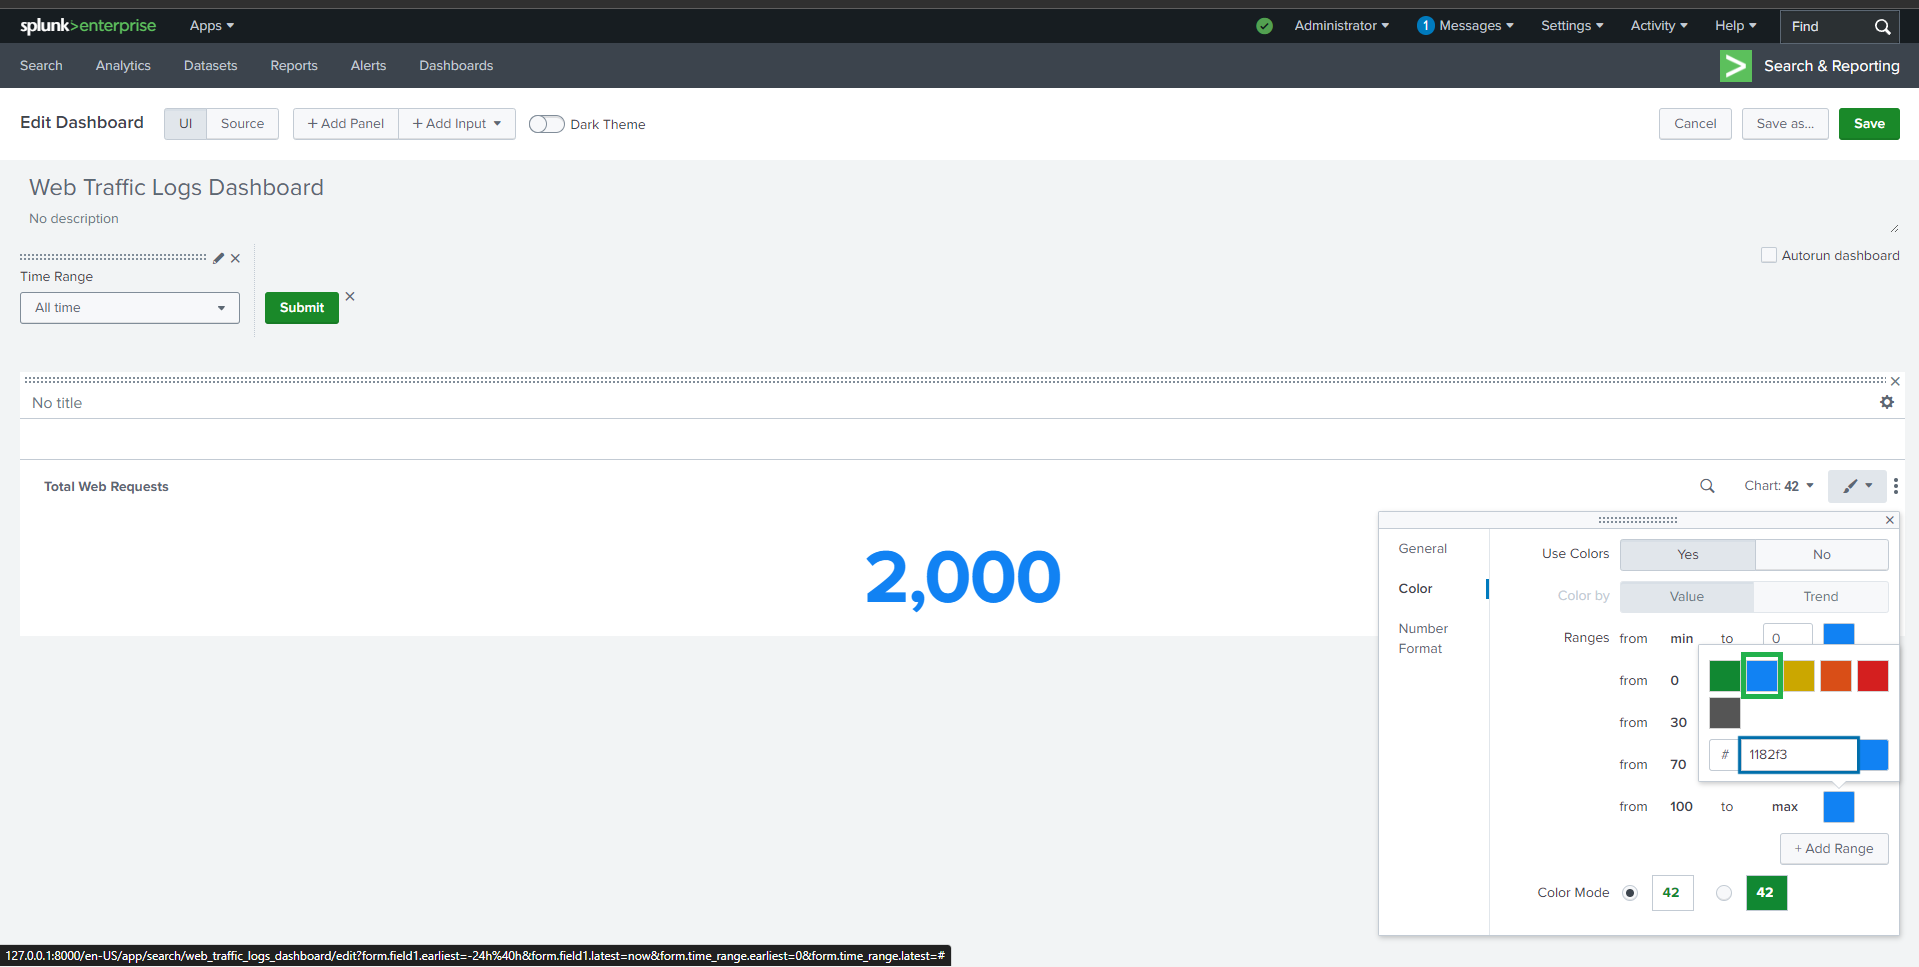
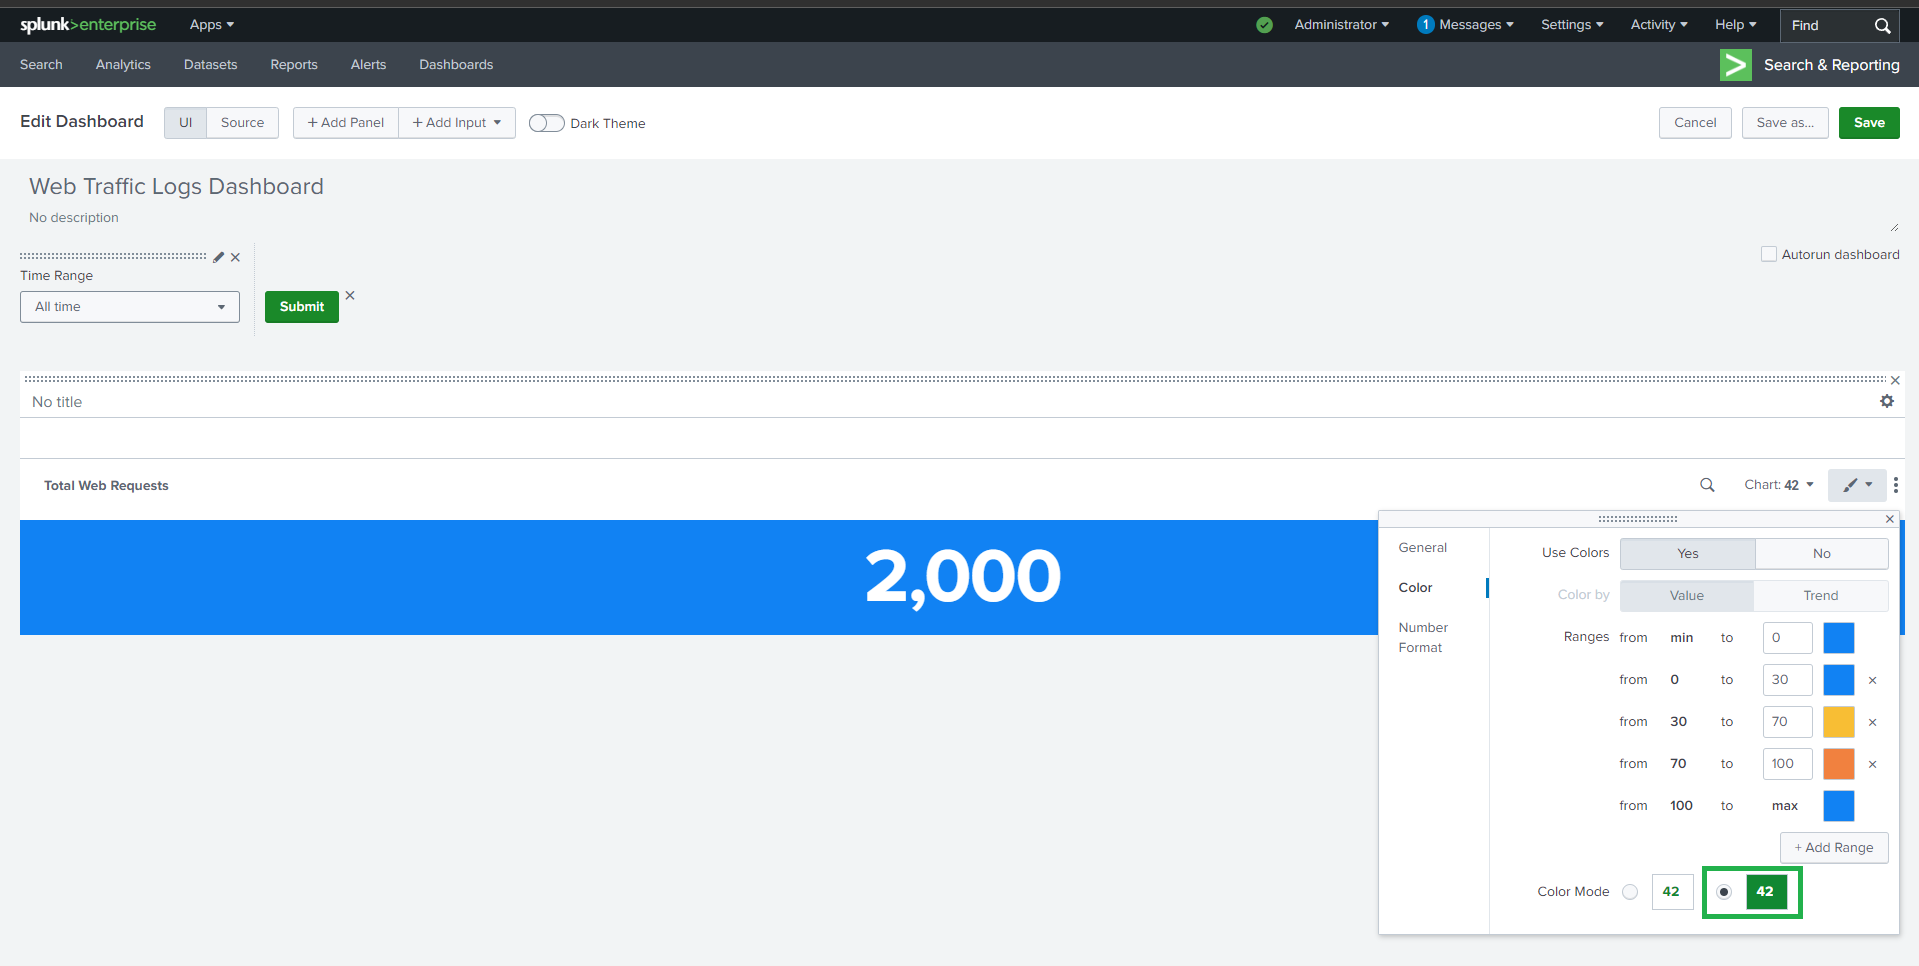
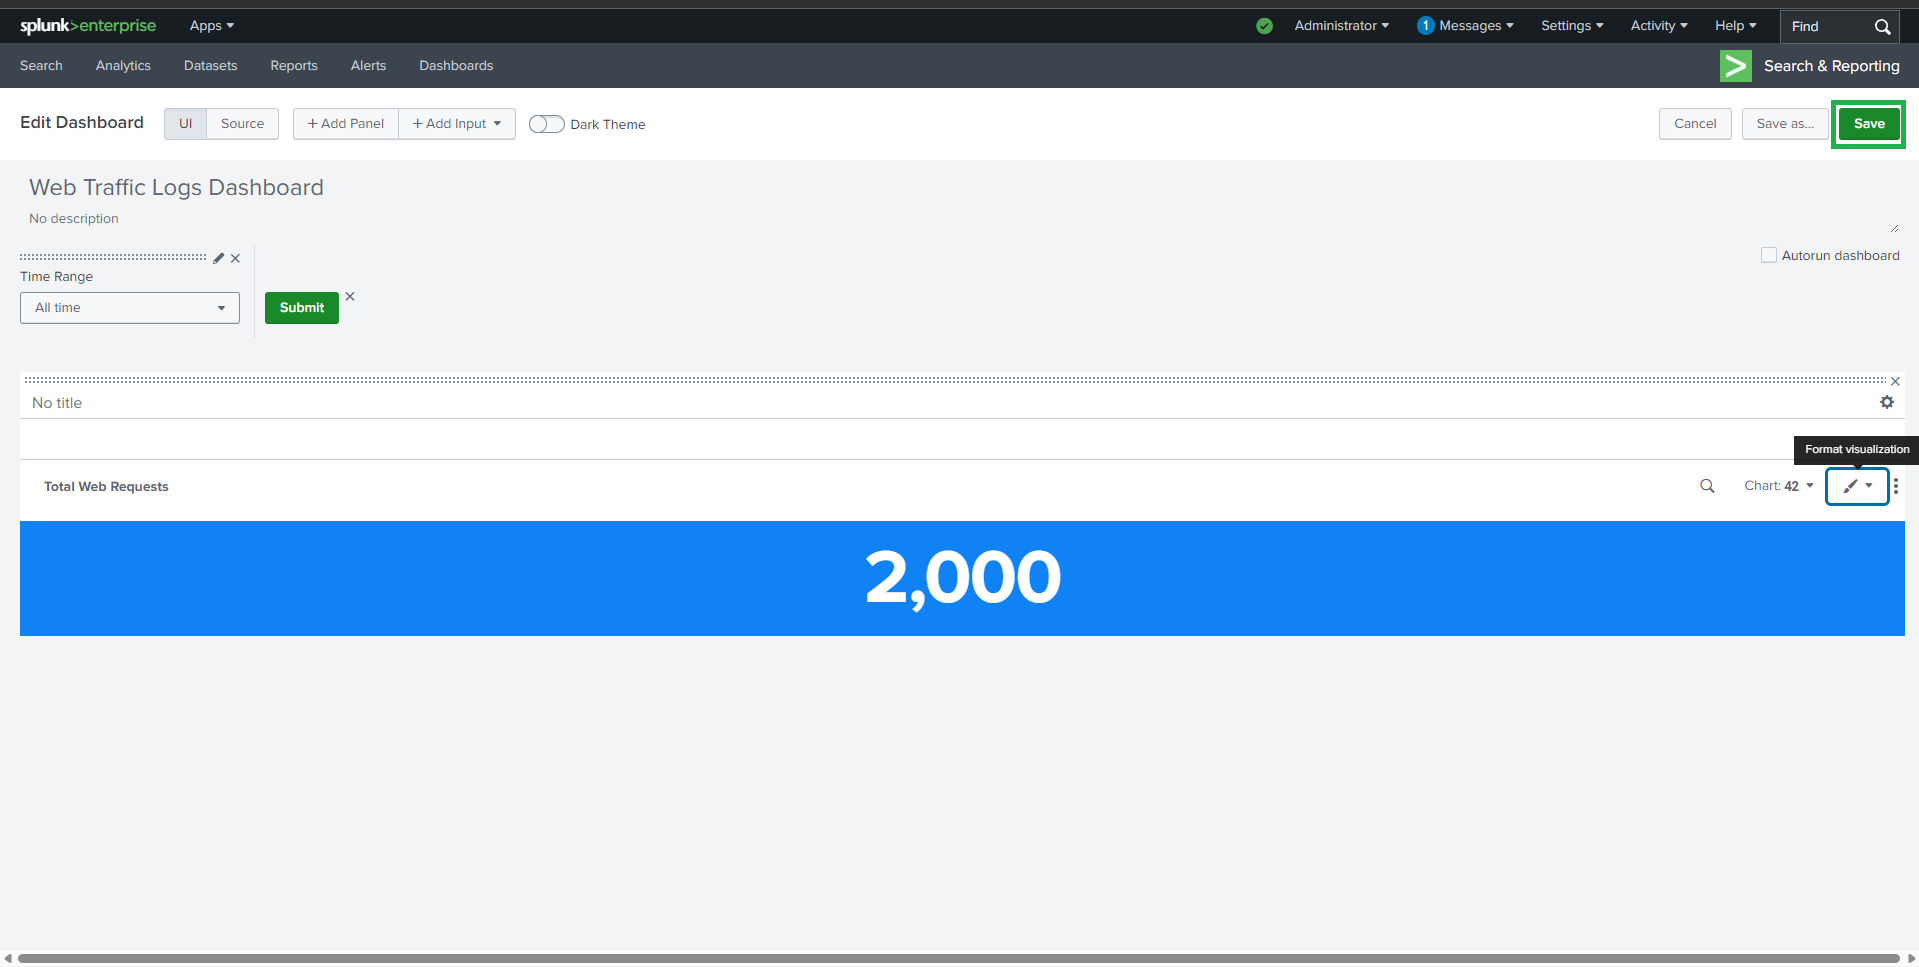
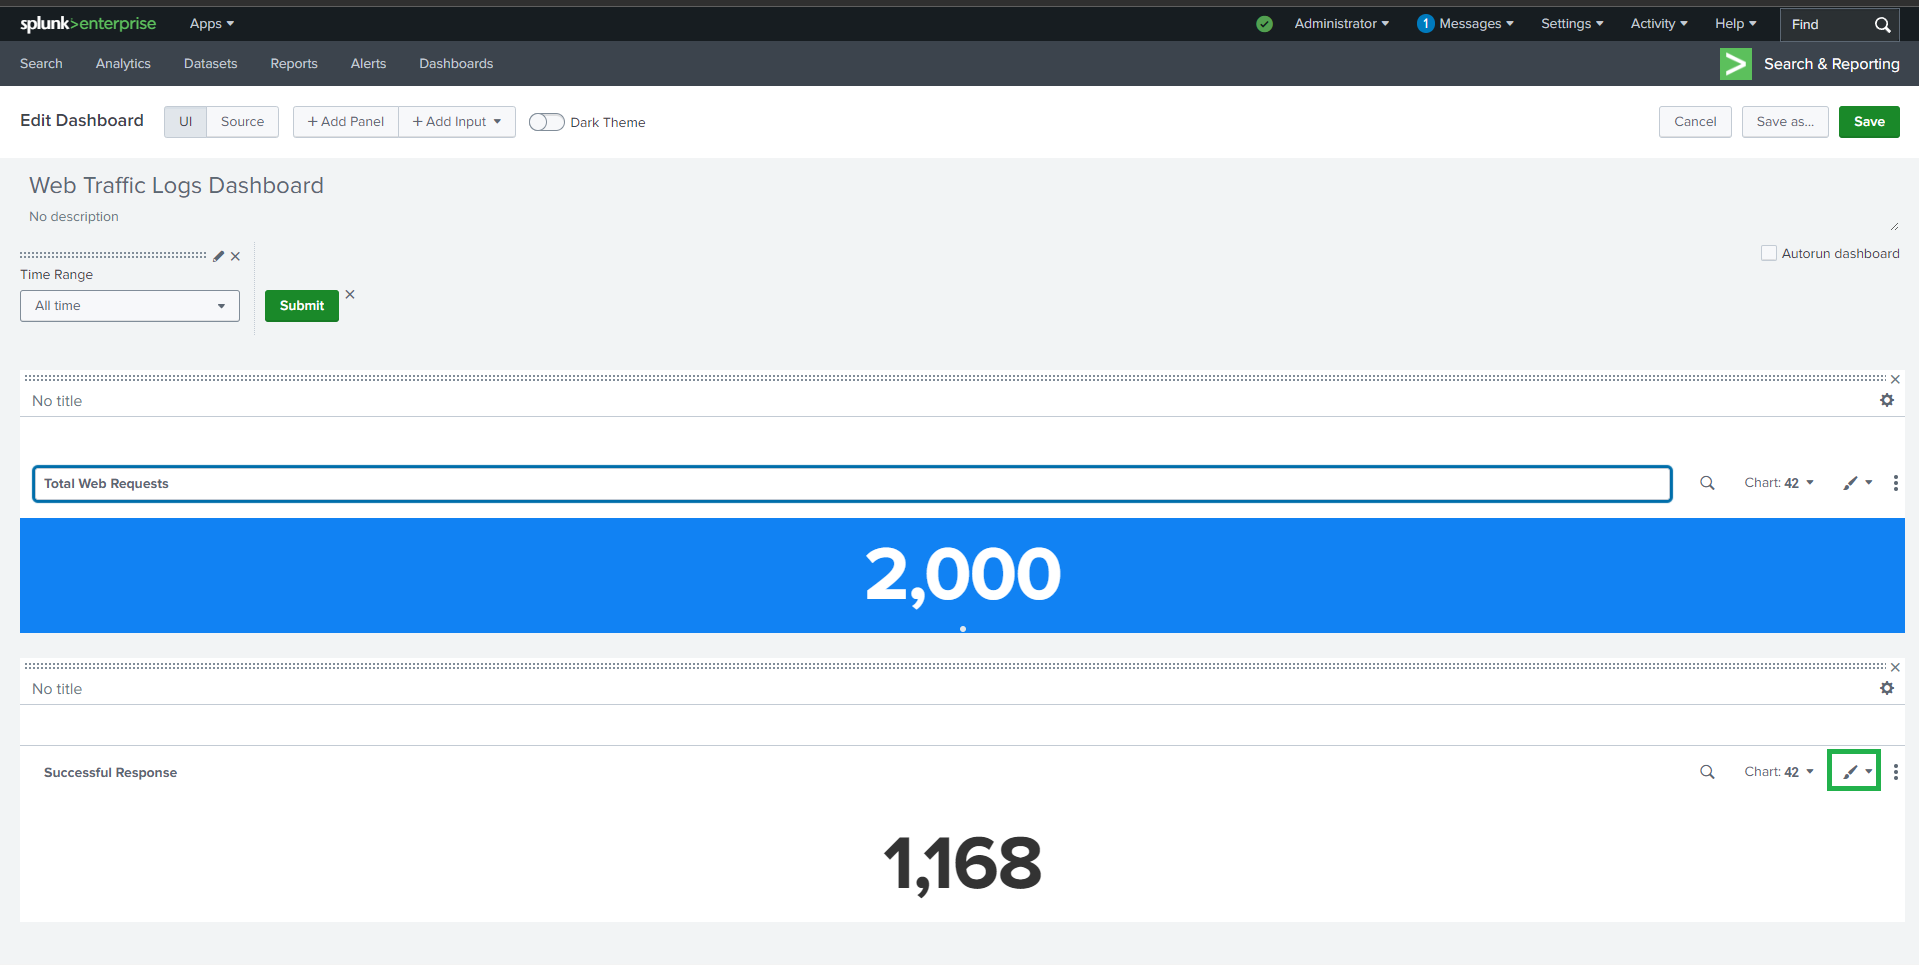
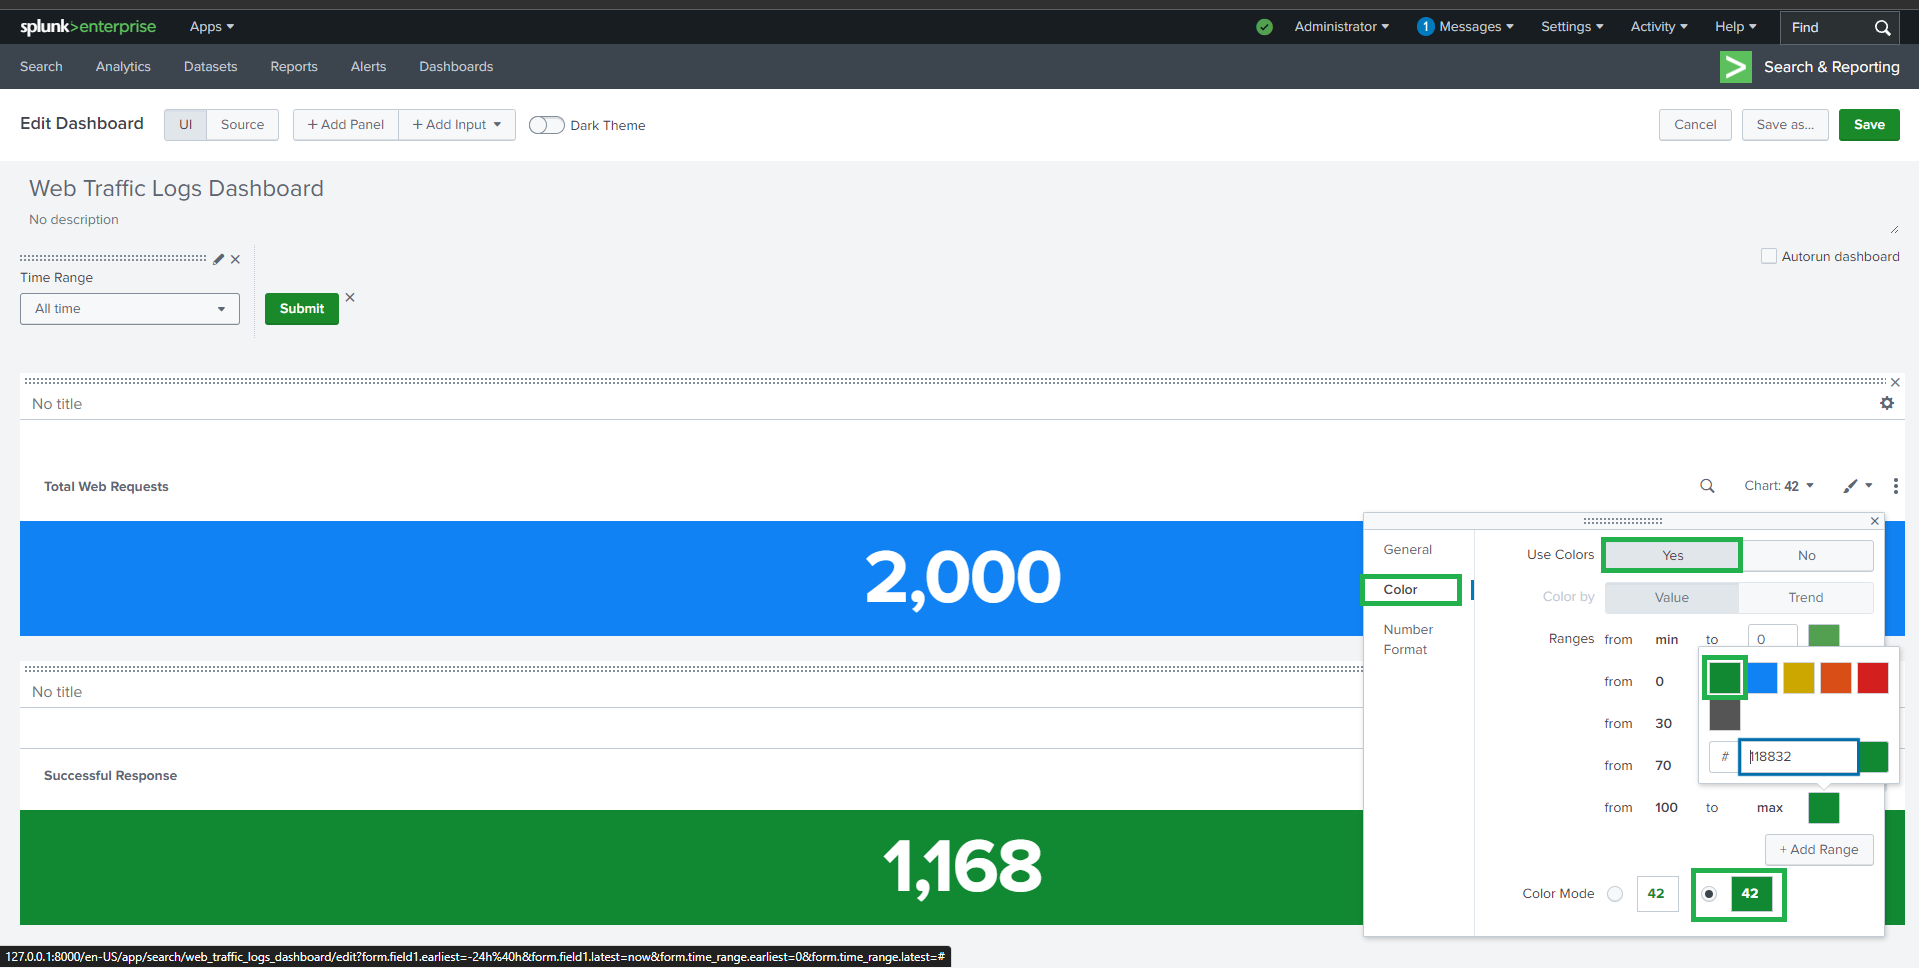
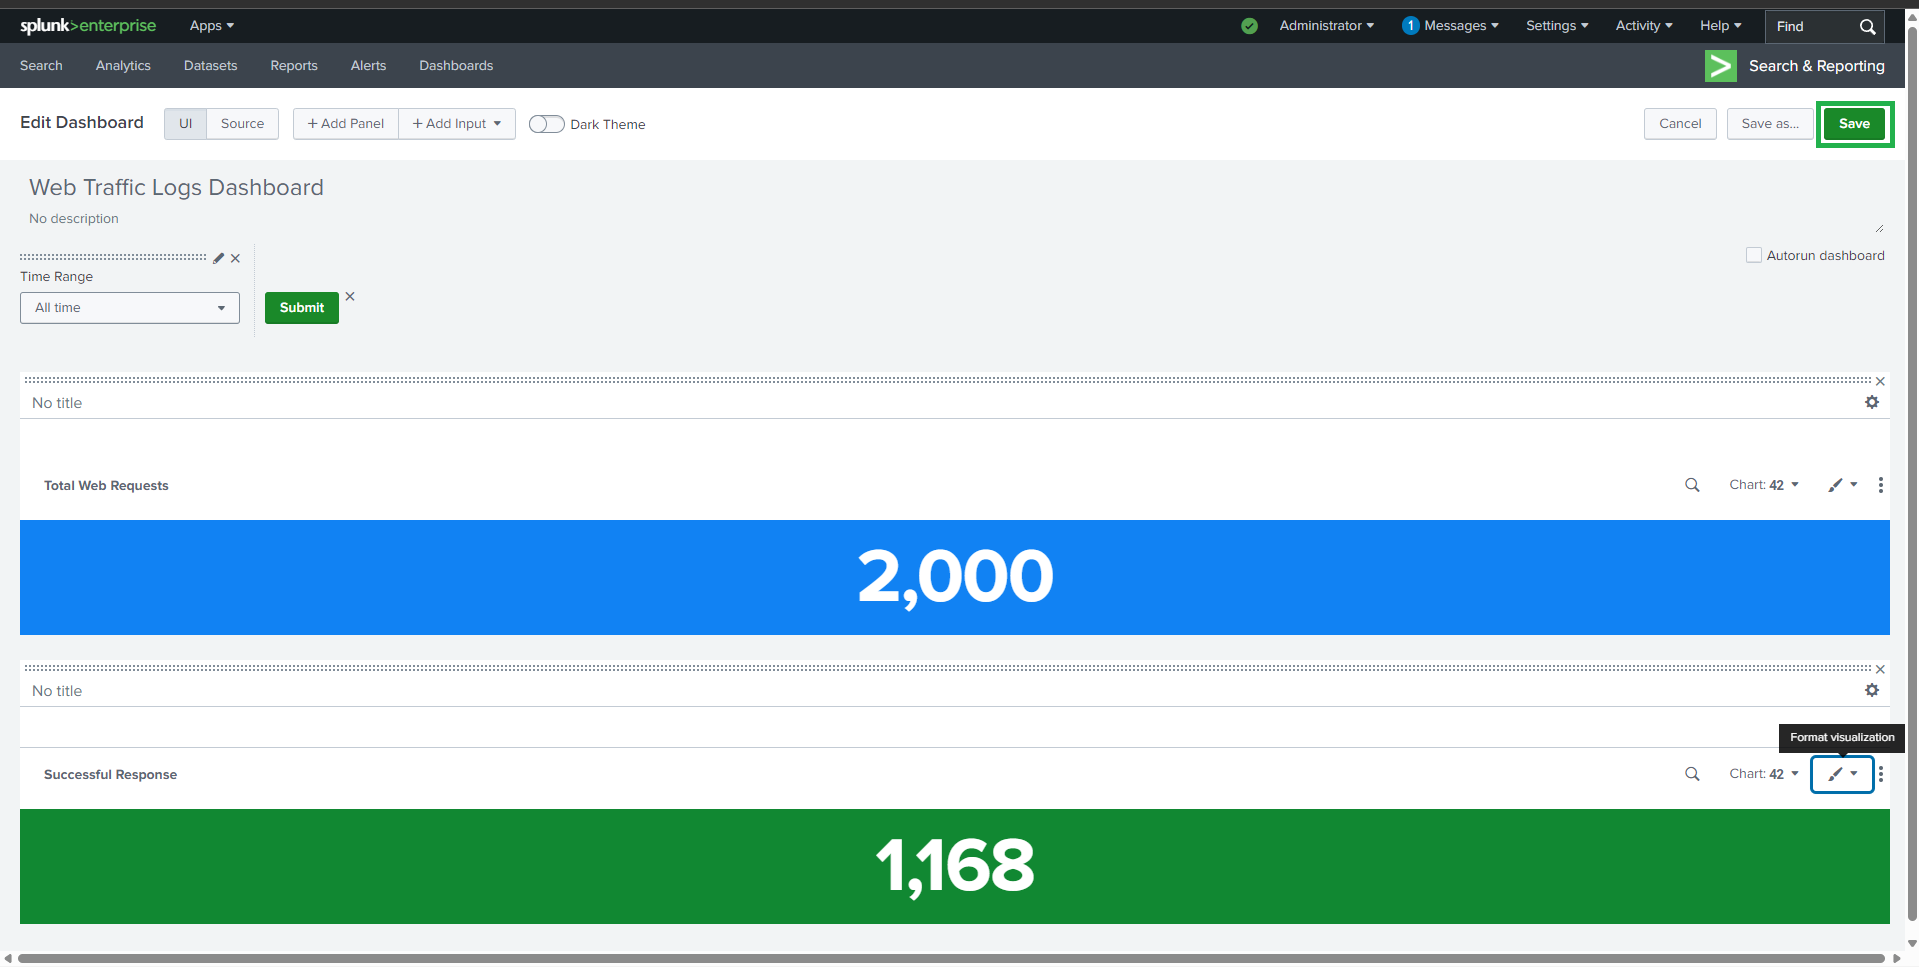
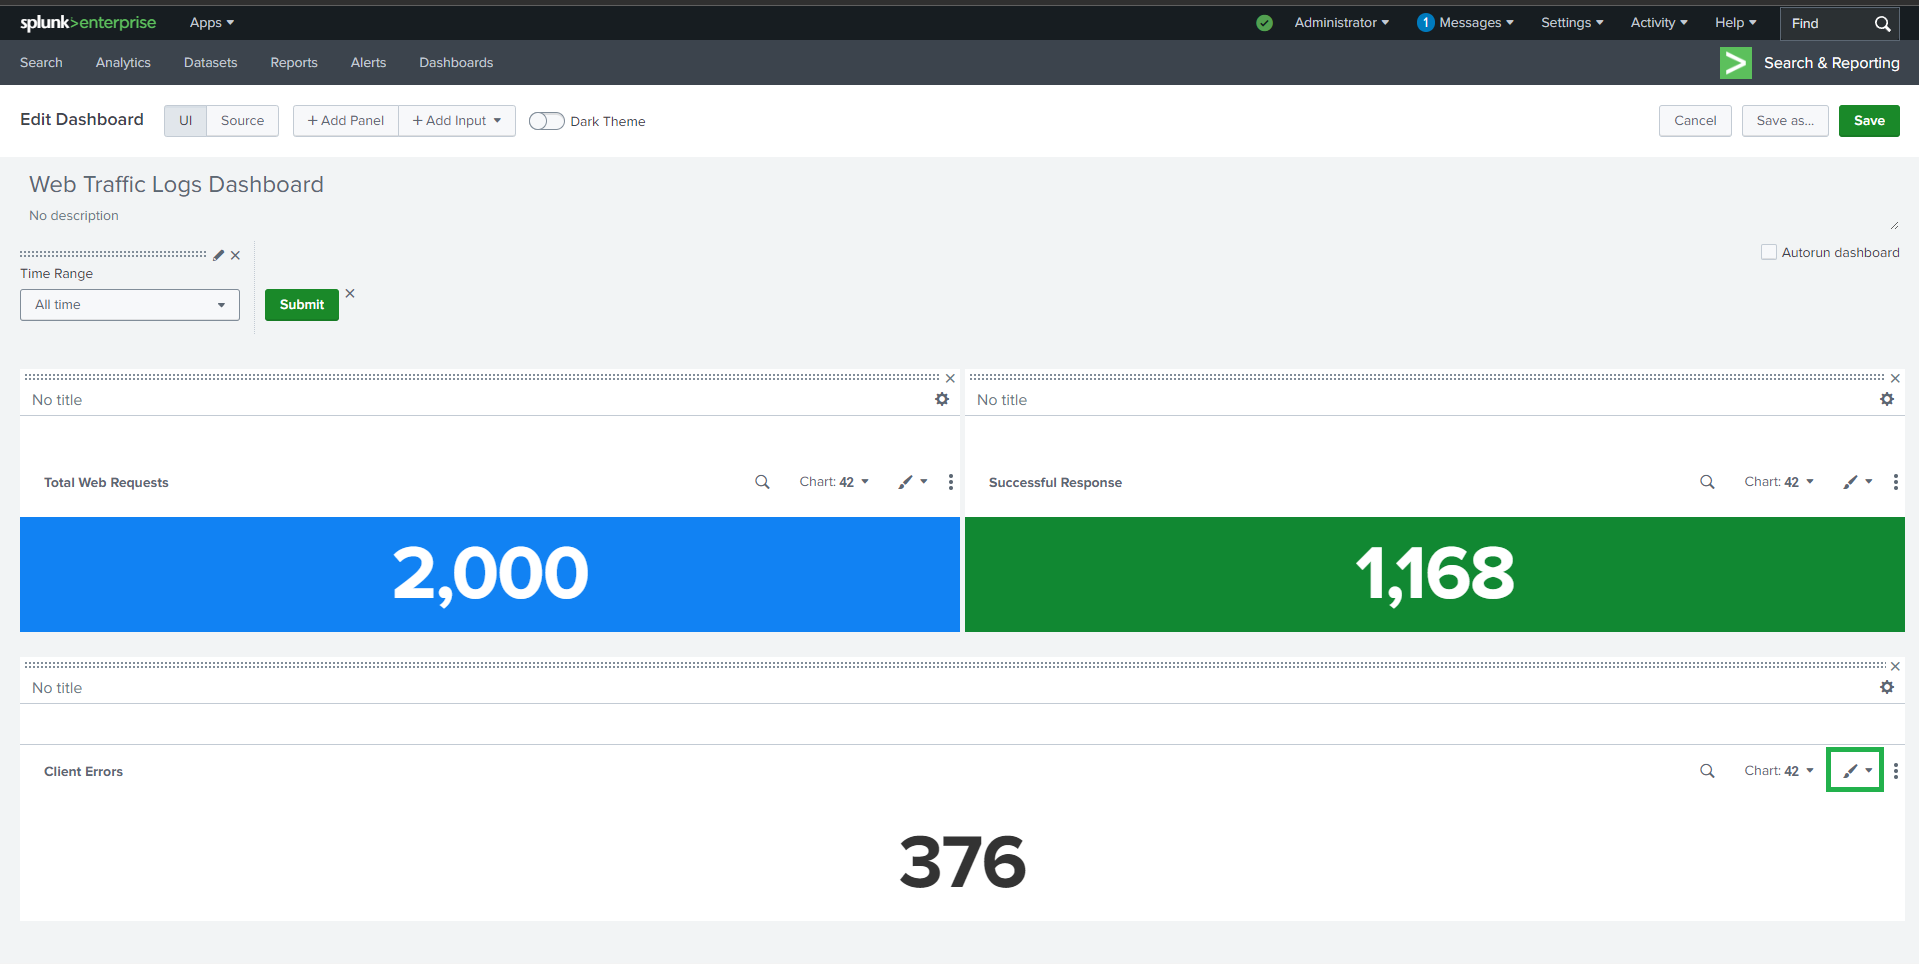
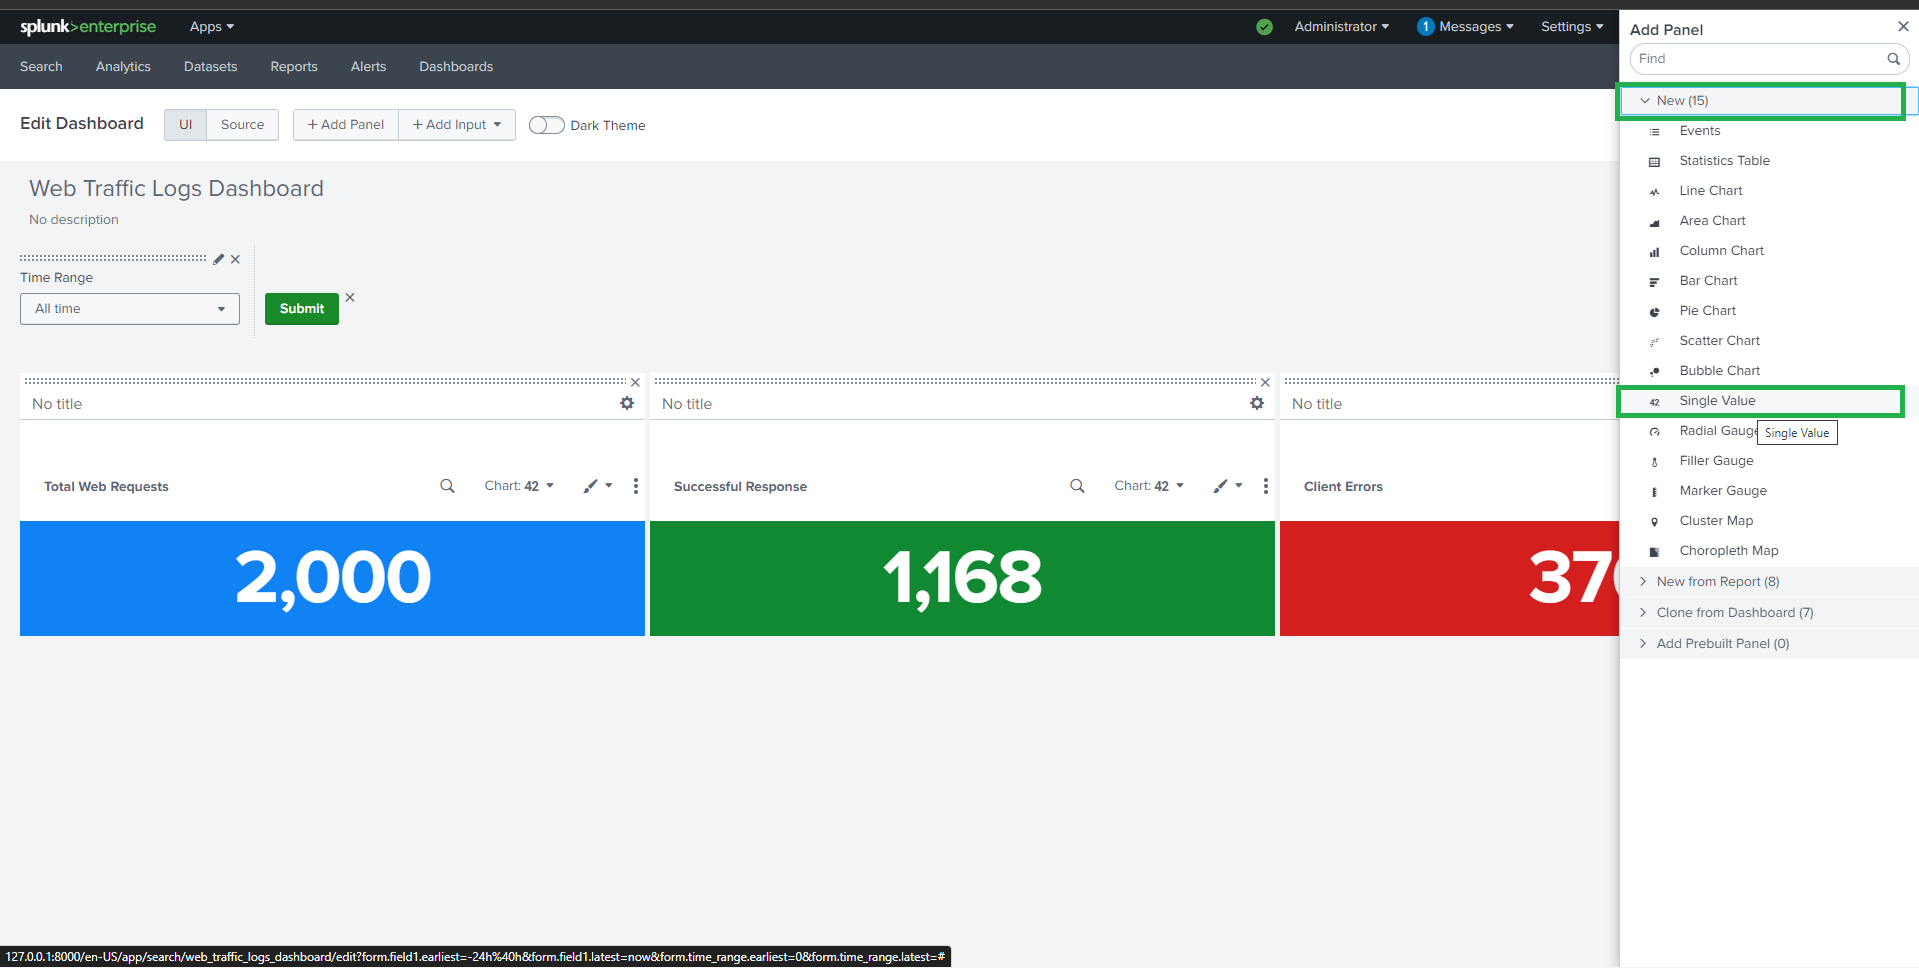
### 🔹 总 Web 请求数
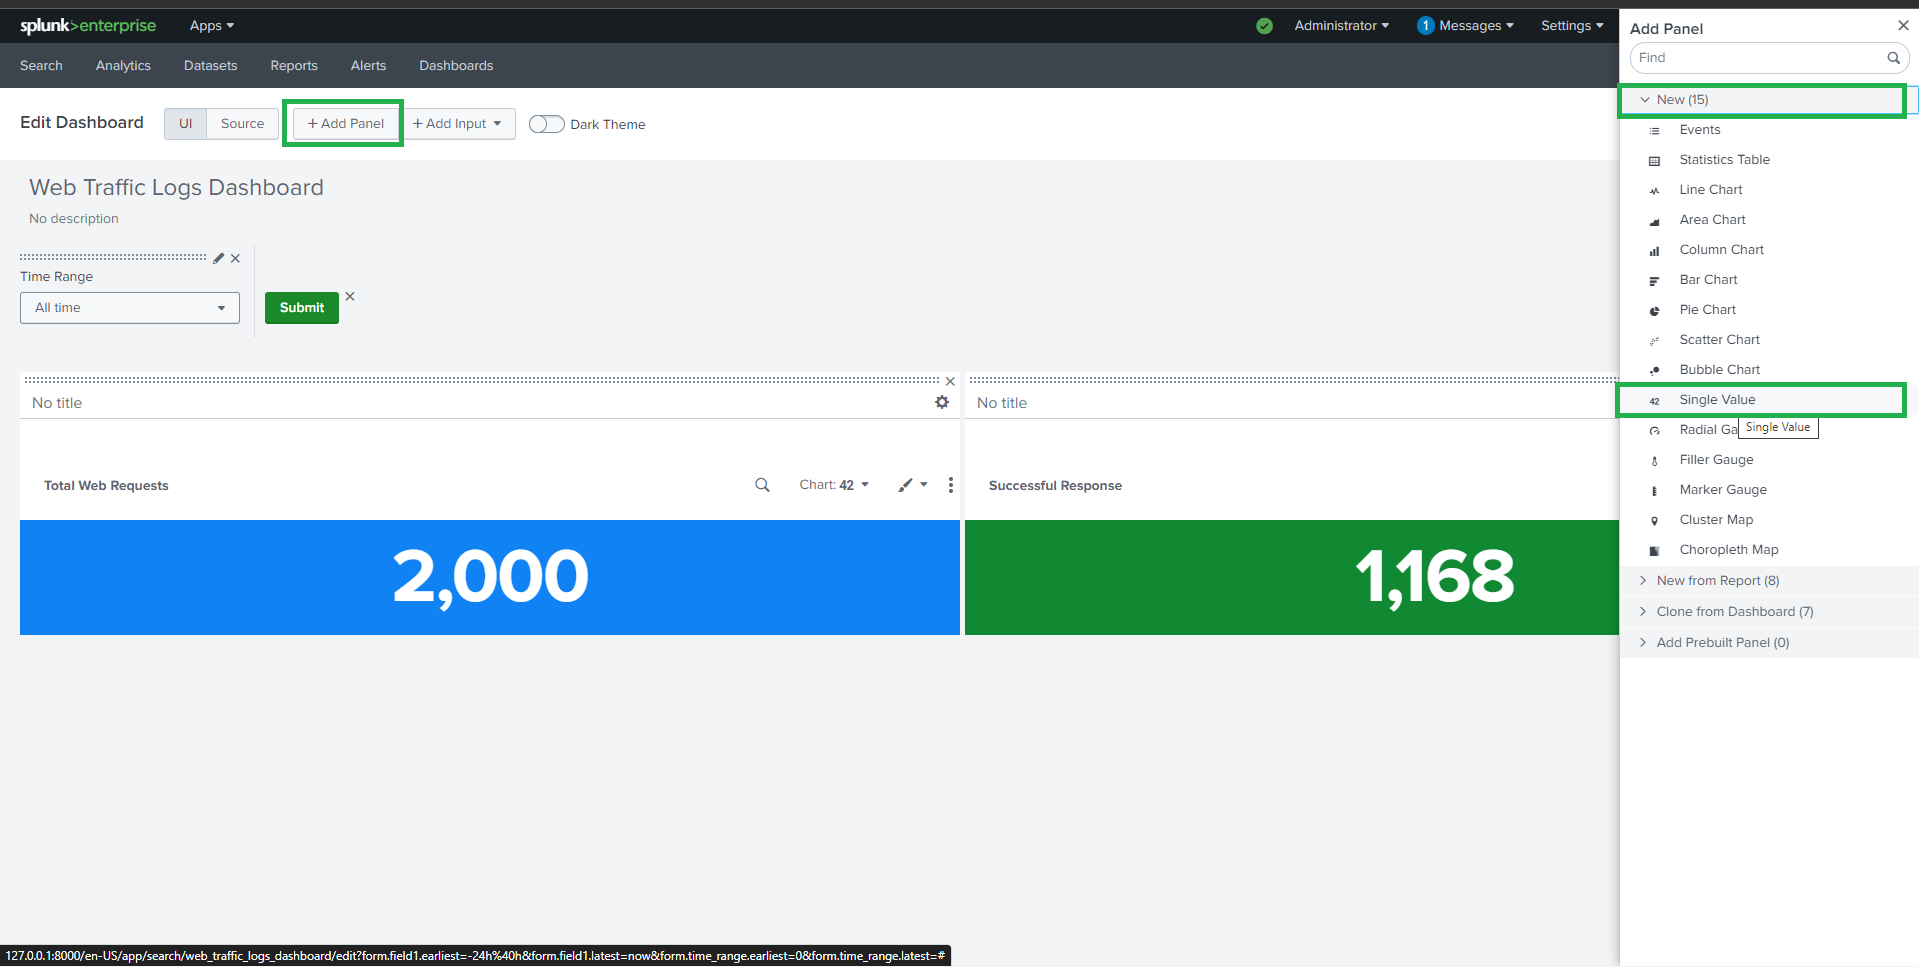
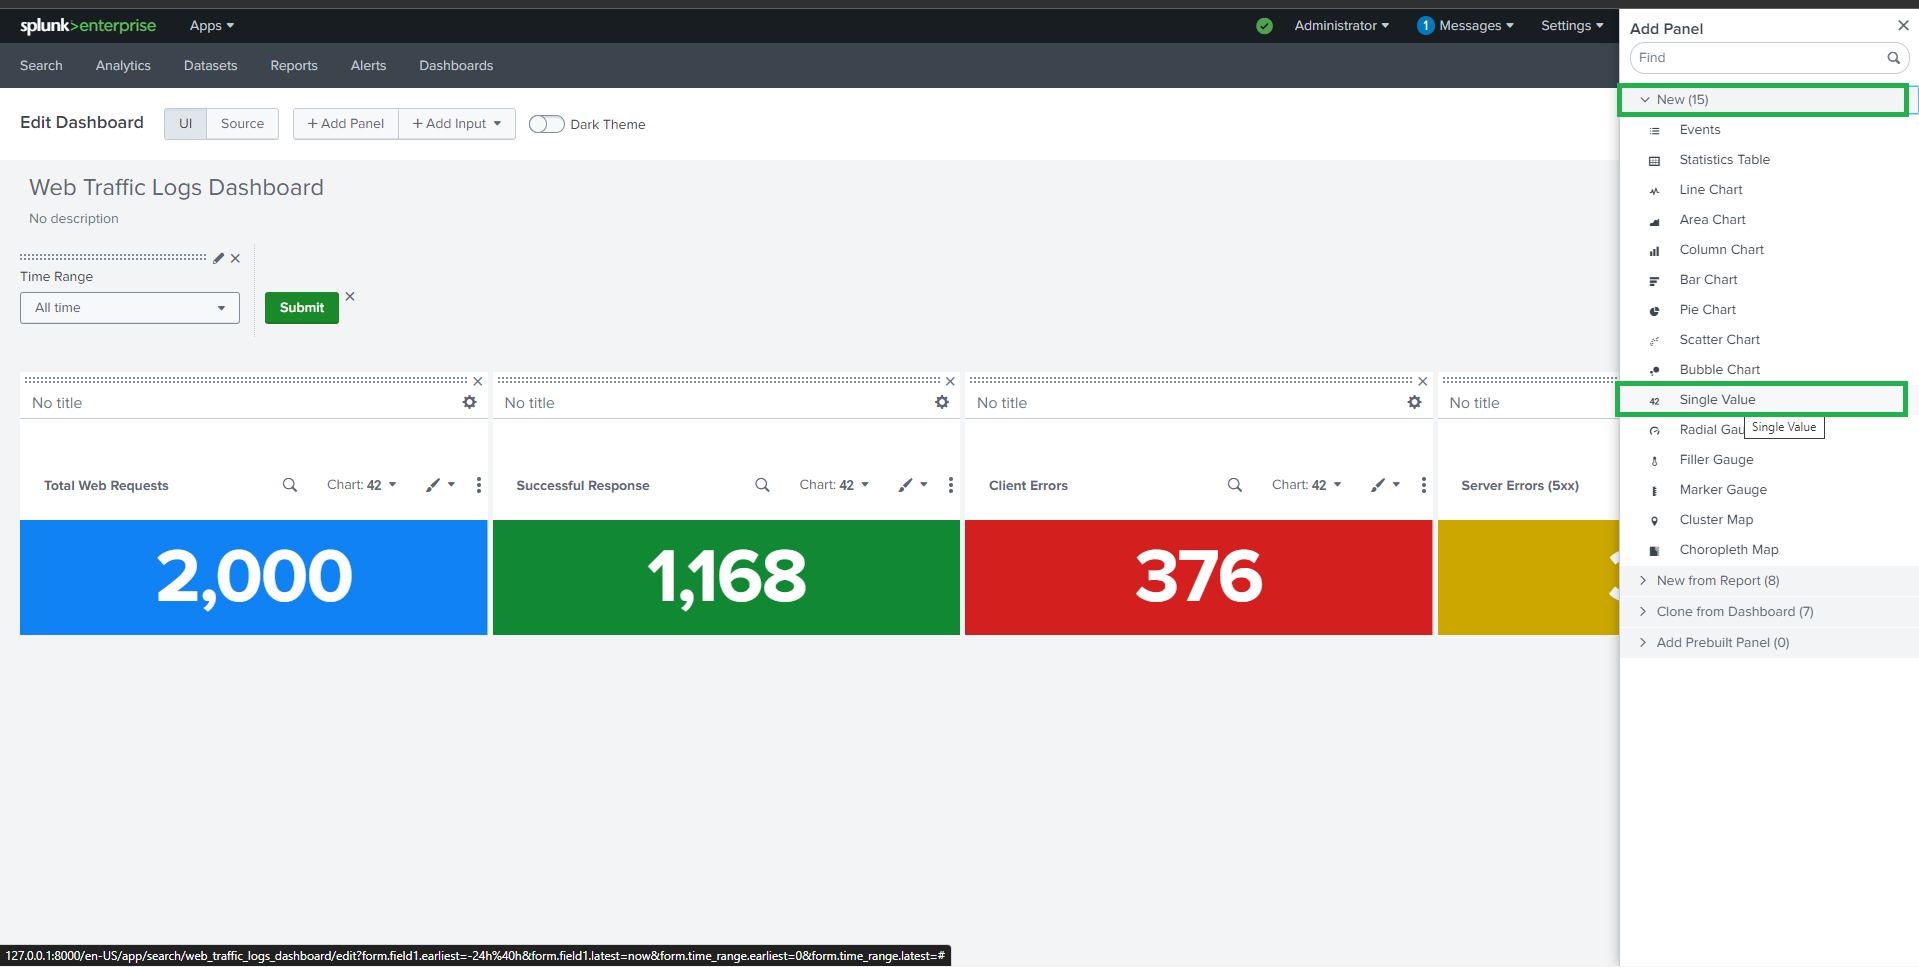
**Visualization**: Single Value
```spl
source="apache_logs.json" host="webserver" sourcetype="_json"
#### | stats count AS "Total Web Requests"
## 📈 任务 1:Web 活动
### 🔹 总 Web 请求数
**Visualization**: Single Value
```spl
source="apache_logs.json" host="webserver" sourcetype="_json"
#### | stats count AS "Total Web Requests"
 ##
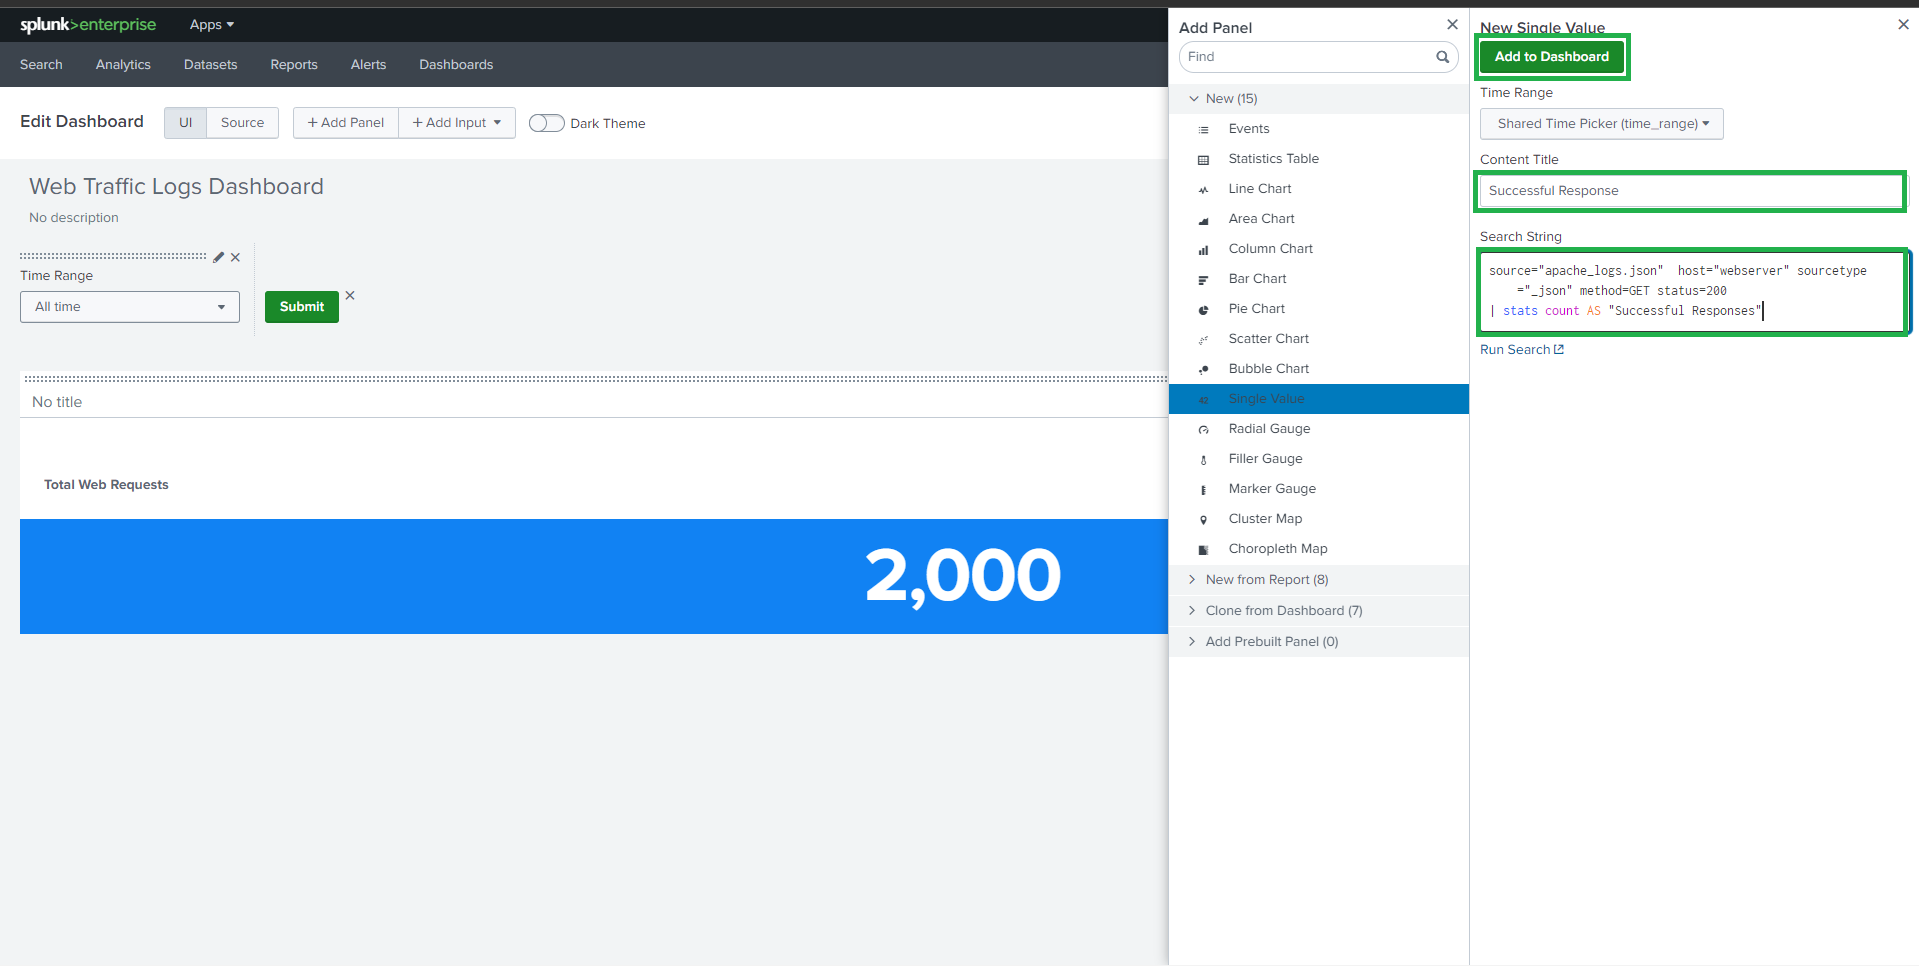
##  ### 🔹 成功响应 (200 OK)
**Visualization**: Single Value
```spl
source="apache_mixed_logs.json" host="webserver" sourcetype="_json" method=GET status=200
#### | stats count AS "Successful Responses"
### 🔹 成功响应 (200 OK)
**Visualization**: Single Value
```spl
source="apache_mixed_logs.json" host="webserver" sourcetype="_json" method=GET status=200
#### | stats count AS "Successful Responses"
 ##
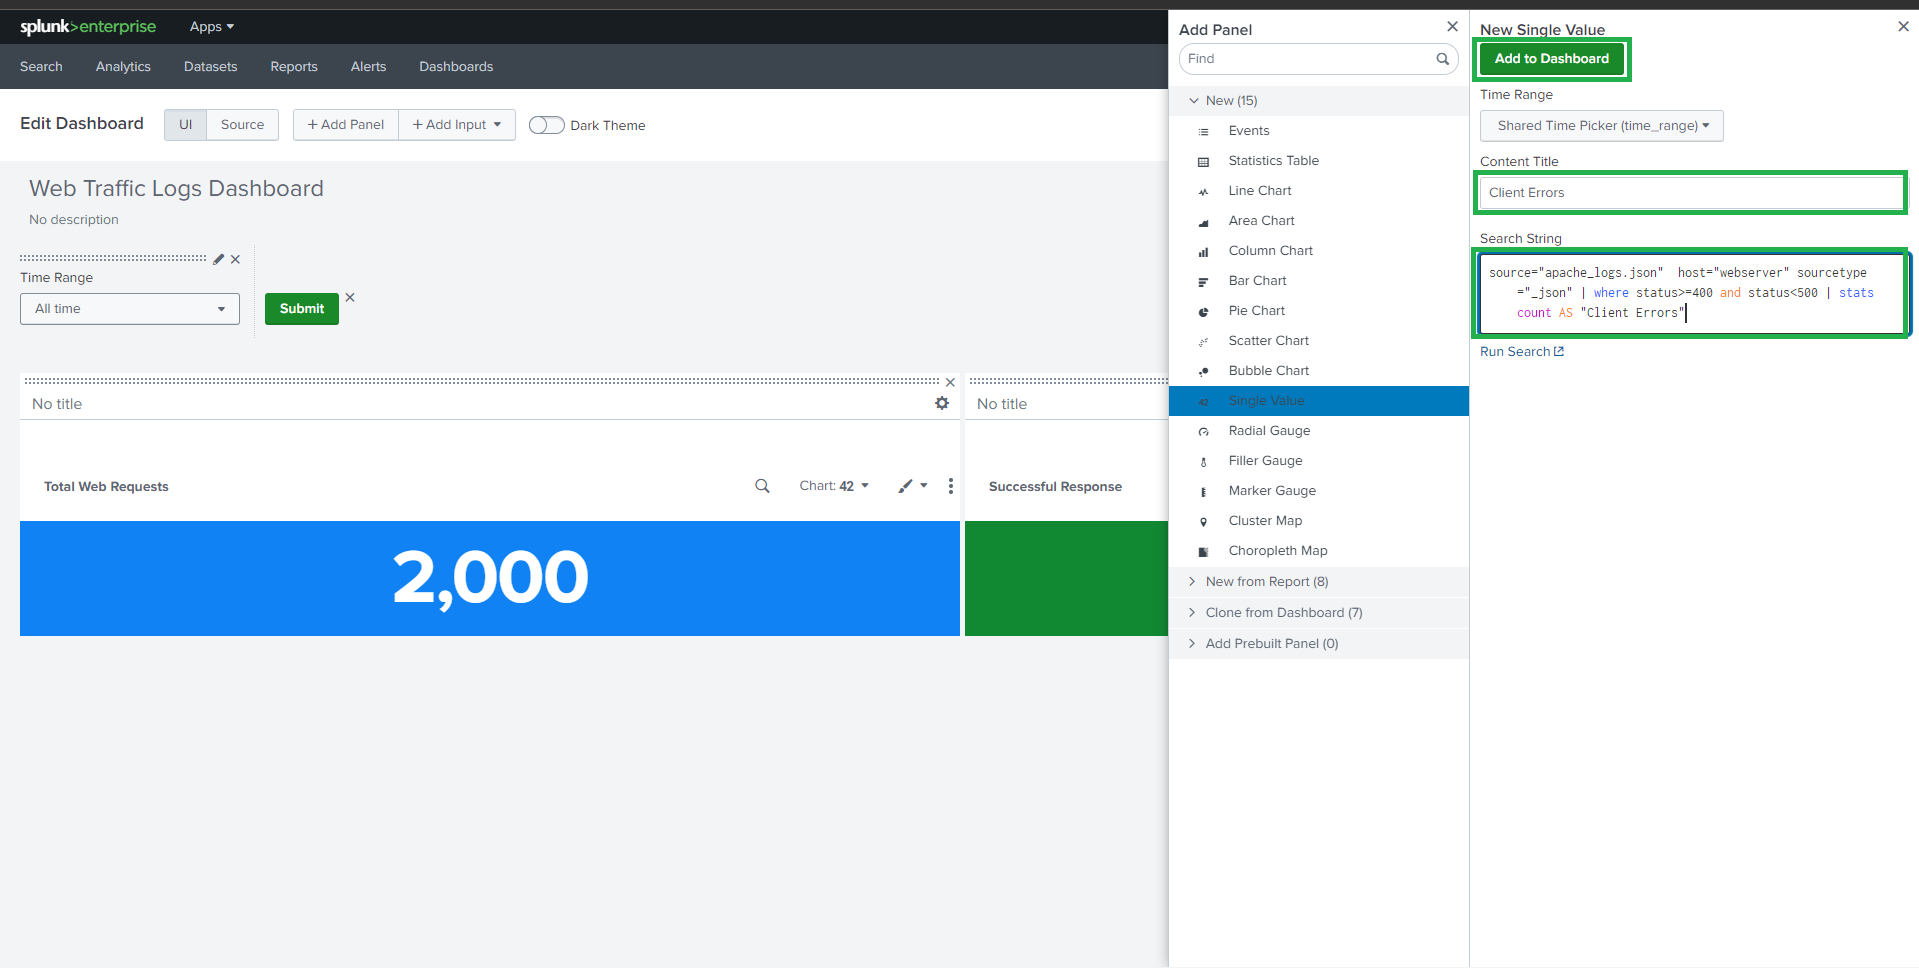
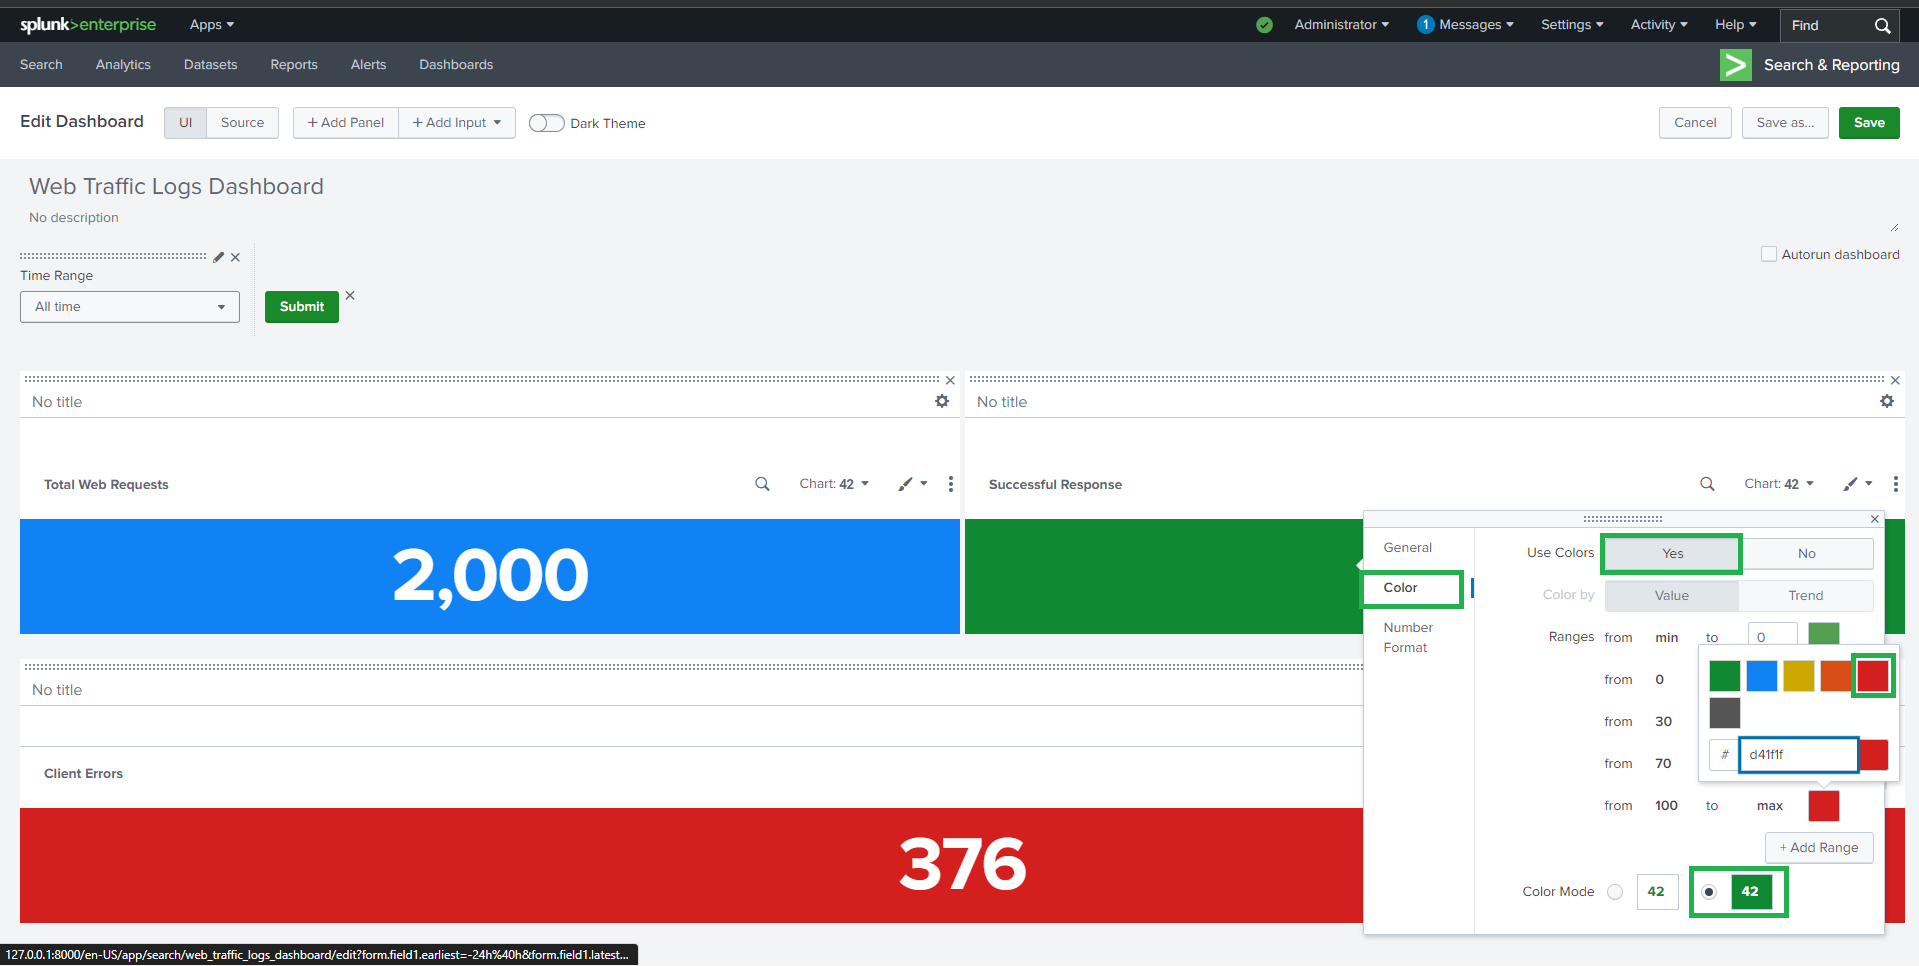
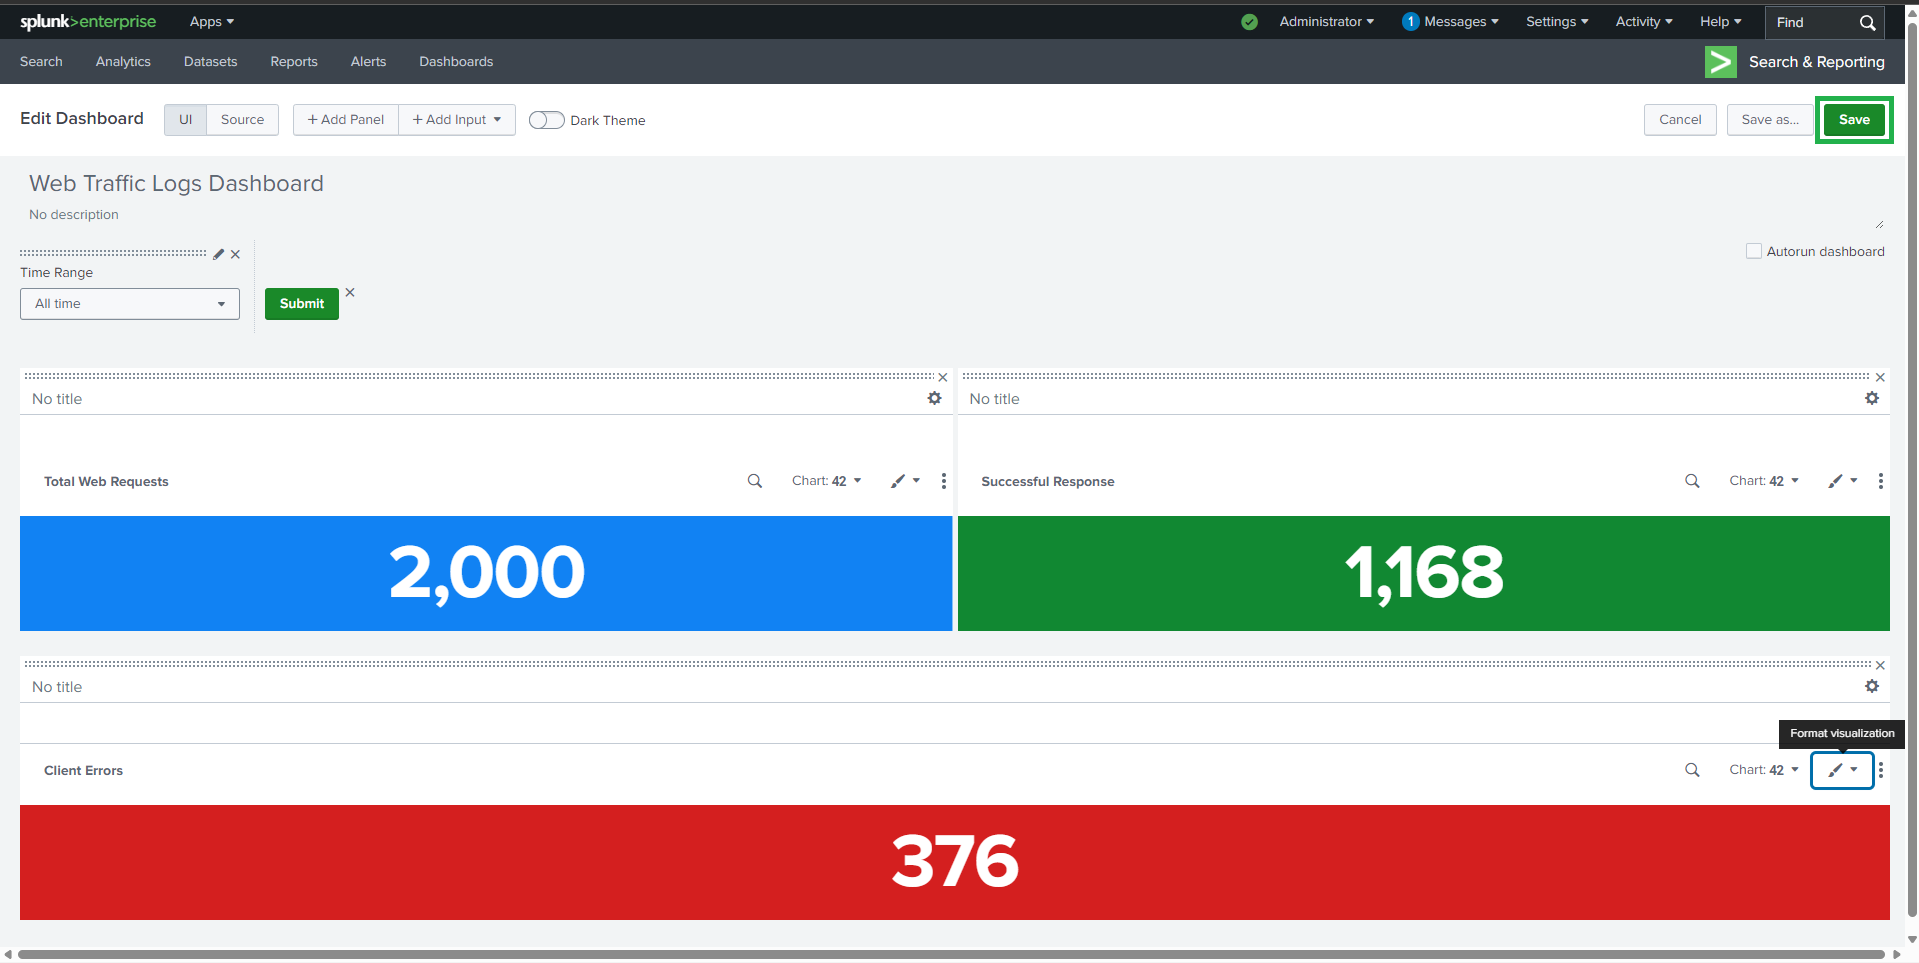
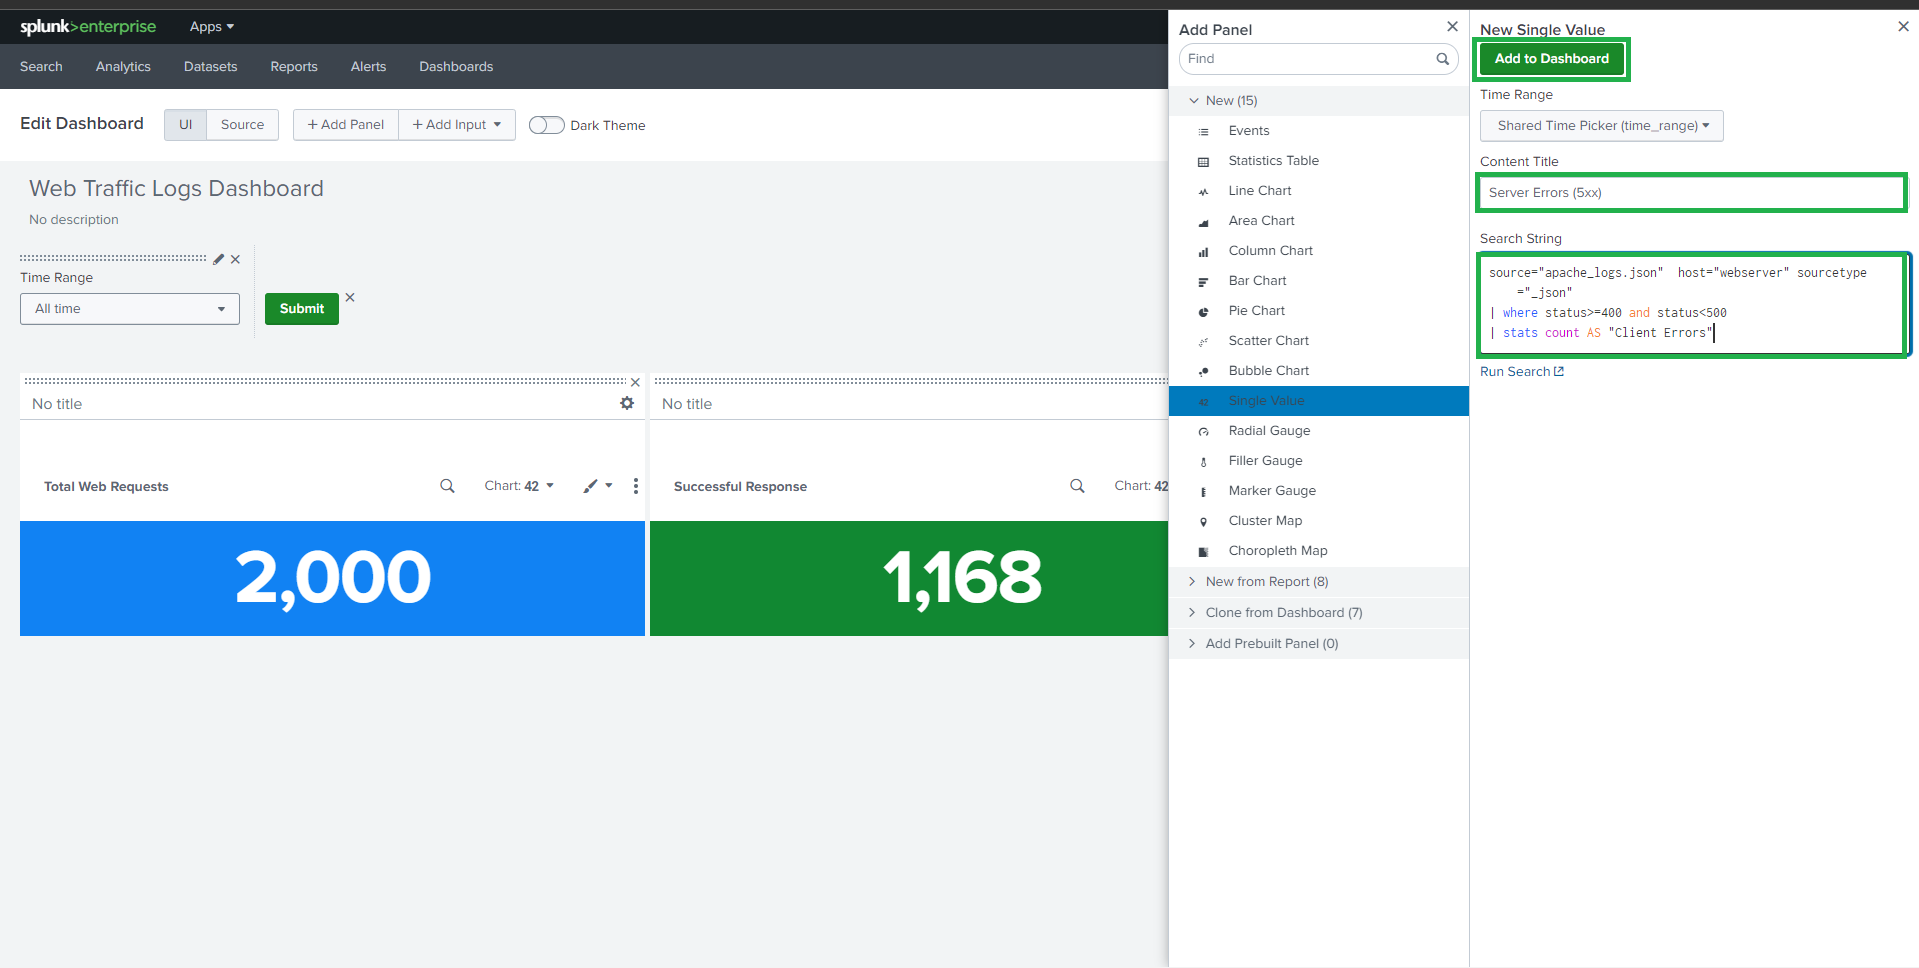
##  ### 🔹 客户端错误 (4xx)
**Visualization**: Single Value
```spl
source="apache_mixed_access_full (1).json" host="webserver" sourcetype="_json"
| where status>=400 AND status<500
#### | stats count AS "Client Errors"
### 🔹 客户端错误 (4xx)
**Visualization**: Single Value
```spl
source="apache_mixed_access_full (1).json" host="webserver" sourcetype="_json"
| where status>=400 AND status<500
#### | stats count AS "Client Errors"
 ##
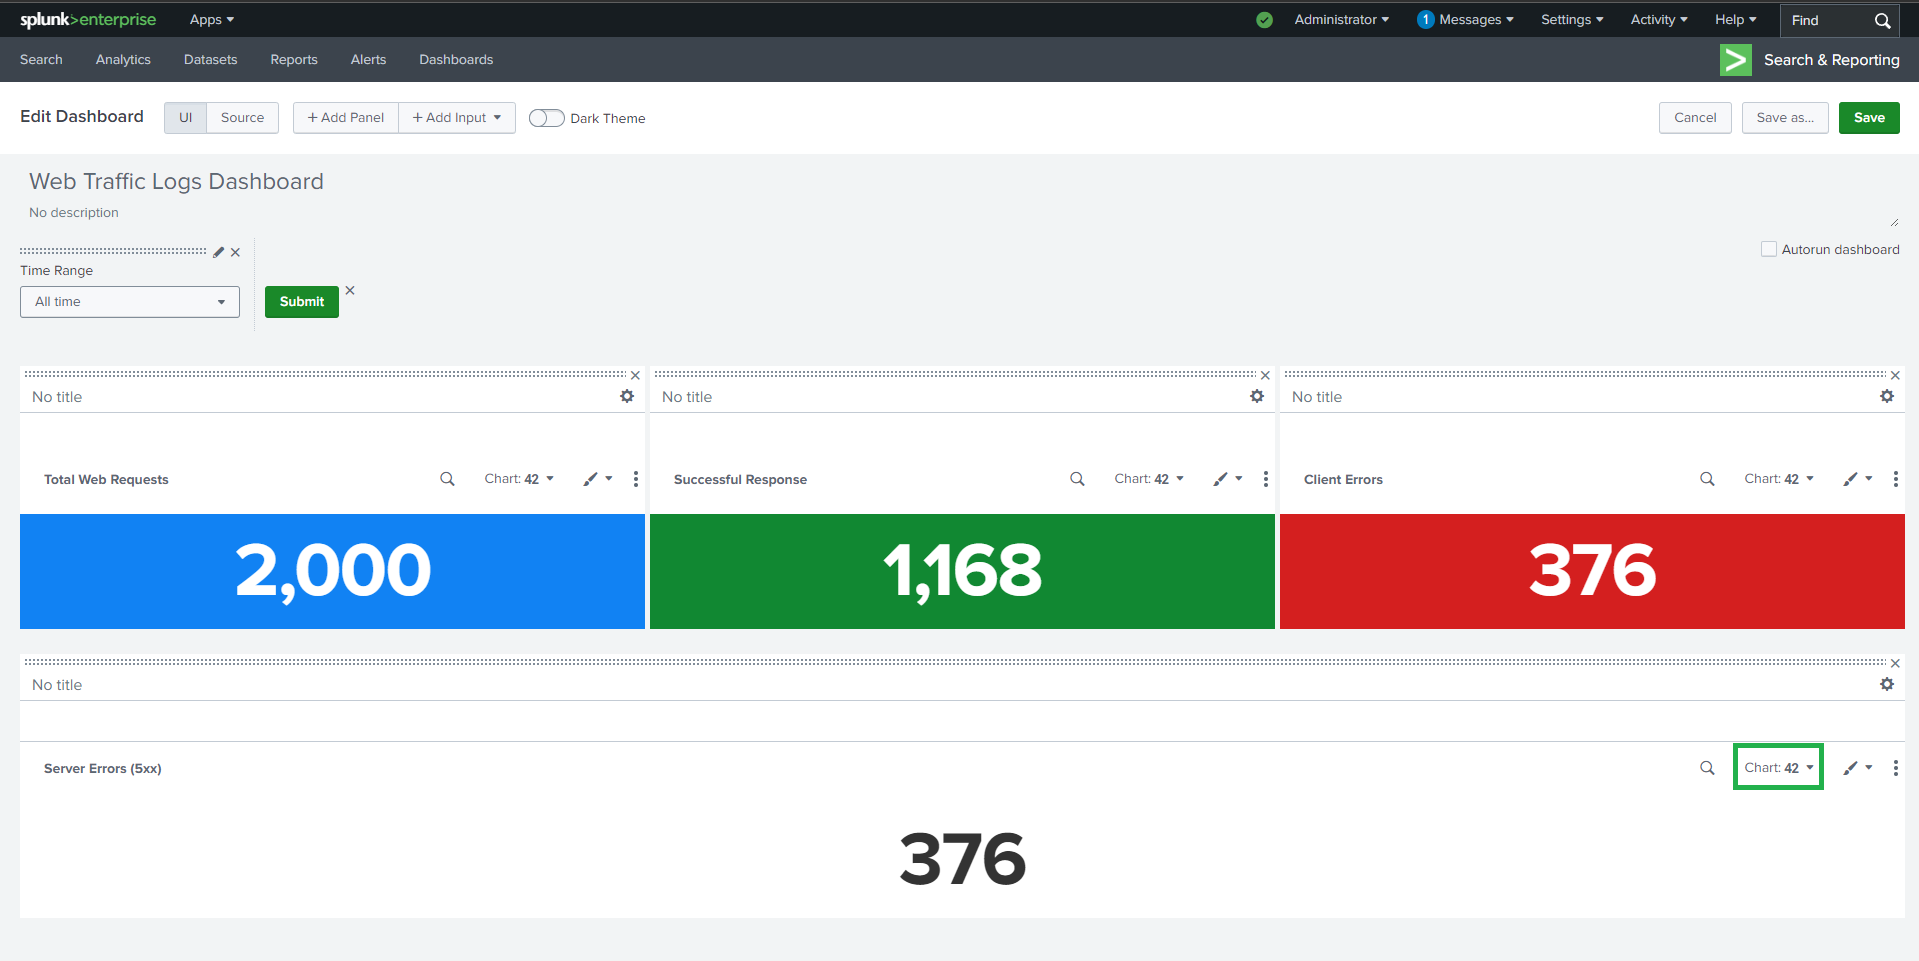
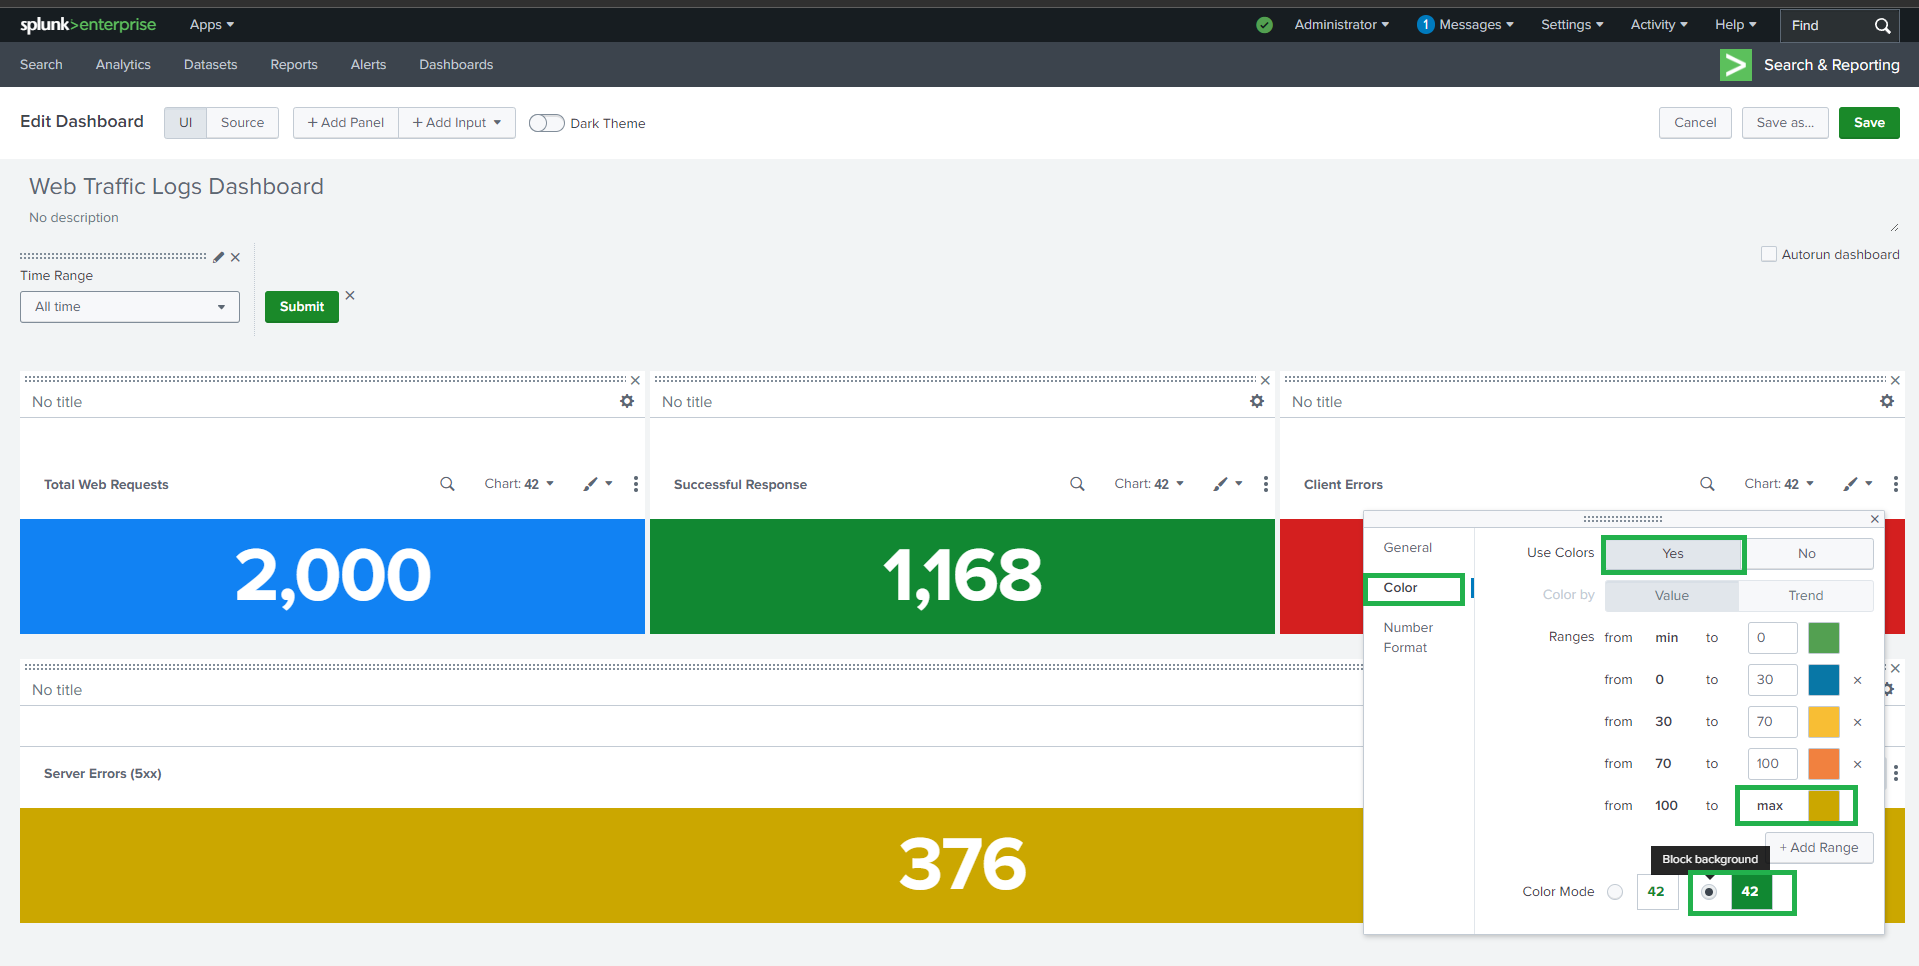
##  ### 🔹 服务器错误 (5xx)
**Visualization**: Single Value
```spl
source="apache_logs.json" host="webserver" sourcetype="_json"
| where status>=500 AND status<600
#### | stats count AS "Server Errors"
### 🔹 服务器错误 (5xx)
**Visualization**: Single Value
```spl
source="apache_logs.json" host="webserver" sourcetype="_json"
| where status>=500 AND status<600
#### | stats count AS "Server Errors"
 ##
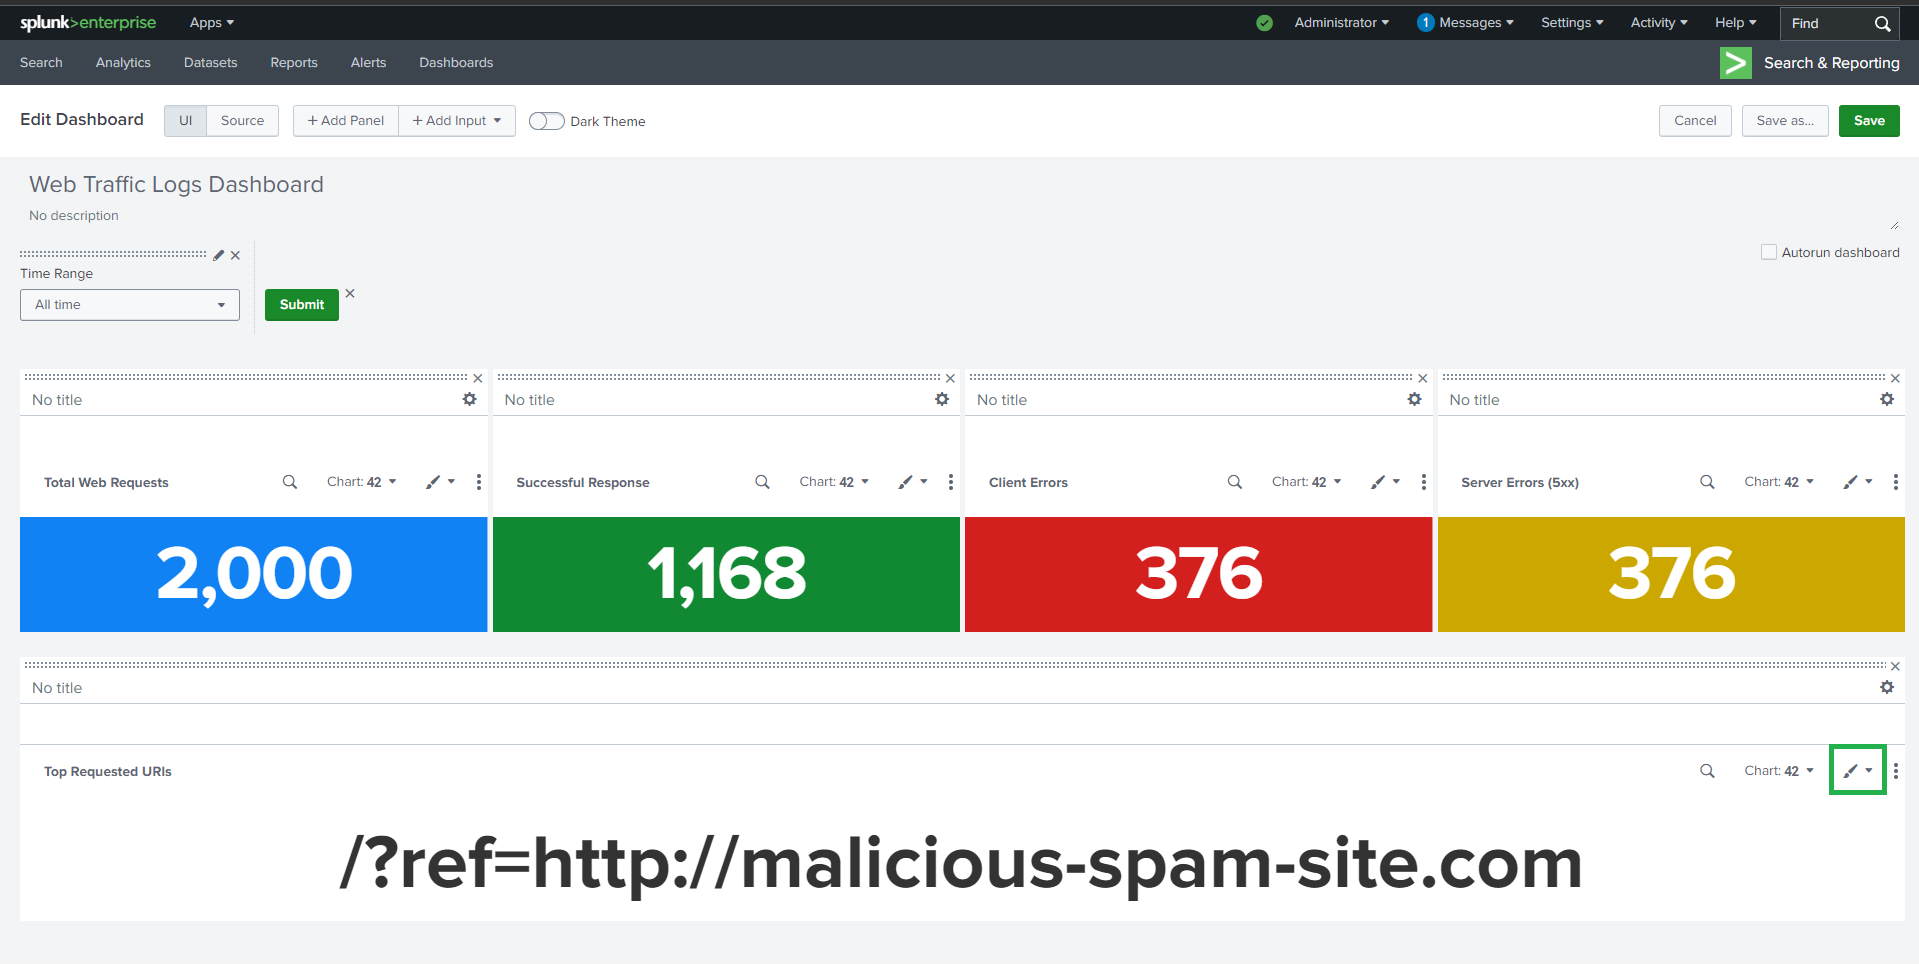
##  ## 📊 任务 2:Web 统计
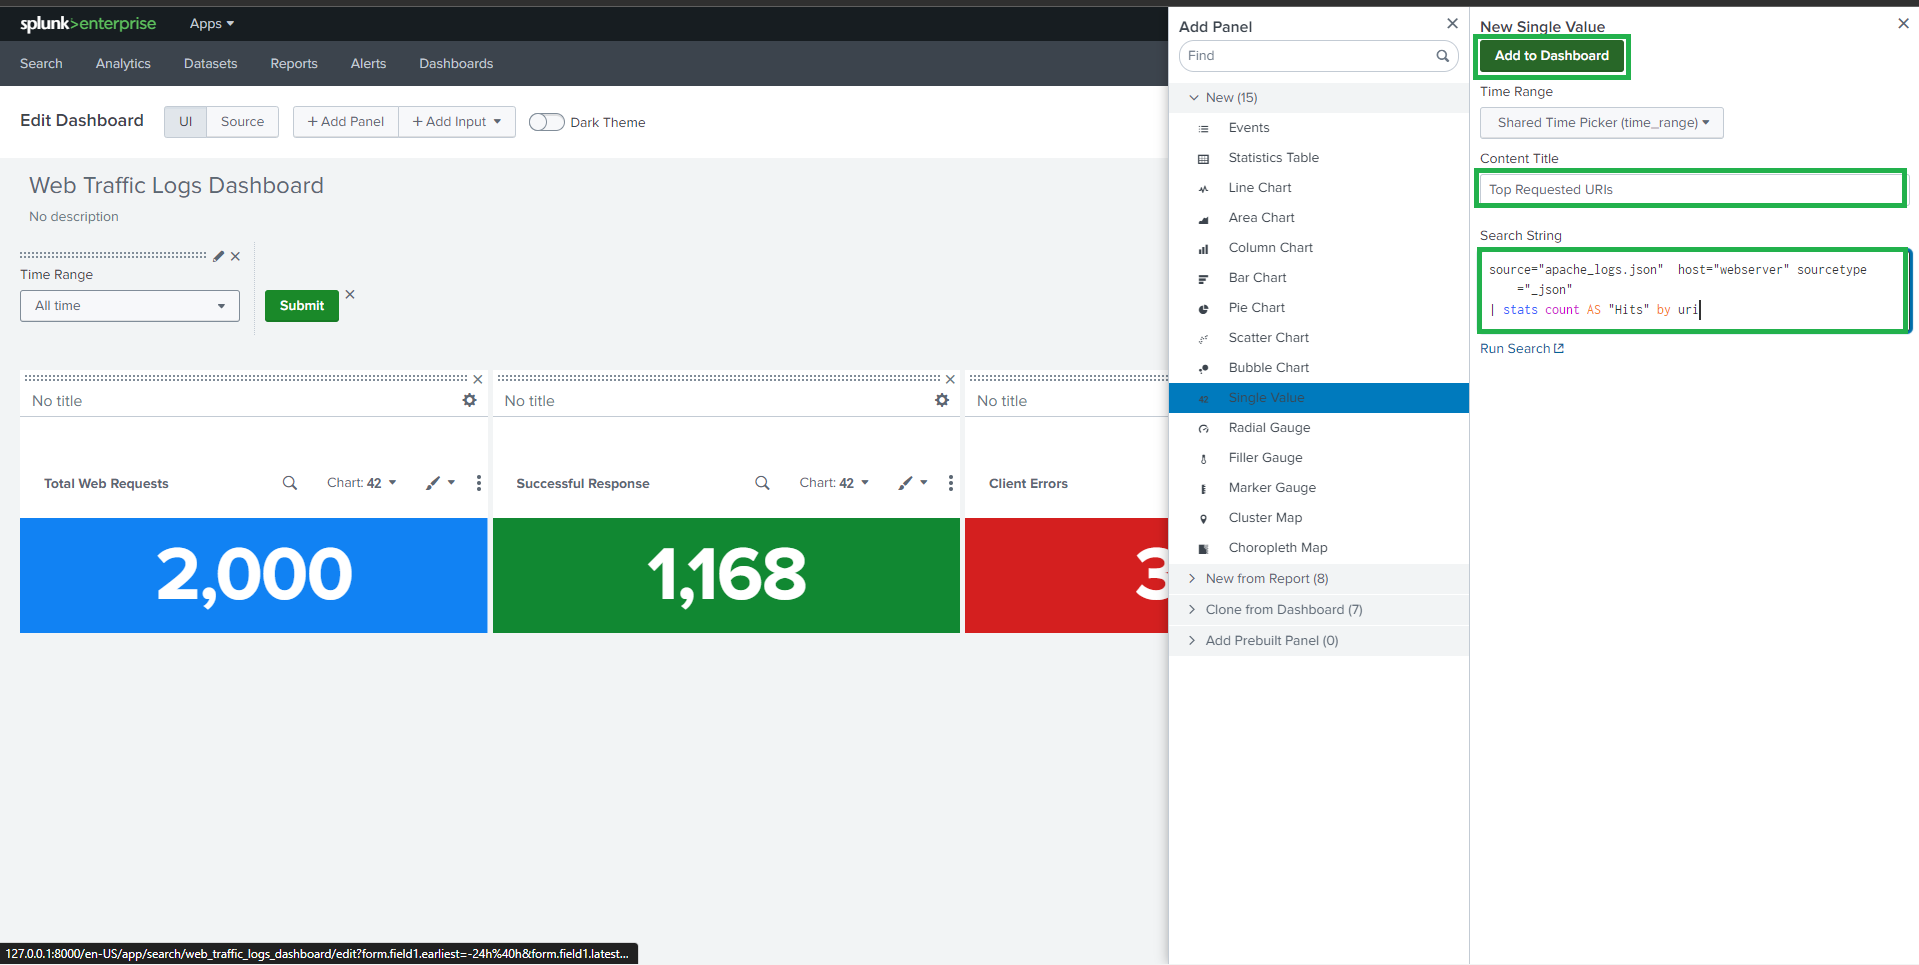
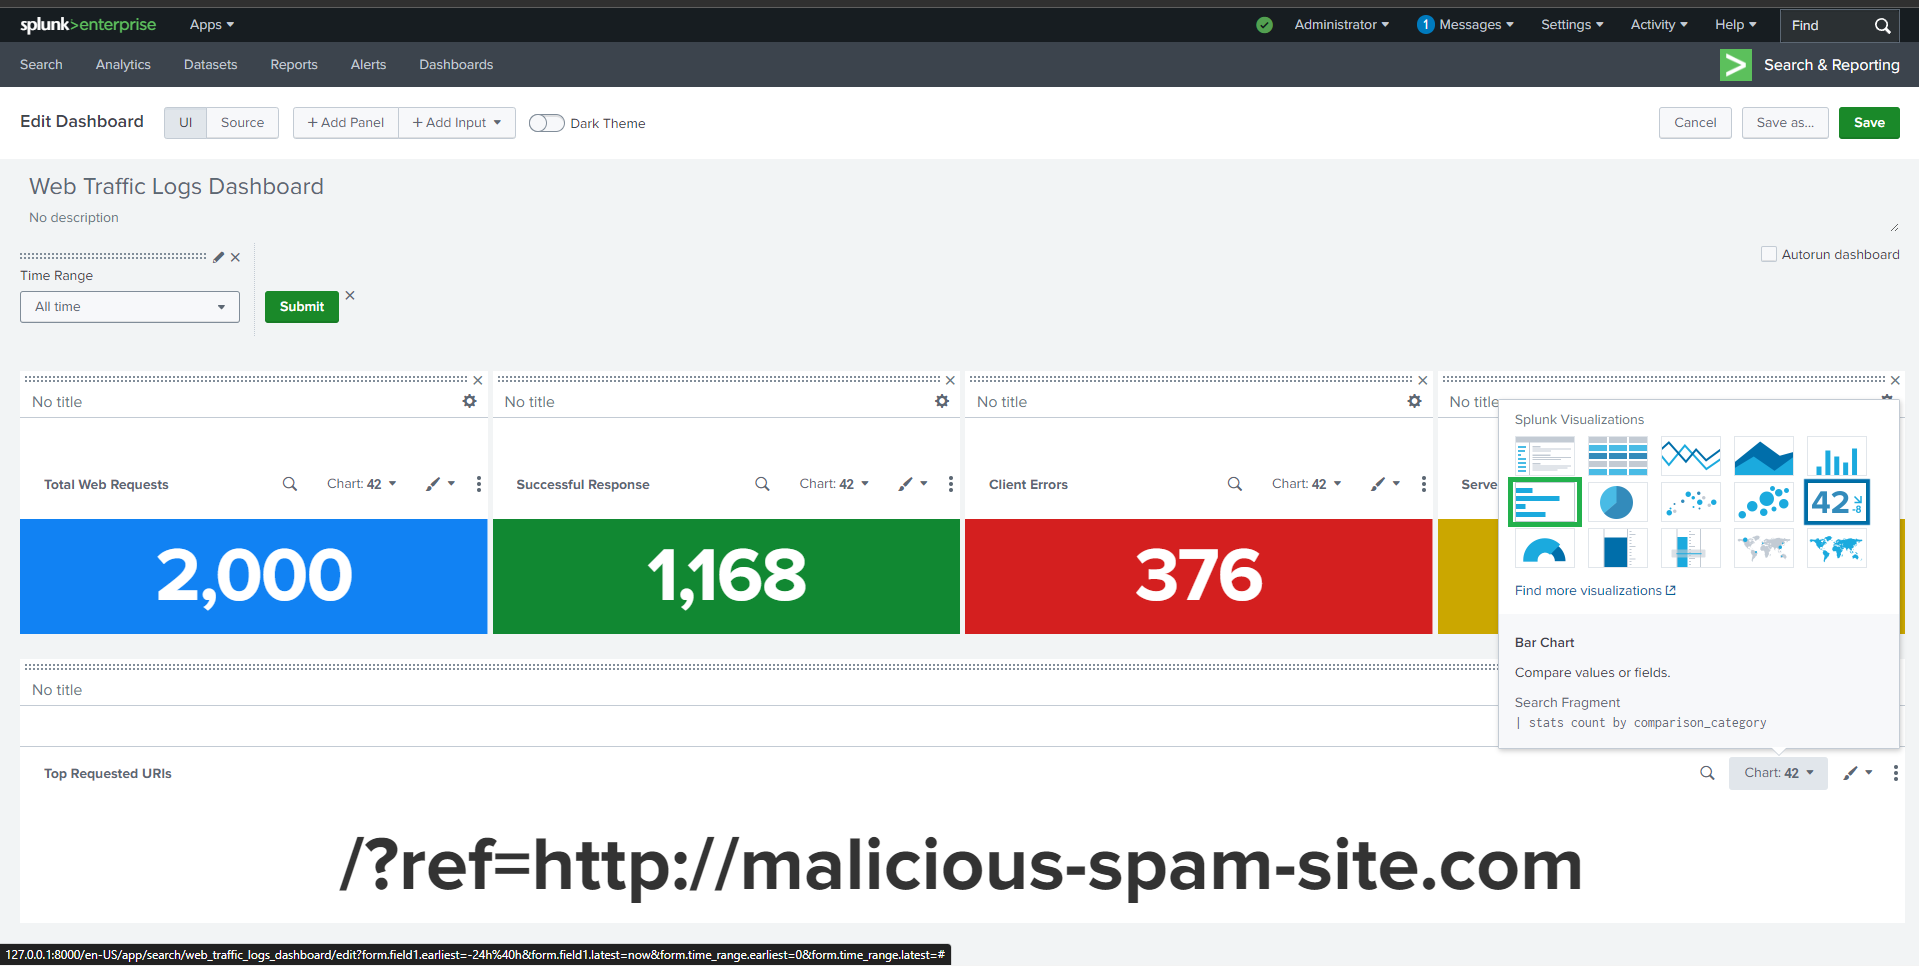
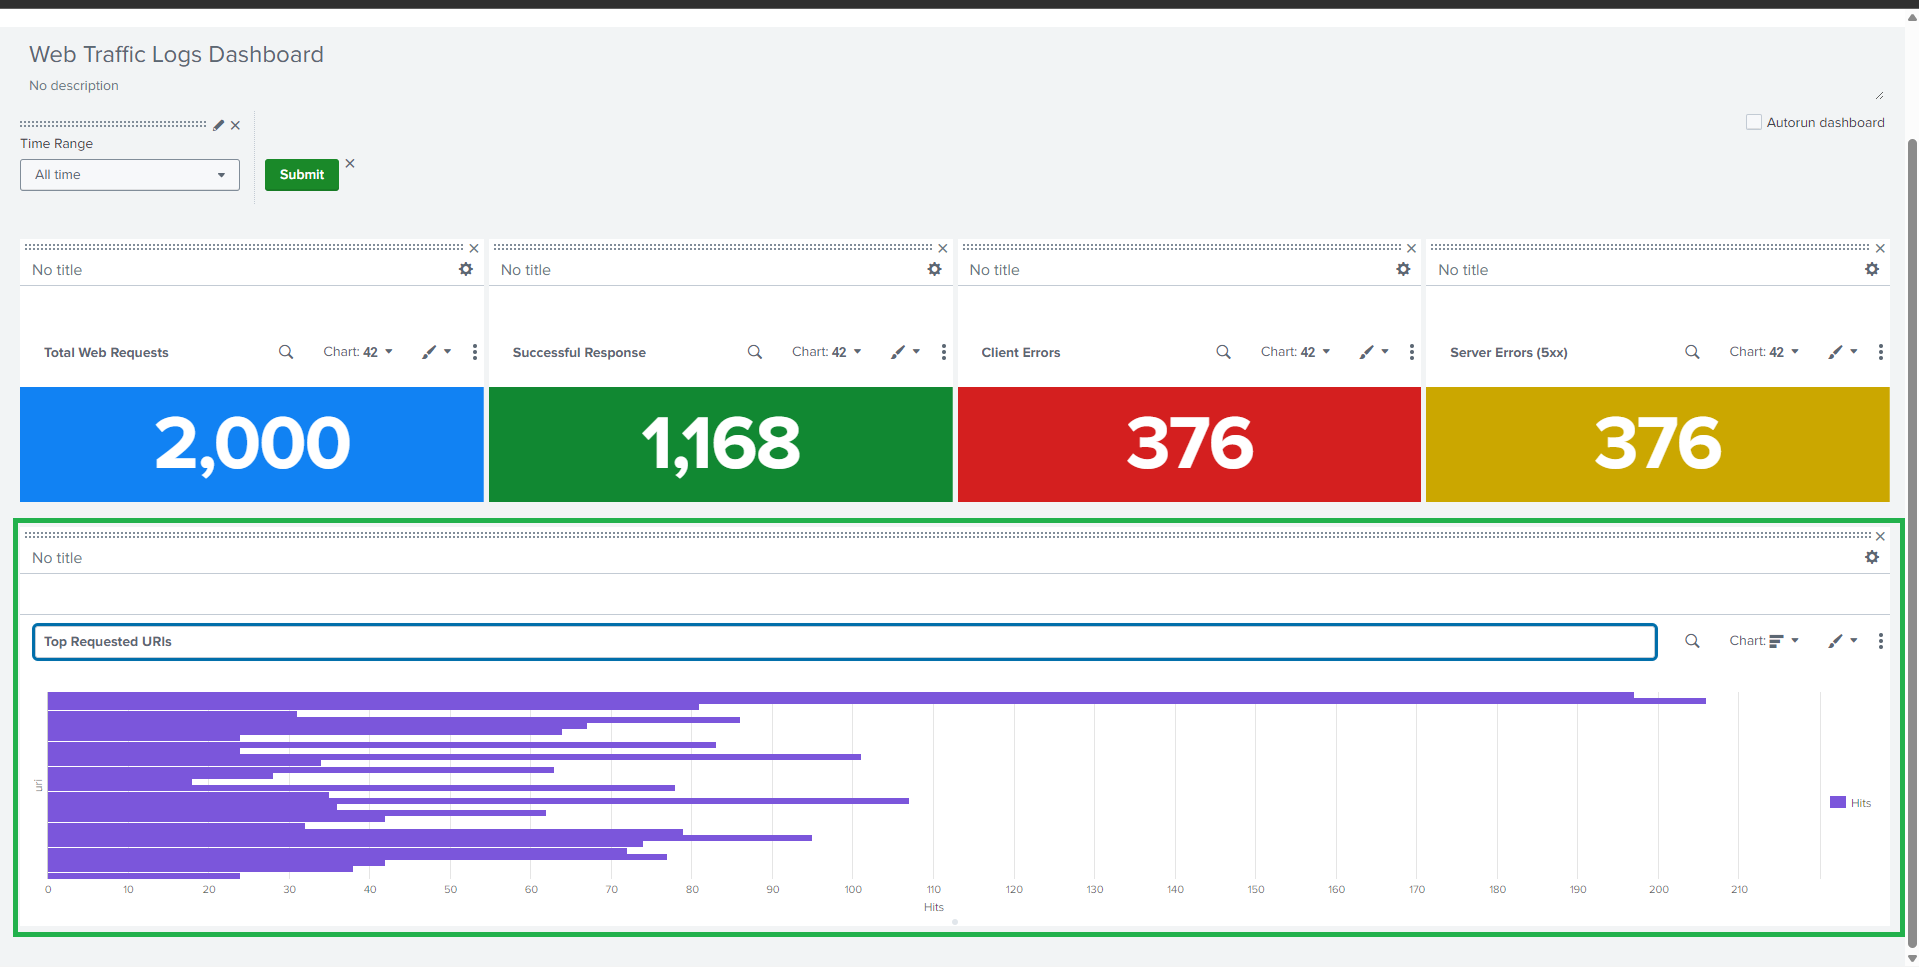
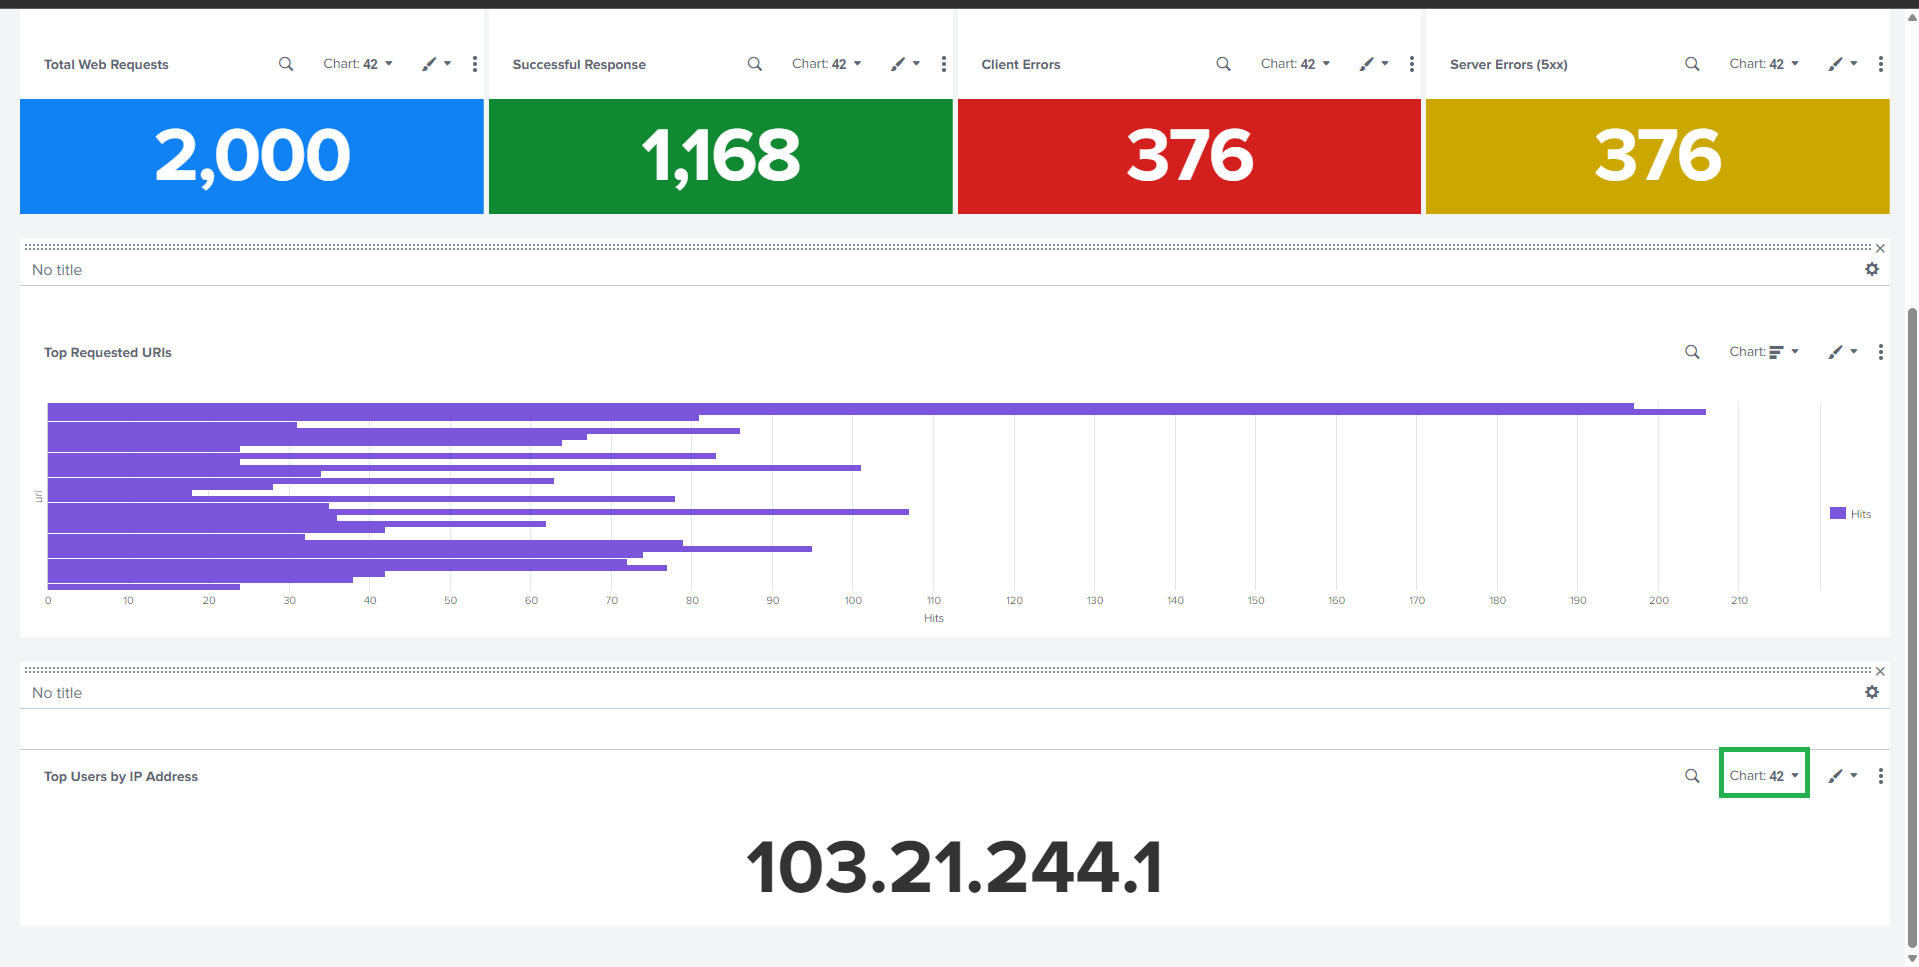
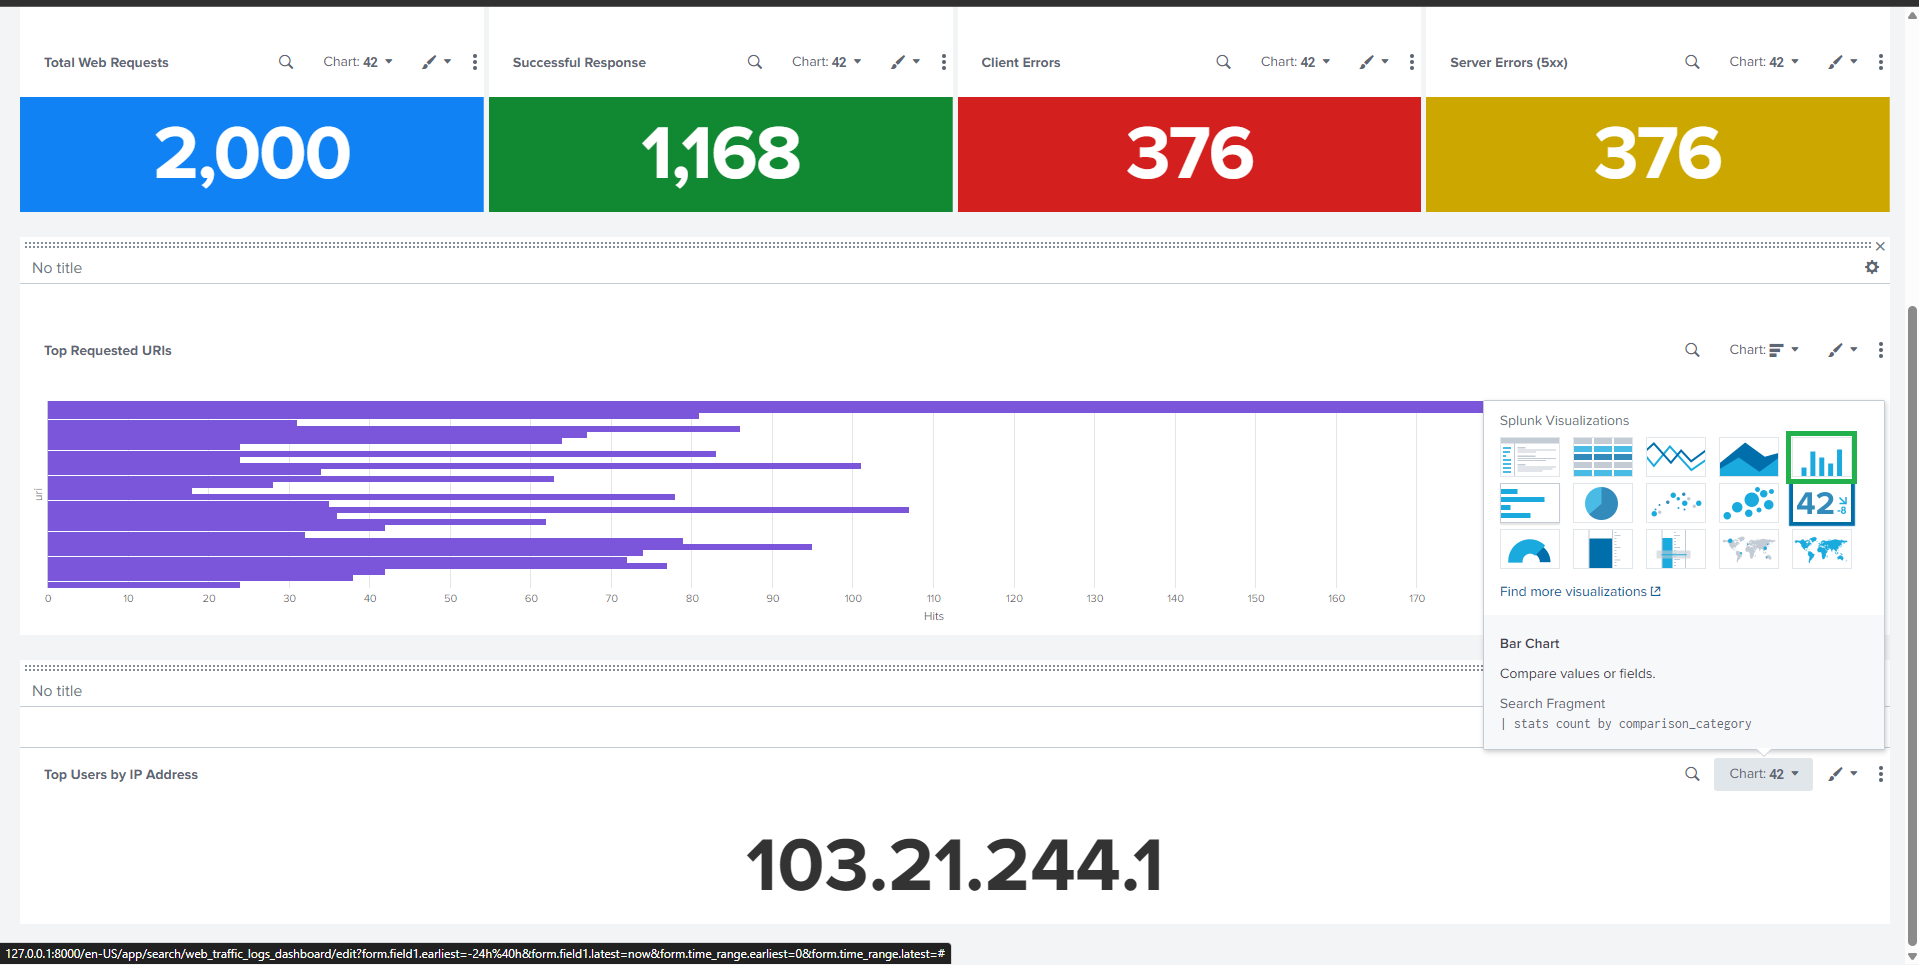
### 🔹 请求最多的 URI
**Visualization**: Bar Chart
```spl
source="apache_logs.json" host="webserver" sourcetype="_json"
| stats count AS Hits by uri
#### | sort - Hits
## 📊 任务 2:Web 统计
### 🔹 请求最多的 URI
**Visualization**: Bar Chart
```spl
source="apache_logs.json" host="webserver" sourcetype="_json"
| stats count AS Hits by uri
#### | sort - Hits
 ##
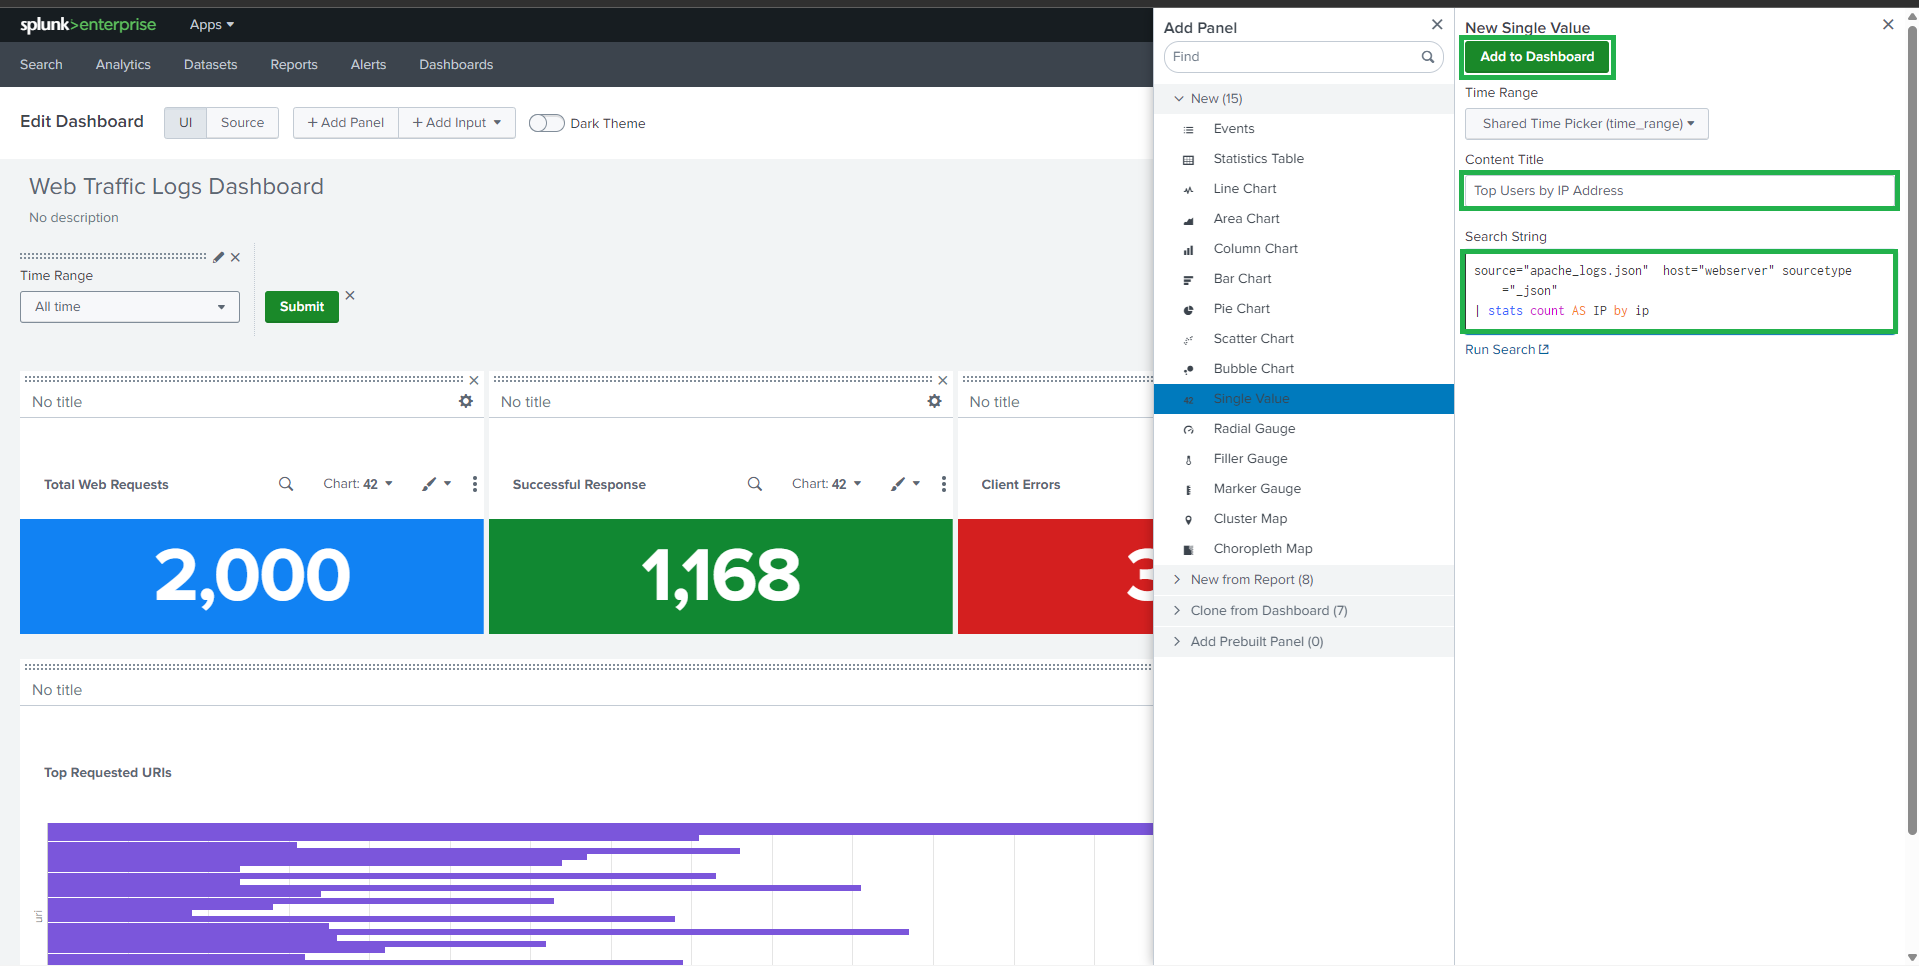
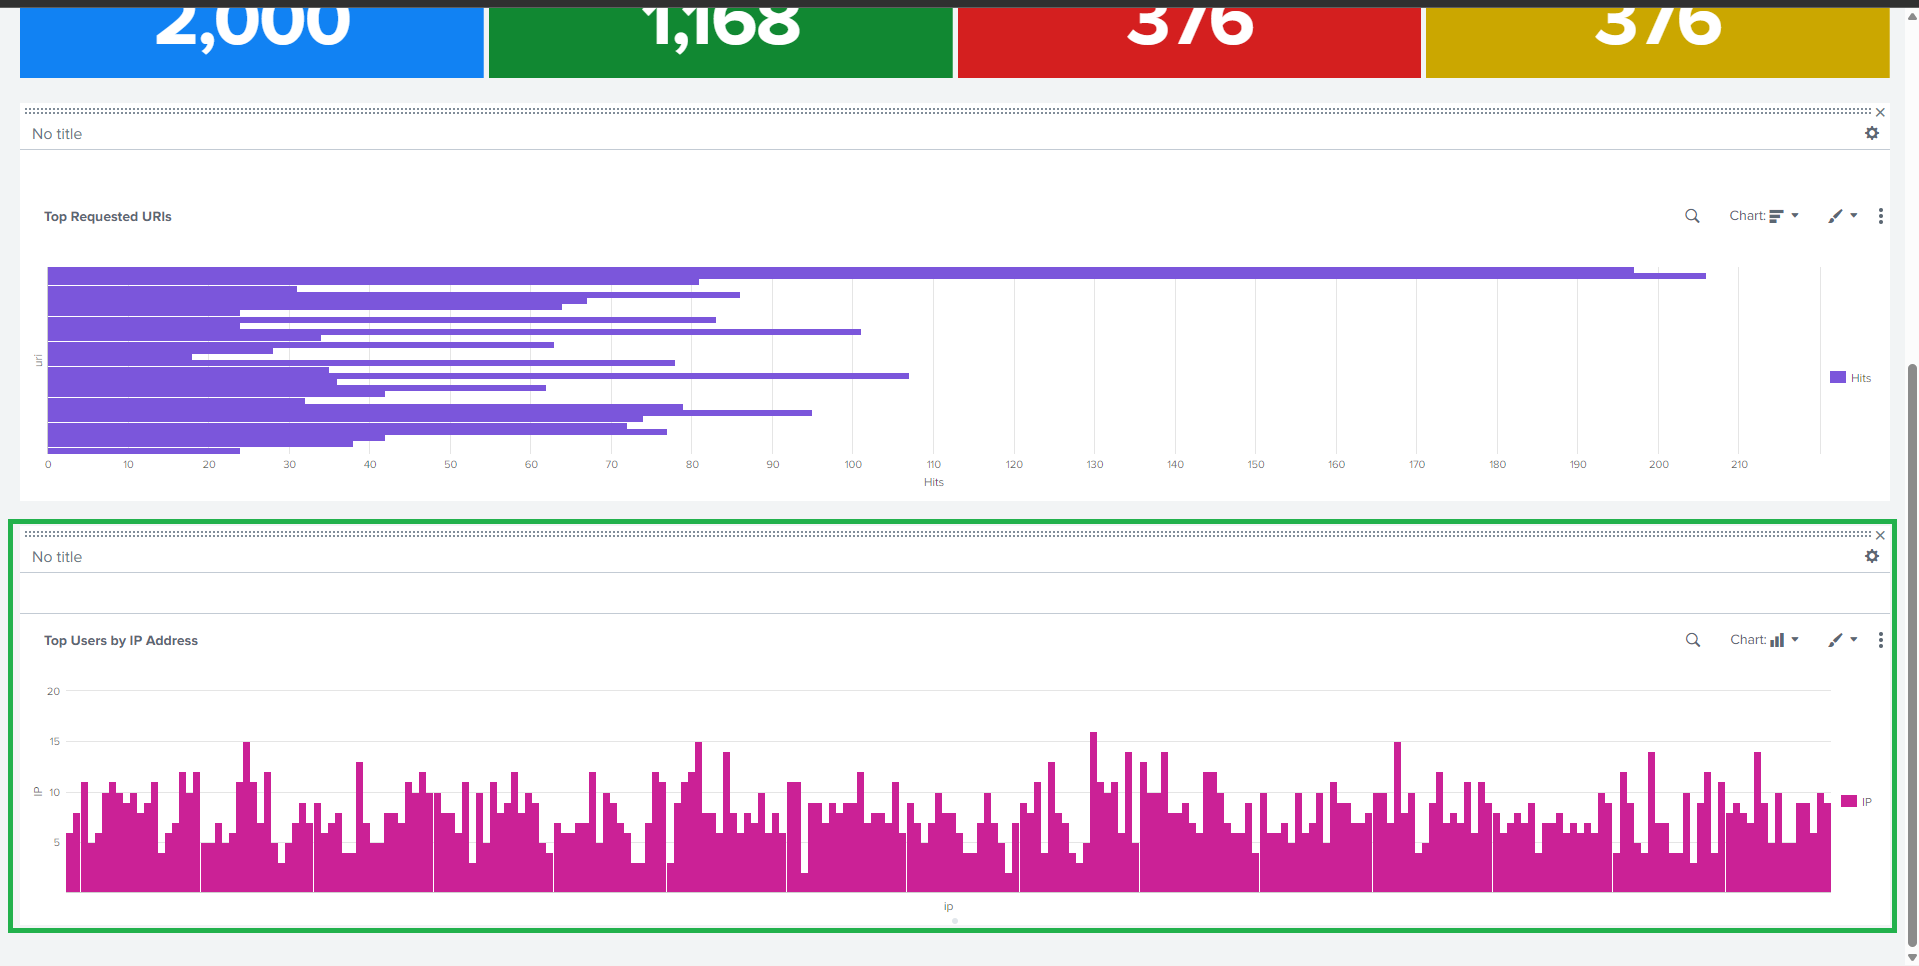
##  ### 🔹 按 IP 地址排名的顶级用户
**Visualization**: Bar Chart
```spl
source="apache_logs.json" host="webserver" sourcetype="_json"
| stats count AS Requests by ip
#### | sort - Requests
### 🔹 按 IP 地址排名的顶级用户
**Visualization**: Bar Chart
```spl
source="apache_logs.json" host="webserver" sourcetype="_json"
| stats count AS Requests by ip
#### | sort - Requests
 ##
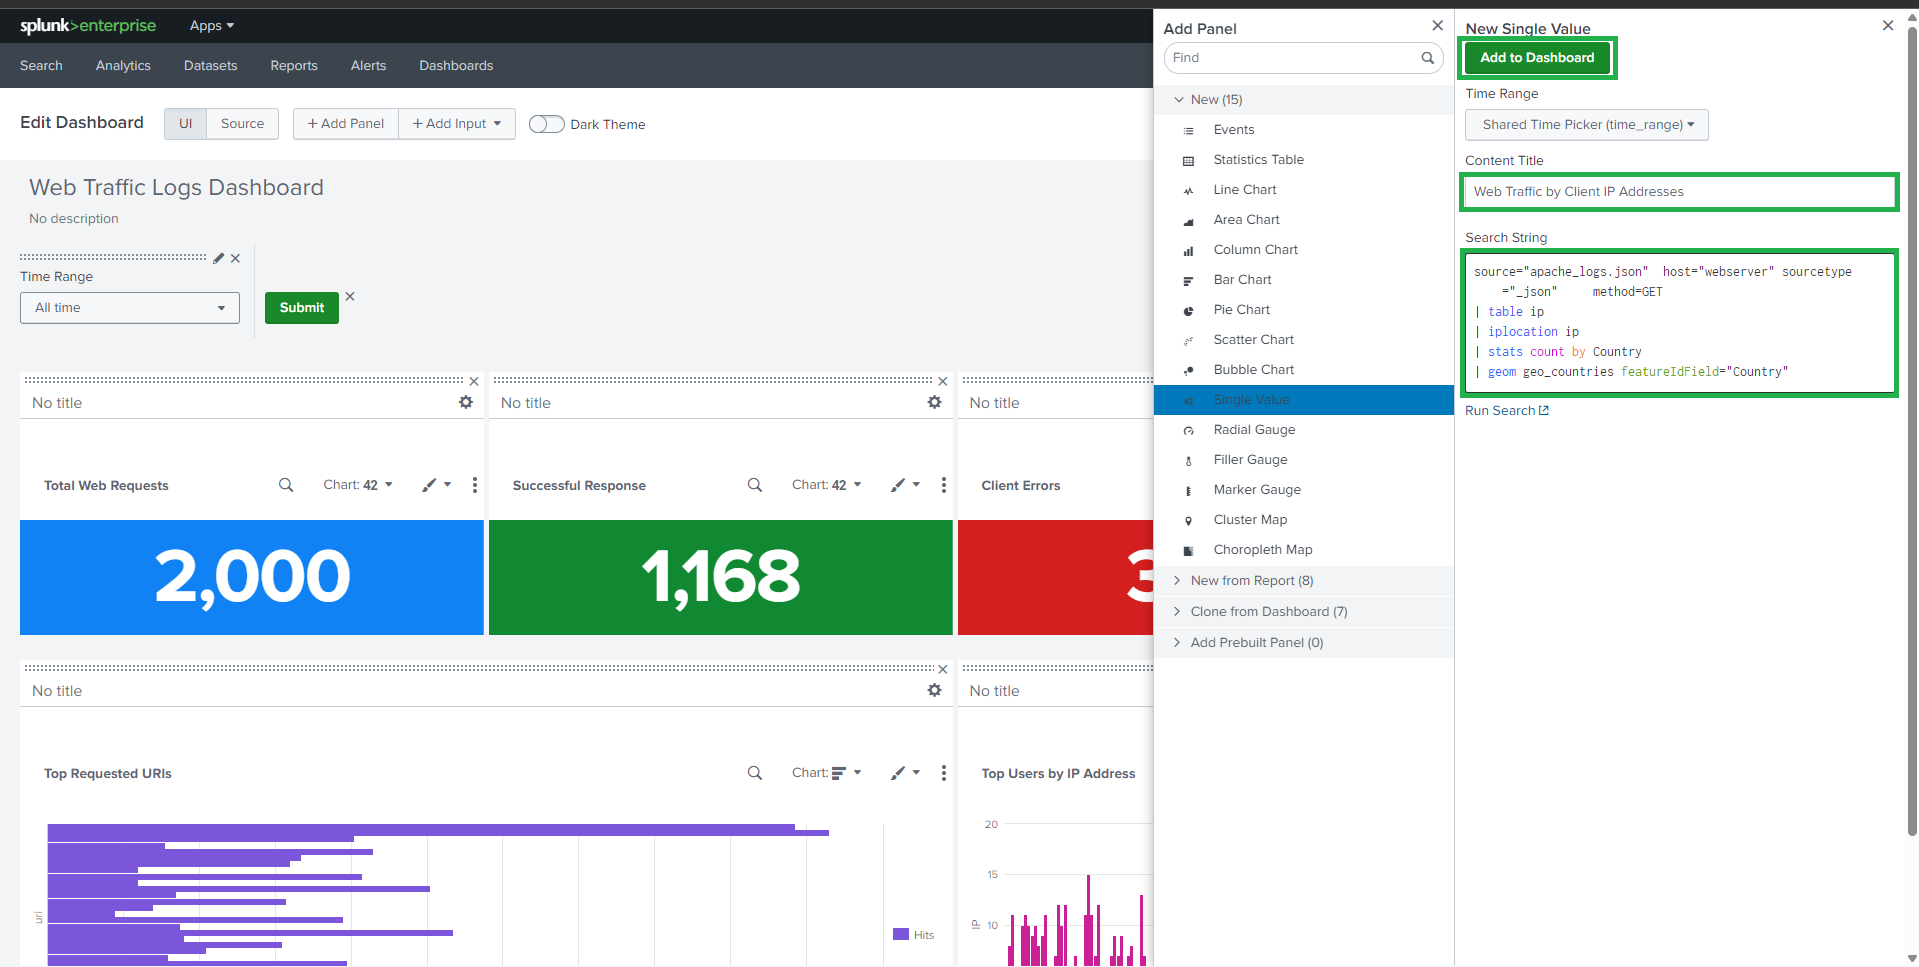
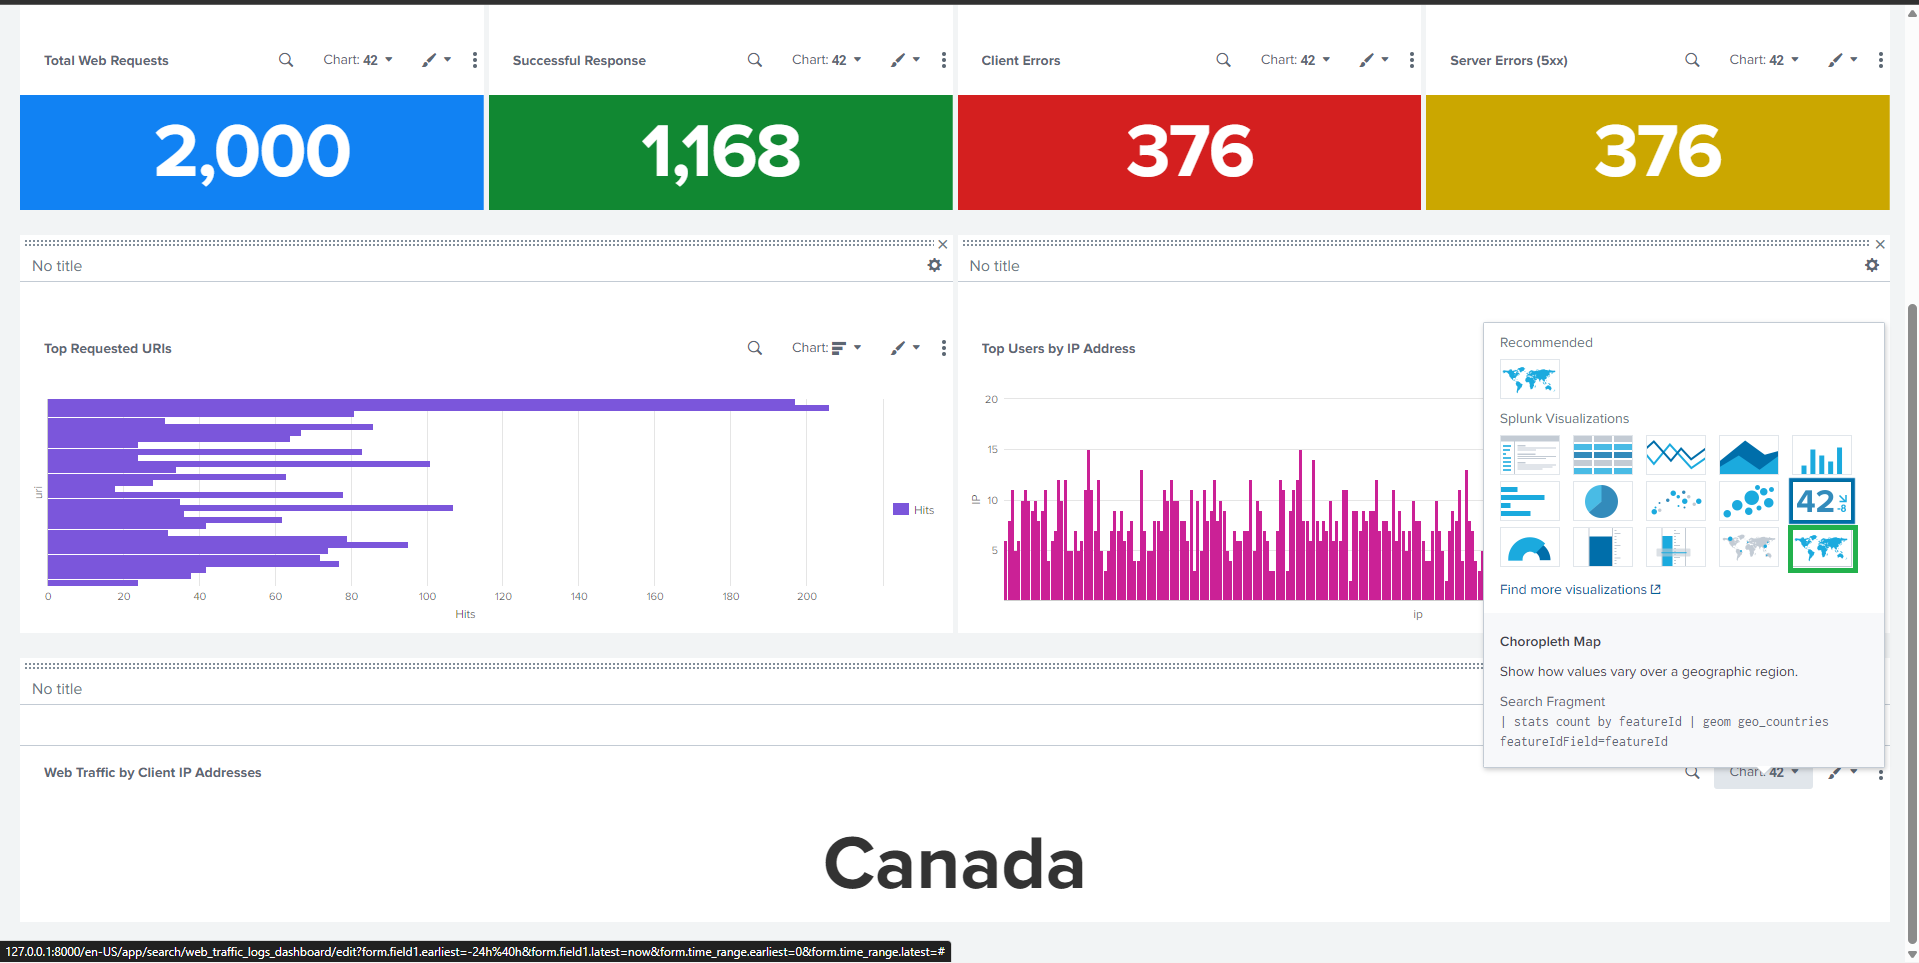
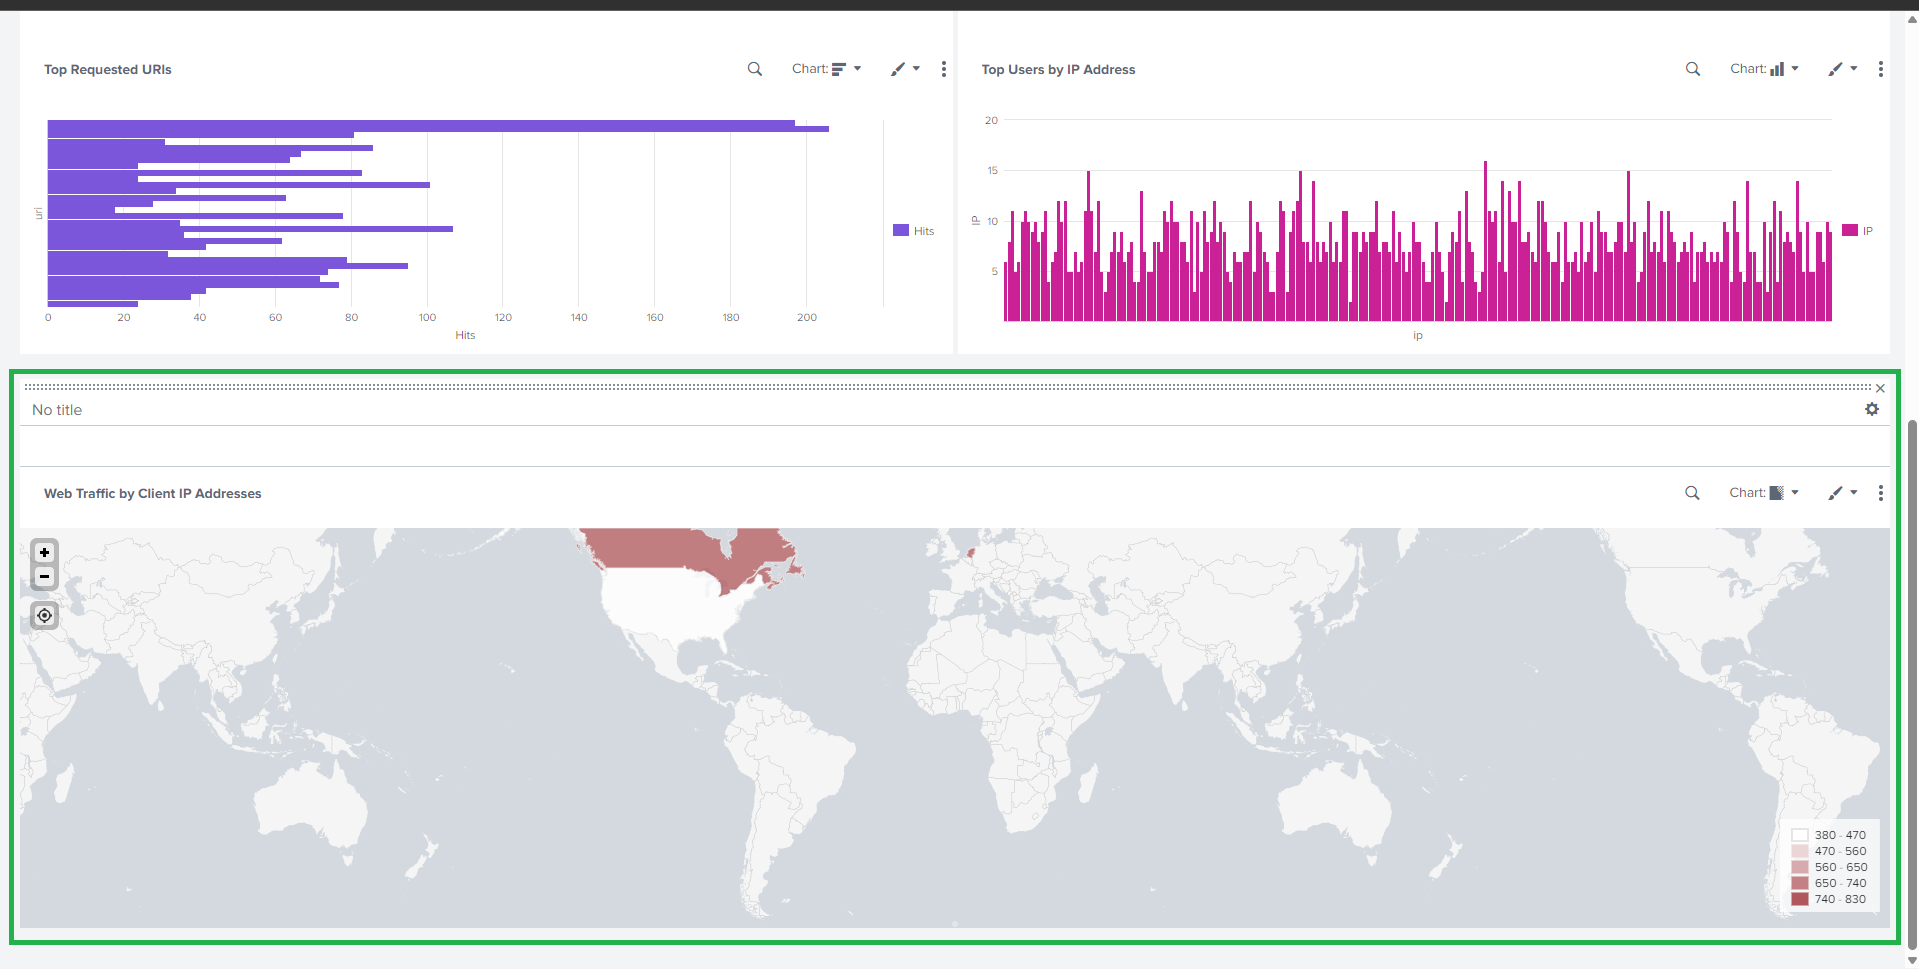
##  ## 🌍 任务 3:按客户端 IP 的 Web 流量(地理视图)
### 🔹 分级统计地图
**Visualization**: Choropleth Map
```spl
source="apache_mixed_access_full (1).json" host="webserver" sourcetype="_json" method=GET
| table ip
| iplocation ip
| stats count by Country
#### | geom geo_countries featureIdField="Country"
## 🌍 任务 3:按客户端 IP 的 Web 流量(地理视图)
### 🔹 分级统计地图
**Visualization**: Choropleth Map
```spl
source="apache_mixed_access_full (1).json" host="webserver" sourcetype="_json" method=GET
| table ip
| iplocation ip
| stats count by Country
#### | geom geo_countries featureIdField="Country"
 ##
## 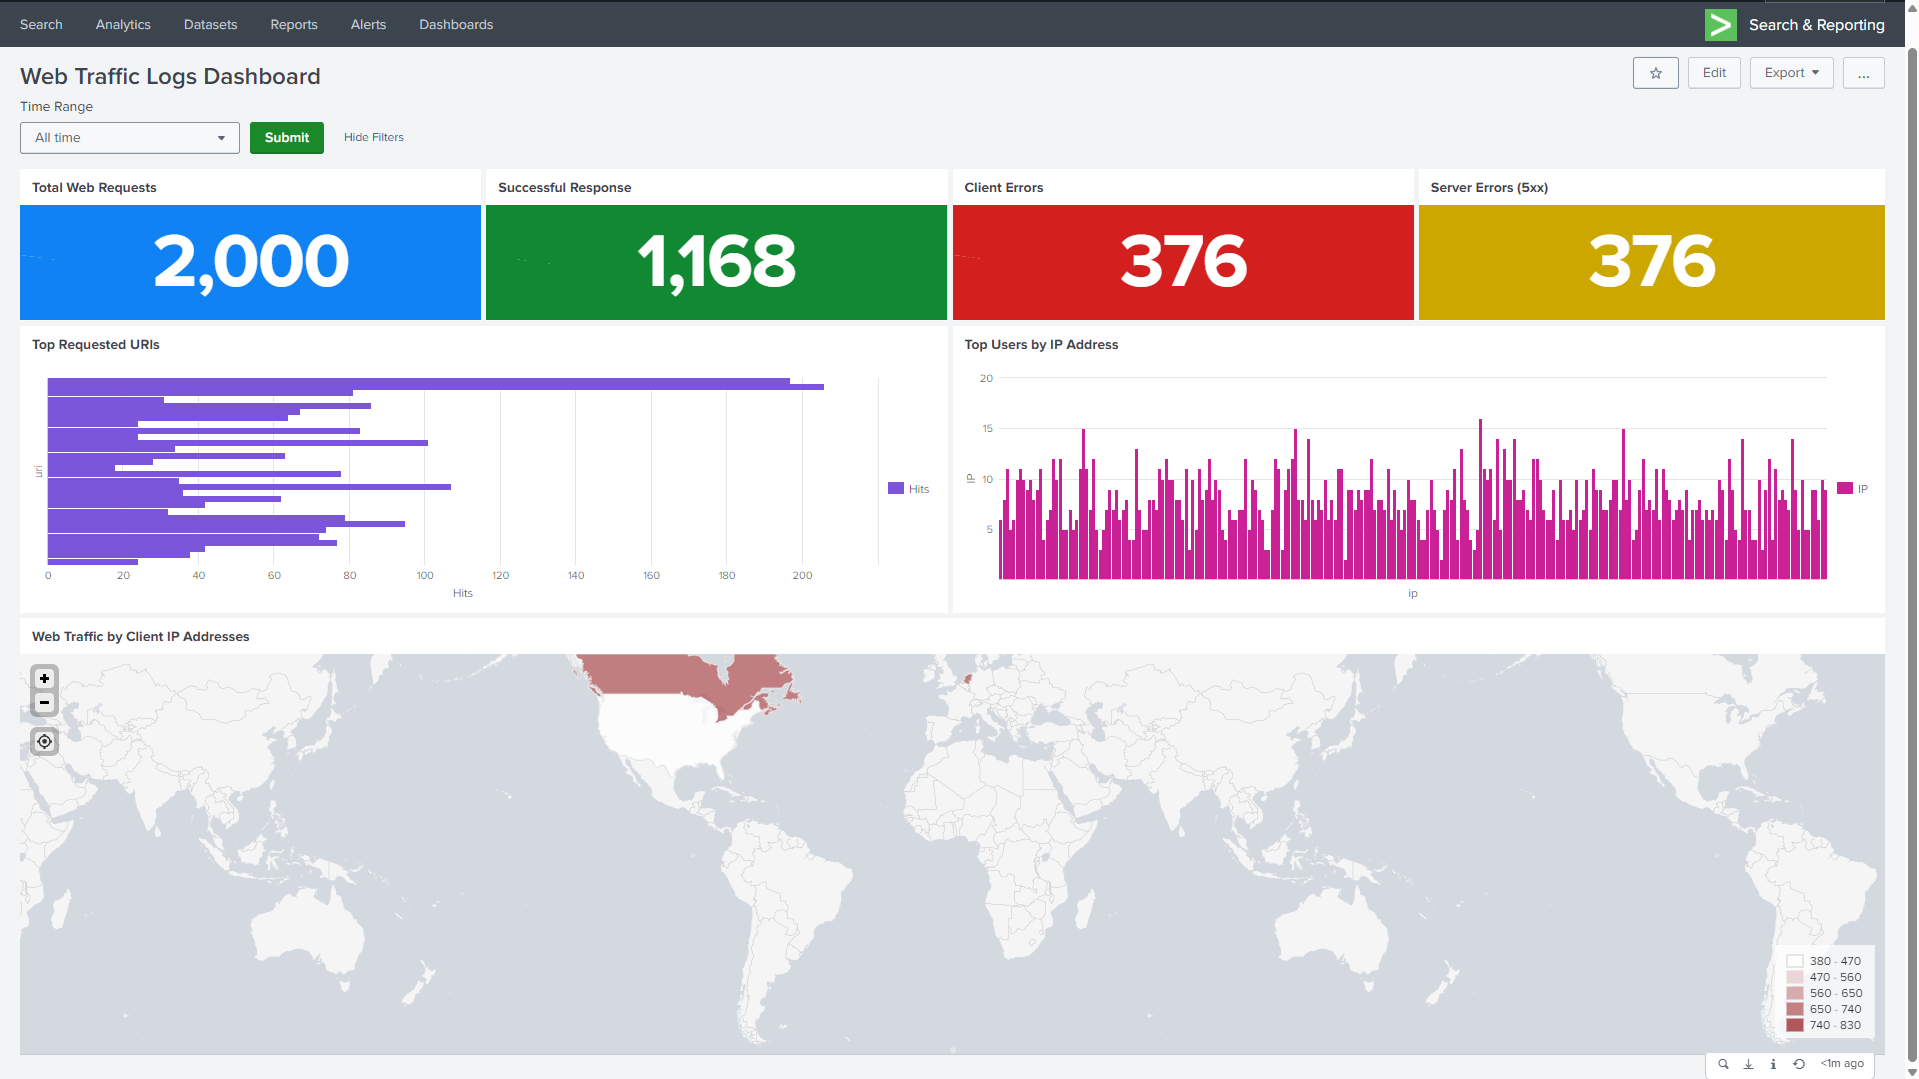 ## ✅ 关键特性
* 📊 Real-time traffic monitoring
* 🚨 Error detection (4xx & 5xx)
* 🌐 Geographic traffic visualization
* 🔍 Insight into popular resources and users
## * 🔐 适用于安全和异常检测
## 📌 使用案例
* Web server monitoring
* Security analysis
* Traffic trend analysis
* Performance troubleshooting
## * 学术和实验室提交
## 🧾 结论
This project delivers a **comprehensive Splunk dashboard** for analyzing web traffic logs using SPL queries and visual analytics.
## 它使管理员和安全分析师能够快速了解流量行为、检测异常并做出明智的决策。
## 📚 未来增强
* Add alerts for high error rates
* Time-series trend analysis
* Brute-force or suspicious IP detection
## * 与 SIEM 使用案例集成
```
## ✅ 关键特性
* 📊 Real-time traffic monitoring
* 🚨 Error detection (4xx & 5xx)
* 🌐 Geographic traffic visualization
* 🔍 Insight into popular resources and users
## * 🔐 适用于安全和异常检测
## 📌 使用案例
* Web server monitoring
* Security analysis
* Traffic trend analysis
* Performance troubleshooting
## * 学术和实验室提交
## 🧾 结论
This project delivers a **comprehensive Splunk dashboard** for analyzing web traffic logs using SPL queries and visual analytics.
## 它使管理员和安全分析师能够快速了解流量行为、检测异常并做出明智的决策。
## 📚 未来增强
* Add alerts for high error rates
* Time-series trend analysis
* Brute-force or suspicious IP detection
## * 与 SIEM 使用案例集成
```
标签:AMSI绕过, Apache 日志分析, Homebrew安装, HTTP 状态码, IP 地址批量处理, IP 地理定位, JSON, OISF, SPL, Splunk Enterprise, Web 流量监控, 交互式报表, 仪表盘, 威胁检测, 性能故障排查, 日志管理, 网络安全, 运维监控, 隐私保护