willibrandon/dotsider
GitHub: willibrandon/dotsider
一款功能丰富的 .NET 程序集终端分析工具,提供元数据检视、IL 与原生反汇编、依赖可视化、动态追踪及 AI 集成等能力。
Stars: 2 | Forks: 0
# Dotsider
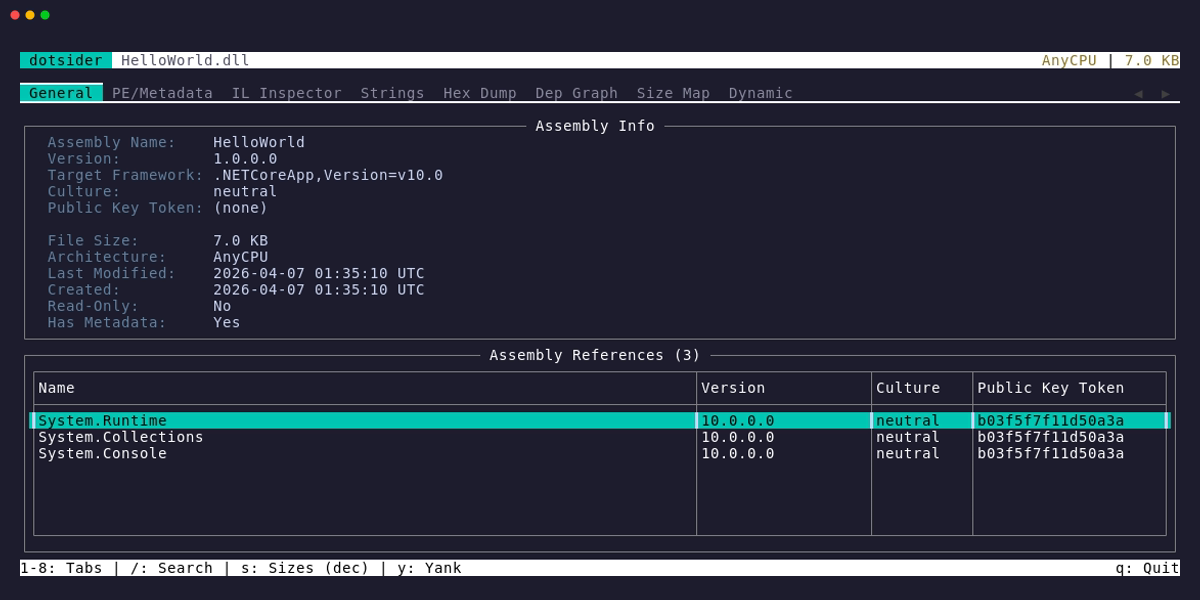
一个用于分析 .NET 程序集的 TUI —— 包括结构、元数据、IL、字符串、依赖项等。受用于 ELF 二进制文件的 [binsider](https://github.com/orhun/binsider) 启发,专为 .NET 生态系统而构建。
```
dotsider HelloWorld.dll
```
## 安装
### dotnet tool(推荐)
```
dotnet tool install -g dotsider
```
### Homebrew (macOS / Linux)
```
brew install willibrandon/tap/dotsider
```
### WinGet (Windows)
```
winget install willibrandon.dotsider
```
### Scoop (Windows)
```
scoop bucket add dotsider https://github.com/willibrandon/scoop-bucket
scoop install dotsider
```
### 下载二进制文件
从 [Releases](https://github.com/willibrandon/dotsider/releases) 获取独立二进制文件。
## 功能介绍
dotsider 可以打开任何 .NET DLL 或 EXE,并允许你通过 8 个选项卡进行探索。如果你打开的 apphost `.exe` 没有 .NET 元数据,dotsider 会检测到缺失的元数据,并提议改为打开其配套的托管 `.dll`。如果你打开的是自包含的单文件可执行程序,dotsider 会读取该 bundle,提取入口程序集,并直接对其进行分析 —— 无需解压。如果你打开的是 Native AOT 可执行程序,dotsider 会验证其内嵌的 ReadyToRun 标头并遍历其 runtime 区段 —— 展示二进制类型、工具链格式版本、runtime 版本、原生 import/export/load-config 表、ReadyToRun 区段表、从内嵌元数据中恢复的类型和方法,以及冻结的字符串字面量。
| 选项卡 | 你将看到的内容 |
|-----|-------------|
| **1 General** | 程序集标识、目标框架、架构、依赖表。在引用上按 Enter 键可深入查看。 |
| **2 PE/Metadata** | COFF 标头、CLR 标头、区段、TypeDefs、MethodDefs、AssemblyRefs、自定义特性、资源、调试目录、原生 import、export、load config、ReadyToRun 区段,以及恢复的 AOT 类型。在 TypeDef 或 MethodDef 上按 `g` 可跳转到其 IL。 |
| **3 IL Inspector** | 带有 IL 反汇编的命名空间/类型/方法树。Portable PDB 在可用时会添加源码跨度、Source Link 标记和本地名称。在 `[source link]` 标记上按 `u` 可复制其解析后的 URL。在 `call`、`ldfld`、`newobj` 等指令上按 `Enter` 或 `gd` 可跳转到目标 —— 支持跨程序集操作。按 `Esc` 返回。按 `x` 可在十六进制转储中跳转到方法体。对于 Native AOT 二进制文件,相同的树会列出恢复的函数,右侧窗格会显示真实的 **x86-64 或 AArch64 反汇编**(一个从头编写的、支持 VEX/EVEX 的 x64 解码器和一个包含 SVE 的 A64 解码器),并将 call/branch/data 目标解析为名称、`Foo+0x12`、`loc_…` 标签以及 `MODULE!Function` import。 |
| **4 Strings** | 用户字符串、元数据字符串、原始 ASCII 和 UTF-16 二进制扫描,以及冻结的 AOT 字符串字面量,支持配置最小长度。 |
| **5 Hex Dump** | 十六进制编辑器,支持 vi 风格的模态编辑(默认只读)、字节类别着色、数据解释面板、跳转到偏移量以及 vim 导航。 |
| **6 Dep Graph** | 可视化依赖图 —— 你的程序集位于根节点,引用作为节点,边权重由 TypeRef 数量决定。在节点上按 Enter 可打开该程序集。 |
| **7 Size Map** | 代码大小的树形图 —— Assembly > Namespace > Type > Method,按 IL 字节数计算大小。点击深入查看;在方法叶节点上按 Enter 可跳转到其 IL。 |
| **8 Dynamic** | 启动程序集并通过 EventPipe 进行实时追踪 —— GC 事件、JIT 编译、异常、性能计数器、stdout。在 JIT 事件上按 Enter 可跳转到该方法的 IL。 |
### 附加模式
```
dotsider diff v1.dll v2.dll # side-by-side assembly comparison
dotsider package.nupkg # browse NuGet package contents, inspect any DLL inside
```
## 构建
需要 [.NET 10 SDK](https://dotnet.microsoft.com/download/dotnet/10.0)。
```
dotnet build
```
二进制文件位于 `src/Dotsider/bin/Debug/net10.0/dotsider`。
## 用法
```
dotsider # TUI mode — interactive assembly explorer
dotsider # TUI mode — browse NuGet package contents
dotsider diff # TUI mode — side-by-side assembly comparison
dotsider analyze [opts] # CLI mode — headless analysis to stdout or file
dotsider sessions # CLI mode — interact with running dotsider instances
dotsider agent init [opts] # CLI mode — generate AI skill file for a provider
dotsider agent mcp # CLI mode — launch the dotsider MCP server
TUI options:
-t, --tab <1-8> start on a specific tab
-n, --min-len minimum raw string length (default: 4)
-v, --version show version
-h, --help show help
```
### CLI: `dotsider analyze`
在不启动 TUI 的情况下运行分析 —— 可以通过管道传递给其他工具、写入文件,或输出 JSON 用于脚本编写。
```
dotsider analyze MyLib.dll # assembly info (default)
dotsider analyze MyLib.dll --types # list type definitions
dotsider analyze MyLib.dll --methods # list method definitions
dotsider analyze MyLib.dll --il Type.Method # disassemble a method
dotsider analyze MyAotApp.exe --symbols # list native symbols (Native AOT / native binaries)
dotsider analyze MyAotApp.exe --disasm 'Program.$' # disassemble a native function (name or 0xVA)
dotsider analyze MyLib.dll --embedded-source Type.Method # print embedded source
dotsider analyze MyLib.dll --deps # assembly references
dotsider analyze MyLib.dll --strings # extract strings
dotsider analyze MyLib.dll --fields # list field definitions
dotsider analyze MyLib.dll --size # size breakdown
dotsider analyze MyLib.dll --bundle # show single-file bundle manifest
dotsider analyze MyLib.dll --json # any of the above as JSON
dotsider analyze MyLib.dll --types -o out.txt # write to file
dotsider analyze MyApp.exe # apphost .exe → auto-redirects to MyApp.dll
dotsider analyze MyApp # single-file bundle → extracts and analyzes entry assembly
```
### CLI: `dotsider sessions`
与运行中的 dotsider TUI 实例进行交互。每个实例都会暴露一个 Unix domain socket,以便进行编程访问。
```
dotsider sessions list # list running instances
dotsider sessions info # assembly info + current view
dotsider sessions view # current tab and view state
dotsider sessions navigate # switch to tab (1-8)
dotsider sessions capture # capture screen as plain text
dotsider sessions trace start # start tracing the loaded assembly
dotsider sessions trace events # get JIT, GC, exception events
dotsider sessions trace counters # get performance counters
dotsider sessions trace output # get stdout/stderr from traced process
dotsider sessions trace stop # stop the active trace
```
### CLI: `dotsider agent`
MCP 服务器管理和 AI skill 文件生成。
```
dotsider agent mcp # launch the dotsider MCP server
dotsider agent init --ai claude # generate skill file for a provider
dotsider agent init --path ./SKILL.md # write to an explicit path
dotsider agent init --stdout # print skill content to stdout
```
支持的 `--ai` 提供商:claude、gemini、copilot、cursor-agent、opencode、codex、windsurf、kilocode、amp、qwen。每一个都会解析为相对于当前目录的该提供商的常规 skill 路径。
### 键盘
| 按键 | 操作 |
|-----|--------|
| `1`-`8` | 切换选项卡 |
| `Enter` | 深入查看选中项(程序集引用、方法、包中的 DLL) |
| `Esc` | 返回(程序集堆栈、面包屑导航或跨视图跳转) |
| `y` | Yank(复制) —— 编辑器中选中的文本,或表格中聚焦的行 |
| `yy` | Yank 光标所在的整行 |
| `V` | 选中光标所在的整行 |
| `iw` | 选中内部单词(vim 文本对象) |
| `iW` | 选中内部 WORD(以空格分隔 —— 可抓取完全限定名) |
| `yiw` / `yiW` | 一次性完成选中并 Yank word/WORD |
| `Tab` | 在信息面板和表格之间循环聚焦 |
| `Enter` / `gd` | 跳转到定义(IL Inspector 选项卡,光标位于带有 token 的指令上) |
| `g` | 为聚焦的 TypeDef/MethodDef 跳转到 IL Inspector(PE/Metadata 选项卡) |
| `u` | 从 IL Inspector 中的 `[source link]` 标记复制 Source Link URL |
| `x` | 跳转到 Hex Dump 中的方法体(IL Inspector 选项卡,当选中带有 RVA 的方法时) |
| `/` | 搜索(内联高亮匹配项) |
| `n` / `N` | 下一个 / 上一个搜索匹配项 |
| `s` | 切换人类可读的大小显示 |
| `q` | 退出 |
信息面板(Assembly Info、PE Headers、CLR Header、详情弹窗、字符串详情)是可选的只读编辑器。点击它们或使用 `Tab` 切入,使用 `Shift` + 方向键选中文本,然后按 `y` 进行复制。要在不使用鼠标的情况下进行单词级别的选择,`iw` 会选中光标下的单词,而 `iW` 会选中以空格分隔的完整 token —— `yiw` 按一次键即可将其复制。`V` 选中整行,而 `yy` 一次性复制整行。
**Hex Dump 选项卡**使用 vi 风格的模态编辑 —— 编辑器默认以 normal 模式(只读)启动,以防止意外写入:
| 按键 | 模式 | 操作 |
|-----|------|--------|
| `i` | Normal | 进入 insert 模式(启用字节编辑) |
| `Esc` | Insert | 返回 normal 模式 |
| `h` `j` `k` `l` | Normal | Vim 风格的光标移动 |
| `g` | Normal | 跳转到十六进制偏移量 |
| `e` | Normal | 切换字节序(LE/BE) |
| `Ctrl+T` | 任意 | 切换文本/十六进制搜索模式 |
| `Ctrl+S` | Normal | 保存修改后的字节(仅在已修改时可用) |
在 insert 模式下,输入两个十六进制数字(0-9,a-f)即可覆盖一个字节。第一个数字设置高位半字节;第二个数字提交编辑。保存时会在写入前验证 PE 映像 —— 无效的编辑将被拒绝。
Diff 模式增加了 `f` 键来循环切换过滤器(All / Added / Removed / Changed)。NuGet 模式使用 `Esc` 键从 DLL 检查返回到包浏览器。
## 工作原理
dotsider 使用随 .NET runtime 本身一起提供的 API 来读取程序集 —— 不需要第三方分析库:
- **`System.Reflection.Metadata`** 提供 `MetadataReader` 用于遍历元数据表(类型、方法、引用、自定义特性、字符串堆)
- **`System.Reflection.PortableExecutable`** 提供 `PEReader` 用于处理 PE 结构(COFF 标头、区段、CLR 标头、方法体)
- **`System.IO.Compression`** 处理 NuGet 包(它们本质上只是包含 `.nuspec` 清单和 DLL 的 ZIP 文件)
动态分析选项卡使用 `Microsoft.Diagnostics.NETCore.Client` 通过 EventPipe 连接到运行中的 .NET 进程 —— 这与支持 `dotnet-trace` 和 `dotnet-counters` 的诊断基础设施相同。它使用反向连接的诊断端口启动你的程序集,因此从第一条指令开始就能捕获事件。
TUI 基于 [Hex1b](https://github.com/mitchdenny/hex1b) 构建,这是一个 .NET 终端 UI 库,具有受 React 启发的声明式 API、基于约束的布局、主题化以及高效的组件协调机制。
## MCP 服务器
`dotsider-mcp` 是一个独立的 [Model Context Protocol](https://modelcontextprotocol.io) 服务器,它将 dotsider 的分析引擎暴露给 AI 编程助手,如 Claude Code、VS Code Copilot 等。
### 安装
#### dotnet tool(推荐)
```
dotnet tool install -g Dotsider.Mcp
```
#### Homebrew (macOS / Linux)
```
brew install willibrandon/tap/dotsider-mcp
```
#### WinGet (Windows)
```
winget install willibrandon.dotsider-mcp
```
#### Scoop (Windows)
```
scoop install dotsider-mcp
```
#### 下载二进制文件
从 [Releases](https://github.com/willibrandon/dotsider/releases) 获取独立二进制文件。
### 配置
添加到你的 MCP 客户端配置中(例如 Claude Code 的 `.mcp.json`):
```
{
"mcpServers": {
"dotsider": {
"command": "dotsider-mcp"
}
}
}
```
### 提供的功能
涵盖程序集分析、IL 反汇编、原生反汇编、Portable PDB 调试信息、元数据检查、依赖图、大小分析、字符串提取、差异比对、NuGet 包分析、单文件 bundle 读取和 runtime 追踪的 **42 个工具**。这些工具支持两种模式:
- **Direct 模式** —— 传入程序集路径,获取结果(无需 TUI)
- **Session 模式** —— 通过 Unix domain socket 连接到运行中的 dotsider TUI 实例,以进行实时状态、追踪和导航
用于常见工作流的 **5 个引导式 prompt**:安全审计、API 表面审查、破坏性变更检测、依赖健康状况分析和单文件 bundle 检查。
## 项目结构
```
src/Dotsider.Core/
Analysis/ PE reading, metadata extraction, IL disassembly, diffing,
dependency graphs, size analysis, runtime tracing,
single-file bundle reading, .NET shared framework discovery
Analysis/Models/ Data types for analysis results
Protocol/ Request/response types and JSON options for the UDS protocol
src/Dotsider/
Commands/ CLI subcommands (analyze, sessions, agent)
Diagnostics/ Unix domain socket listener for TUI state access
Infrastructure/ Output formatting, session discovery
Views/ One file per tab — widget trees built each frame
DotsiderApp.cs Main app shell (tab panel, key bindings, hints bar)
DotsiderState.cs All mutable UI state in one place
DiffApp.cs Diff mode shell
NuGetApp.cs NuGet mode shell
Program.cs CLI entry point and mode routing
src/Dotsider.Mcp/
Tools/ MCP tool classes (assembly, IL, metadata, deps, size, etc.)
Prompts/ Guided analysis prompts (security, API review, breaking changes)
Program.cs MCP server entry point (stdio transport)
samples/
HelloWorld/ Minimal console app
ComplexApp/ Async pipeline with embedded resources
EmbeddedSourceLib/ Embedded portable PDB source fixture
RichLibrary/ Library with NuGet deps (Newtonsoft.Json, System.Text.Json)
RichLibraryV2/ Same library with deliberate API changes (for diff testing)
MinimalApi/ ASP.NET Core minimal API (web SDK, hosted entry point)
NativeLib/ Unsafe code, P/Invoke, pointer operations
EmptyLib/ Minimal library (edge case testing)
NetFxConsole/ .NET Framework 4.8 console app (Dynamic tab guard testing)
NativeAotConsole/ NativeAOT-published console app (Dynamic tab tracing tests)
SelfContainedConsole/ Self-contained single-file bundle (bundle reading, resolution tests)
Dotted.Name.App/ Console app with a dotted assembly name (apphost detection)
NetFxBindingRedirects/ .NET Framework 4.8 fixture for the netfx binder — GAC, framework
runtime dir, binding redirects, codeBase, privatePath, satellite culture.
Five sibling projects (OldDep, NewDep, PrivatePathLib, CodeBaseLib,
CulturedLib) supply the references the root EXE deploys and resolves.
tests/Dotsider.Tests/
SampleAssemblyFixture.cs Builds every sample once and runs the netfx oracle EXE,
shared across tests
*Tests.cs Integration tests against real assemblies
tests/Dotsider.Mcp.Tests/
McpServerTestBase.cs In-memory MCP server setup for testing
*Tests.cs MCP tool and prompt integration tests
```
## 测试
```
dotnet test
```
集成测试针对真实的 .NET 程序集运行。测试夹具会自动构建所有示例项目。由于 NuGet 还原,首次运行耗时较长;后续运行将使用缓存。
## 示例
构建示例程序集以获得可供分析的内容:
```
dotnet build samples/RichLibrary
dotsider samples/RichLibrary/bin/Debug/net10.0/RichLibrary.dll
```
使用两个库版本尝试 diff 模式:
```
dotnet build samples/RichLibraryV2
dotsider diff \
samples/RichLibrary/bin/Debug/net10.0/RichLibrary.dll \
samples/RichLibraryV2/bin/Debug/net10.0/RichLibrary.dll
```
## License
MIT
标签:PE分析, SOC Prime, TUI, URL提取, 云安全监控, 云资产清单, 反编译, 开发工具, 逆向工程, 静态分析