LinChuang2008/vigilops
GitHub: LinChuang2008/nightmend
开源AI运维监控平台,通过DeepSeek驱动的根因分析和自动修复Runbook实现告警自愈,集成MCP让AI助手直接访问生产环境实时数据。
Stars: 17 | Forks: 7
# VigilOps
**您的团队每天收到 200+ 条告警。其中 80% 是噪音。AI 在您睡觉时修复它们。**
[](https://github.com/LinChuang2008/vigilops)
[](https://github.com/LinChuang2008/vigilops/actions/workflows/test.yml)
[](https://github.com/LinChuang2008/vigilops/actions/workflows/docker-publish.yml)
[](https://github.com/LinChuang2008/vigilops/releases)
[](LICENSE)
[在线演示](https://demo.lchuangnet.com/login) | [安装](#quickstart) | [文档](#documentation) | [中文文档](README.zh-CN.md)

## VigilOps 的独特之处
您可能尝试过 **Grafana + Prometheus**。您也可能了解 **Datadog**。它们只会告诉您 *什么东西坏了*,但没有一个能 **修复它**。
VigilOps 是 **首个开源 AI 平台**,它不仅能监控 —— 还能 **自愈**:
1. **AI 分析** — DeepSeek 读取日志、指标、拓扑结构以找到根本原因
2. **AI 决策** — 从 13 个内置自动修复脚本中选择正确的 Runbook
3. **AI 修复** — 在安全检查和审批流程下执行修复
4. **AI 学习** — 下次解决相同问题的速度更快
**全球首创**:世界首个集成 **MCP (Model Context Protocol)** 的开源监控平台 —— 您的 AI 编码助手可以直接查询实时生产数据。
## 快速开始
**在线体验** (无需安装):[demo.lchuangnet.com](https://demo.lchuangnet.com/login) — `demo@vigilops.io` / `demo123`
**3 步自托管:**
```
git clone https://github.com/LinChuang2008/vigilops.git && cd vigilops
cp .env.example .env # Optional: add DeepSeek API key for live AI
docker compose up -d # Open http://localhost:3001
```
## 功能对比
| 功能 | VigilOps | Nightingale | Prom+Grafana | Datadog | Zabbix |
|---------|:--------:|:-----------:|:------------:|:-------:|:------:|
| AI 根因分析 | 内置 | - | - | 企业版 | - |
| 自动修复 | 13 个 Runbooks | - | - | 企业版 | - |
| MCP 集成 | **首创** | - | - | 早期 | - |
| PromQL 查询 | ✓ | - | 原生 | 企业版 | - |
| 自托管 | Docker | K8s/Docker | 复杂 | SaaS | 是 |
| 成本 | **免费** | 免费/企业 | 免费 | $$$ | 免费/企业 |
| 部署时间 | **5 分钟** | 30 分钟 | 2+ 小时 | 5 分钟 | 1+ 小时 |
**最佳选择**:希望获得 AI 运维能力但不想承担企业级授权成本的中型团队。
## 工作原理
```
Alert Fires AI Diagnosis Auto-Fix Resolved
┌──────────┐ ┌──────────────┐ ┌────────────────┐ ┌────────────┐
│ Disk 95% │────>│ "Log rotation│────>│ log_rotation │───>│ Disk 60% │
│ on prod │ │ needed on │ │ runbook starts │ │ Fixed in │
│ server │ │ /var/log" │ │ safely │ │ 2 minutes │
└──────────┘ └──────────────┘ └────────────────┘ └────────────┘
```
**13 个内置 Runbooks**:`disk_cleanup` | `service_restart` | `memory_pressure` | `log_rotation` | `zombie_killer` | `connection_reset` | `cpu_high` | `docker_cleanup` | `network_diag` | `mysql_health` | `redis_health` | `nginx_fix` | `swap_pressure`
**AI Runbook 生成器**:用自然语言描述场景,AI 会生成带有安全检查的可执行 Runbook —— 通过 `/api/v1/ai/generate-runbook` 接口。
## Prometheus AlertManager 桥接
已经在运行 Prometheus?在 `alertmanager.yml` 中添加 3 行配置,即可对每条告警进行 AI 诊断:
```
receivers:
- name: 'vigilops'
webhook_configs:
- url: 'http://your-vigilops:8001/api/v1/webhooks/alertmanager'
http_config:
authorization:
type: Bearer
credentials: 'YOUR_TOKEN'
route:
receiver: 'vigilops'
```
**流程**:Prometheus 触发告警 → VigilOps 接收 → AI 分析根因 → 诊断结果通过 SSE 实时显示在 Demo 页面。
两种模式:**仅诊断**(安全,只读分析)或 **自动修复**(AI 选择并执行正确的 Runbook)。
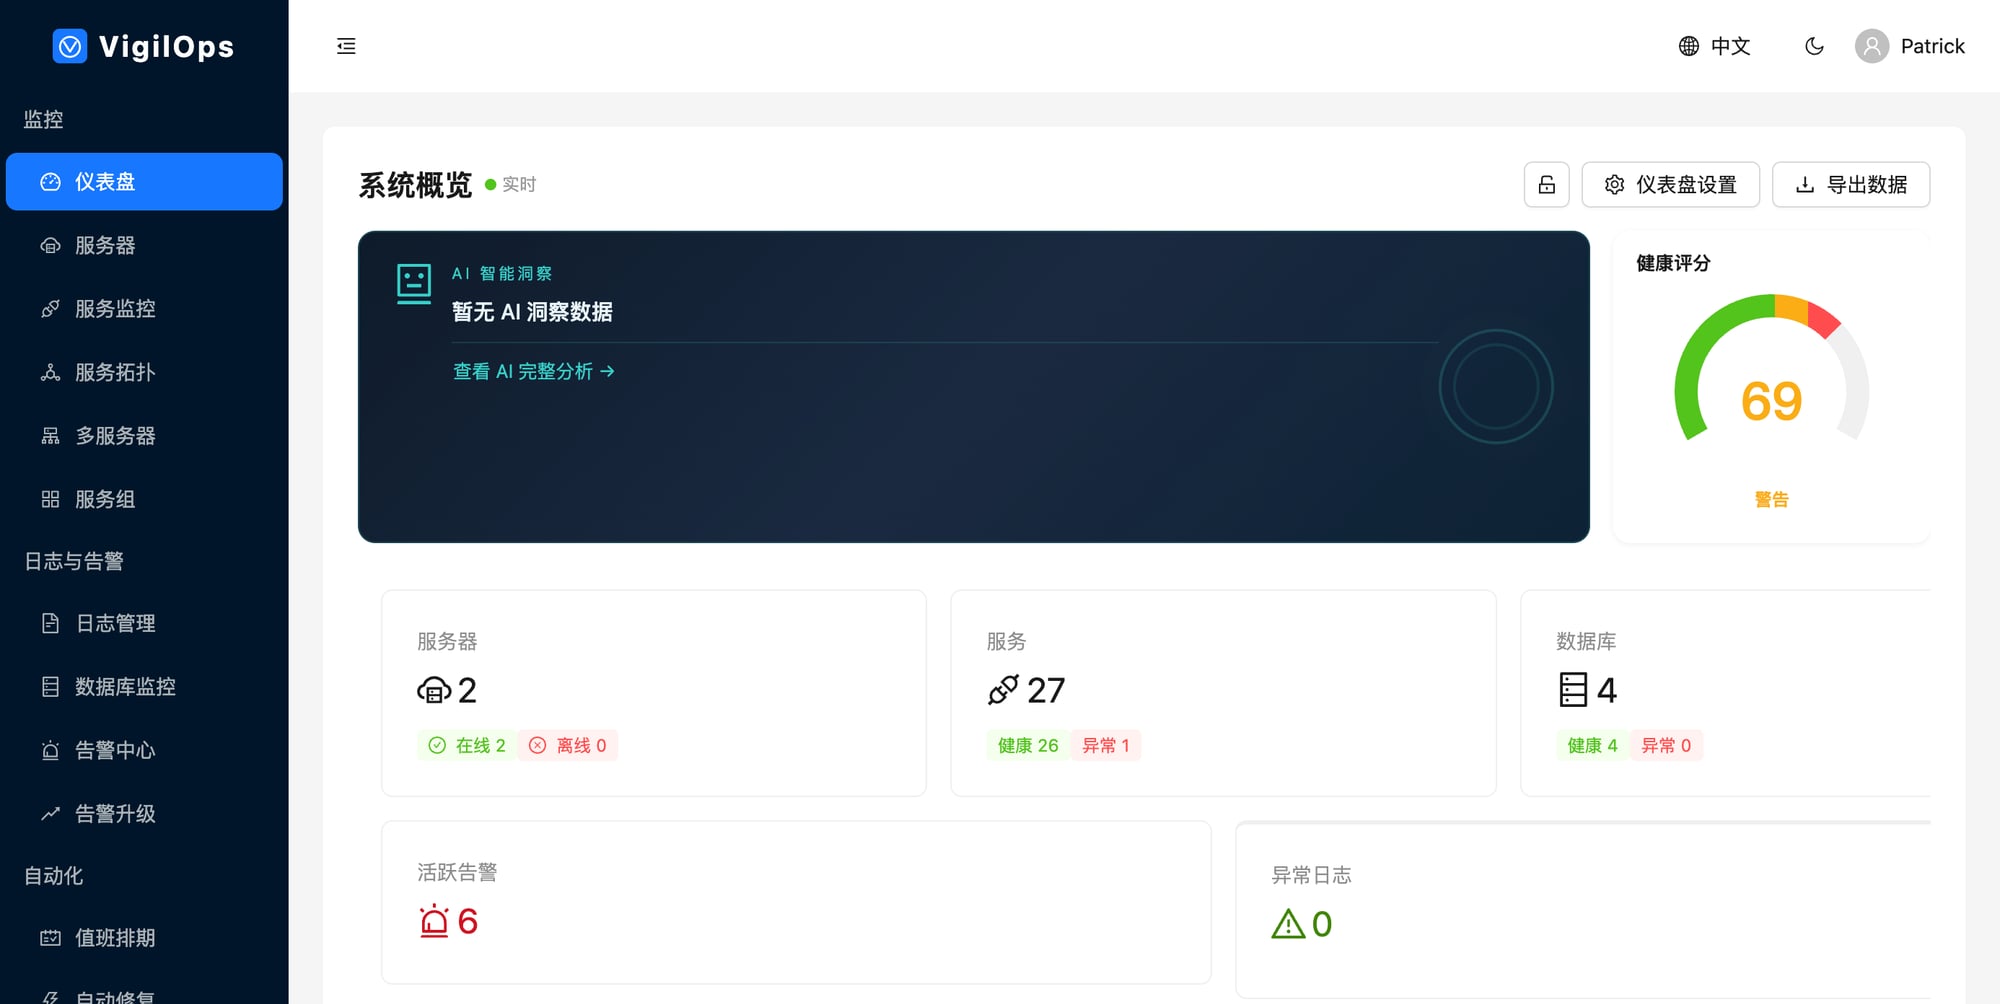
## 截图

**仪表盘** — 跨所有主机的实时指标
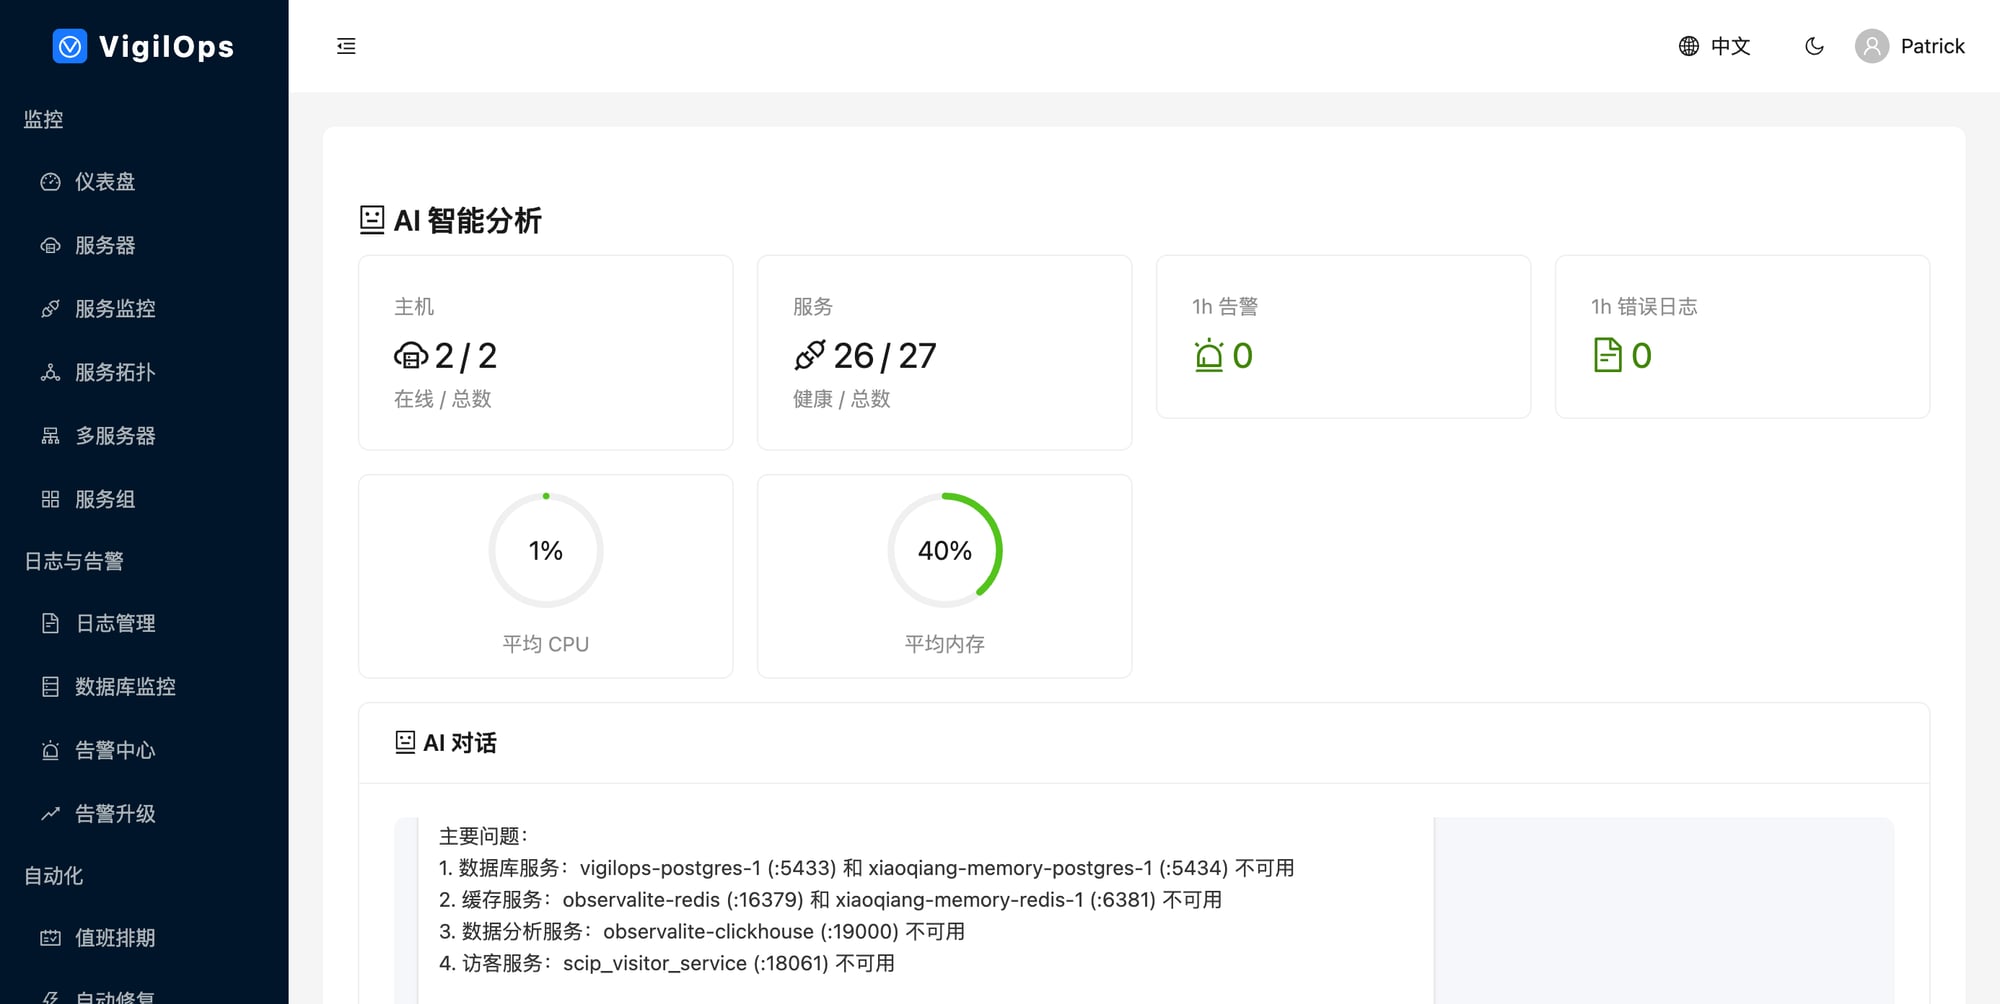
**AI 告警分析** — 根因 + 建议操作
## MCP 集成 —— 全球开源首创
您的 AI 助手 (Claude Code, Cursor) 通过 MCP 查询实时生产数据:
```
# 在 backend/.env 中启用
VIGILOPS_MCP_ENABLED=true
VIGILOPS_MCP_PORT=8003
VIGILOPS_MCP_API_KEY=your-secret-token
```
**5 个 MCP 工具**:`get_servers_health` | `get_alerts` | `search_logs` | `analyze_incident` | `get_topology`
询问您的 AI:*"Show all critical alerts on prod-server-01"* / *"Analyze last night's CPU spike"* / *"Search for OOM errors in the past 2 hours"*
## PromQL 查询支持
通过 API 使用熟悉的 PromQL 语法查询指标:
```
# 即时查询
GET /api/v1/promql/query?query=vigilops_host_cpu_percent
# 范围查询
GET /api/v1/promql/query_range?query=avg(vigilops_host_cpu_percent)&start=...&end=...&step=5m
# 支持:rate(), avg(), sum(), min(), max(), count(), avg_over_time(), label matchers
```
兼容 Prometheus HTTP API 格式,支持 Grafana 集成。
## Agent —— 跨平台监控
VigilOps Agent 收集系统指标、发现服务并监控数据库。它运行在 **Linux**、**Windows/Windows Server** 和 **macOS** 上。
**Linux:**
```
pip install vigilops-agent
vigilops-agent run -c /etc/vigilops/agent.yaml
```
**Windows (PowerShell):**
```
.\scripts\install-windows-agent.ps1 -ServerUrl "http://your-server:8001" -Token "your-token"
.\scripts\install-windows-service.ps1 # Register as Windows Service
```
| 功能 | Linux | Windows | macOS |
|---------|:-----:|:-------:|:-----:|
| CPU / 内存 / 磁盘 / 网络 | ✓ | ✓ | ✓ |
| Docker 服务发现 | ✓ | ✓ | ✓ |
| 主机服务发现 | ✓ (ss) | ✓ (netstat) | - |
| 数据库监控 | ✓ | ✓ | ✓ |
| 日志收集 | ✓ | ✓ | ✓ |
## 安装
### 前置条件
- Docker 20+ & Docker Compose v2+
- 4 CPU / 8 GB RAM (构建) / 2 GB RAM (运行)
### 环境变量
| 变量 | 必需 | 描述 |
|----------|:--------:|-------------|
| `POSTGRES_PASSWORD` | 是 | 数据库密码 |
| `JWT_SECRET_KEY` | 是 | `openssl rand -hex 32` |
| `AI_API_KEY` | 是 | DeepSeek API key |
| `AI_AUTO_SCAN` | 推荐 | 自动分析告警 (`true`) |
完整指南请参阅 [docs/installation.md](docs/installation.md)。
## 技术栈
| 层级 | 技术 |
|-------|------------|
| 前端 | React 19, TypeScript, Vite, Ant Design 6, ECharts 6 |
| 后端 | Python 3.9+, FastAPI, SQLAlchemy, AsyncIO |
| 数据库 | PostgreSQL 15+, Redis 7+ |
| AI | DeepSeek API (可配置 LLM) |
| Agent | Python 3.9+, psutil — Linux / Windows / macOS |
| 部署 | Docker Compose, Helm Chart (K8s) |
## 文档
[入门指南](docs/getting-started.md) | [安装说明](docs/installation.md) | [用户指南](docs/user-guide.md) | [API 参考](docs/api-reference.md) | [架构](docs/architecture.md) | [贡献指南](CONTRIBUTING.md) | [更新日志](CHANGELOG.md)标签:AIOps, AI运维, API集成, DeepSeek, DevSecOps, DLL 劫持, Docker, Grafana替代, IT监控平台, IT运维监控, MCP协议, Model Context Protocol, PE 加载器, Runbook, SRE, 上游代理, 云原生监控, 偏差过滤, 可观测性, 告警关联分析, 告警治理, 告警管理, 告警降噪, 大模型运维, 大语言模型, 安全防御评估, 容器化部署, 平台工程, 开源, 开源监控工具, 快速部署, 指标监控, 搜索引擎查询, 故障自愈, 智能运维, 根因分析, 模块化设计, 测试用例, 熵值分析, 自动修复, 自动化修复, 自定义请求头, 请求拦截, 运维平台, 运维自动化, 逆向工具