opscart/opscart-k8s-watcher

GitHub: opscart/opscart-k8s-watcher
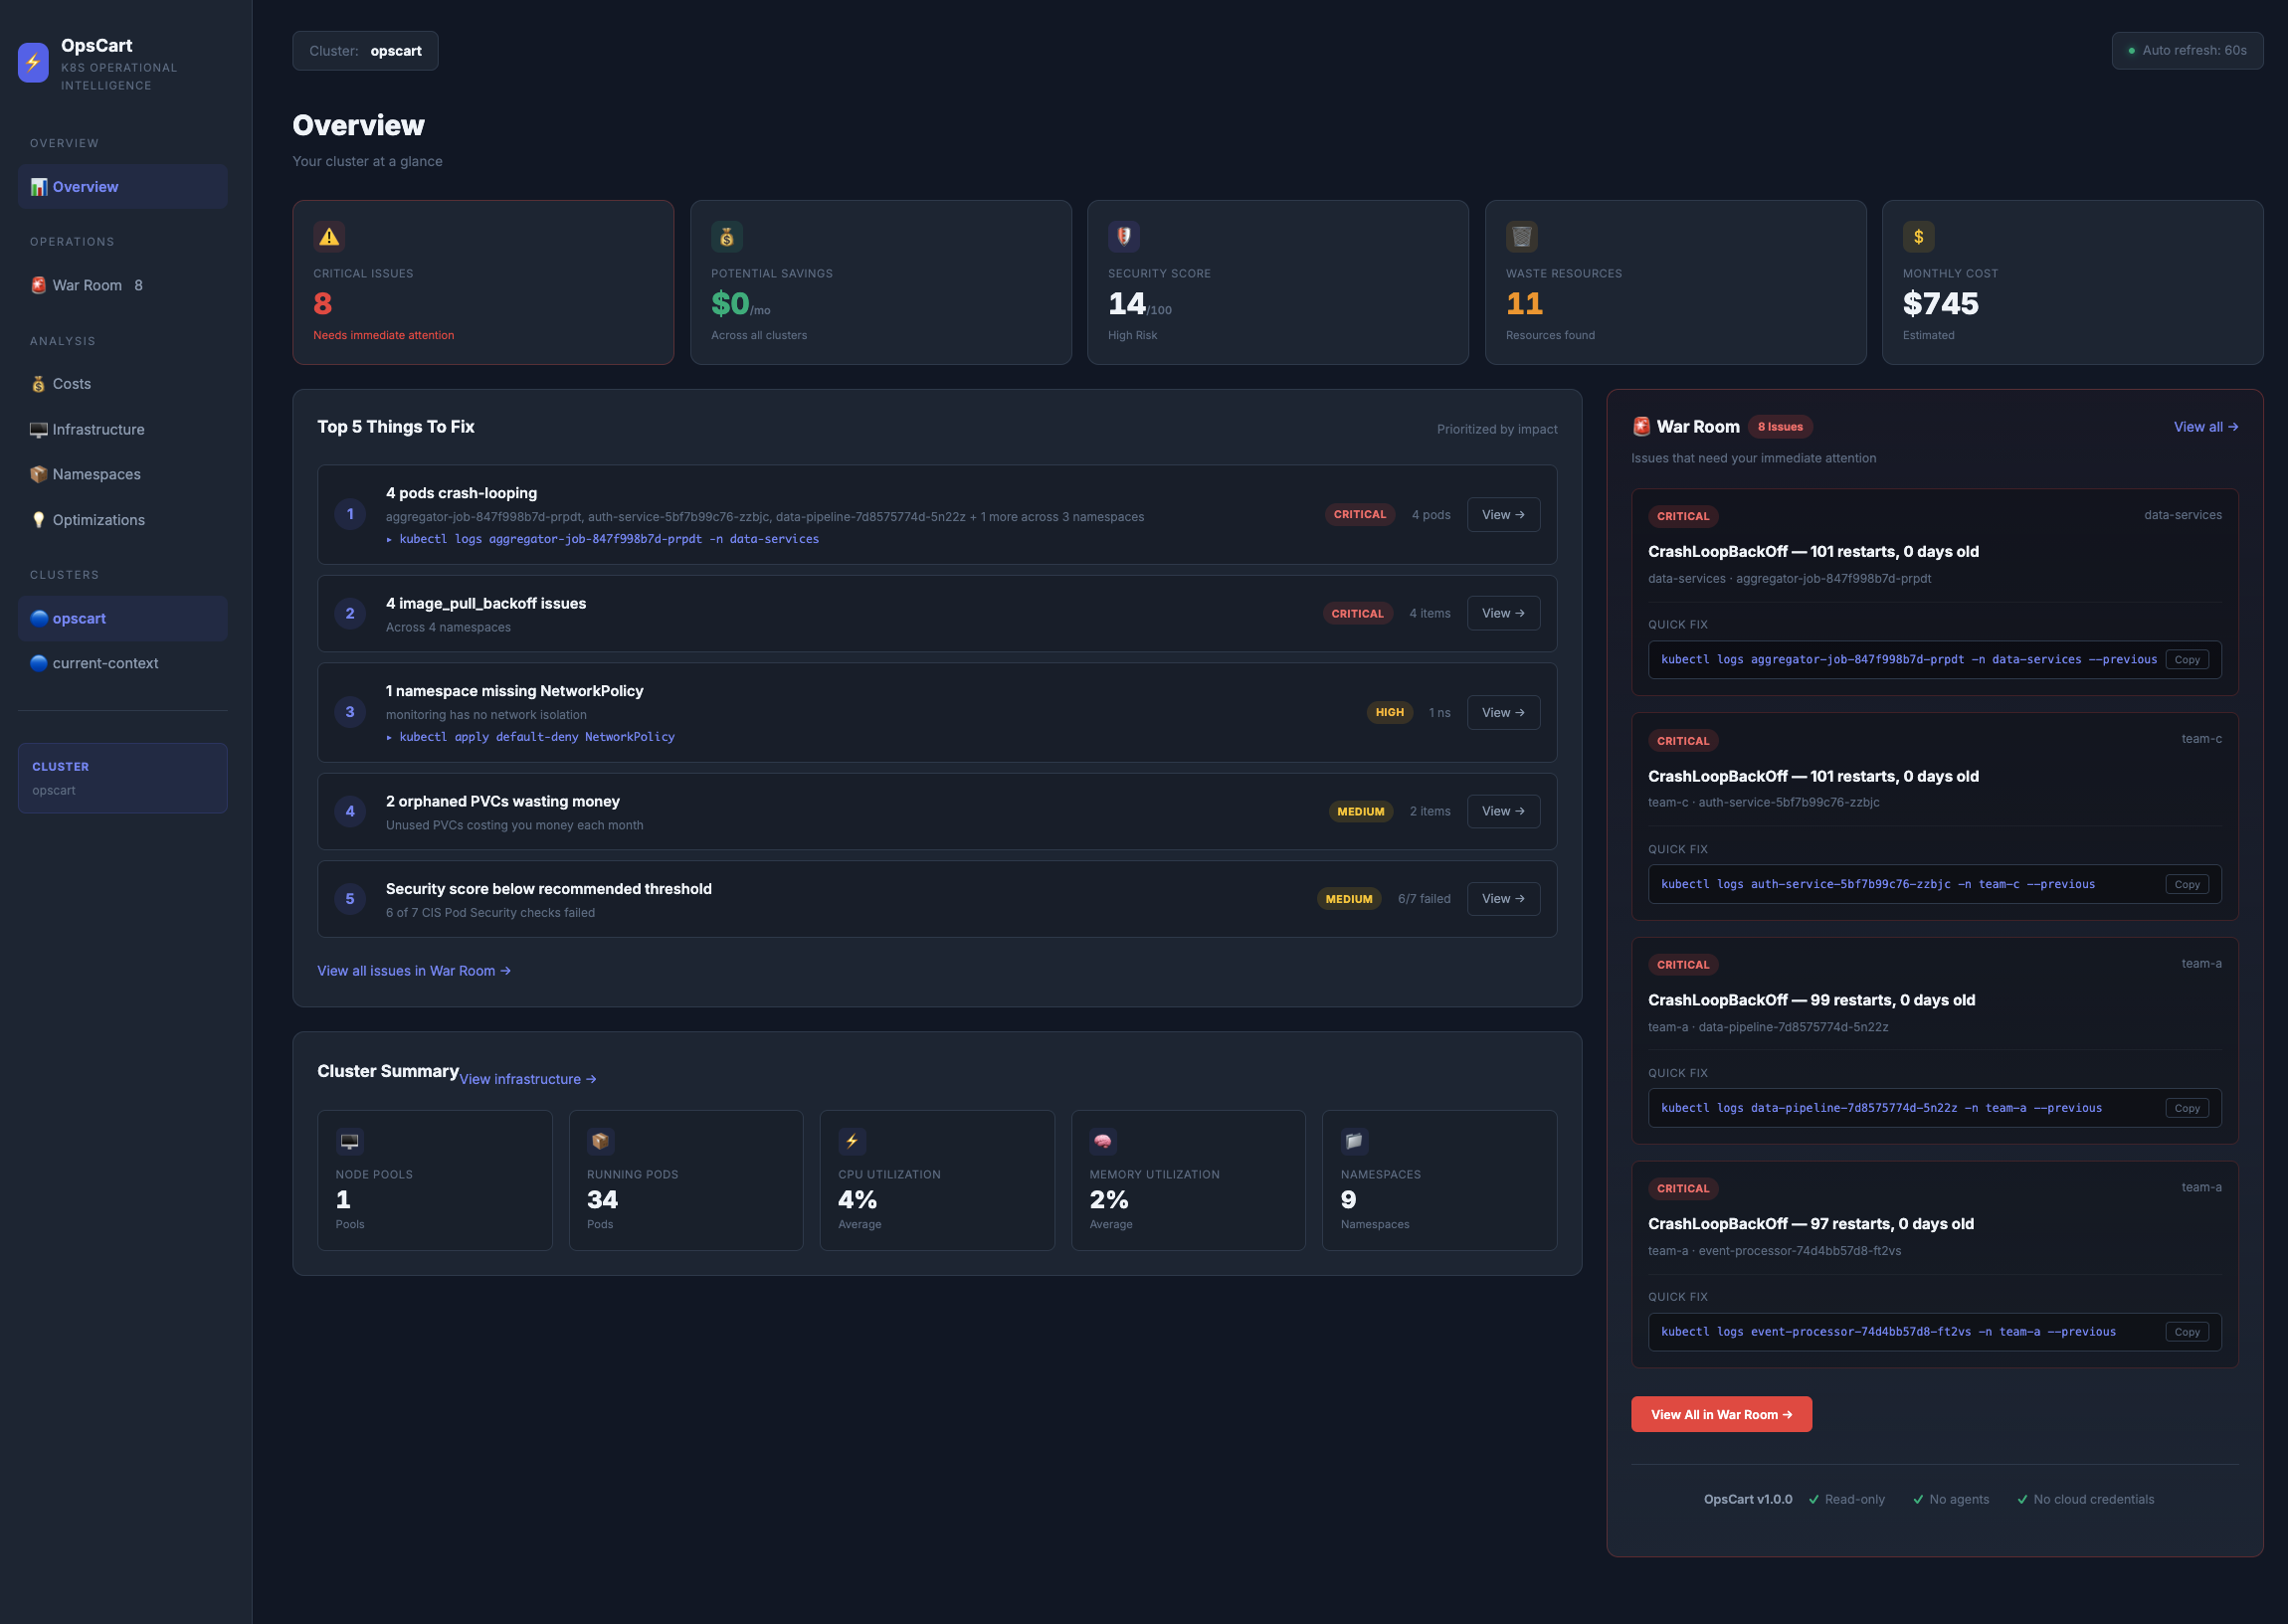
Stars: 1 | Forks: 0

# opscart-k8s-watcher **Version:** 0.6.0 **Purpose:** Production-grade Kubernetes security auditing with multi-cluster support, HTML reporting, network policy analysis, and waste detection **Focus:** CIS compliance, HTML reports, network isolation, waste detection, and multi-cluster analysis ## Important Disclaimer **This is a security awareness and troubleshooting tool - NOT for:** - Compliance auditing (use kube-bench for CIS compliance) - Financial decision-making (consult cloud architects for cost analysis) - Production security decisions (consult security professionals) **What it IS for:** - Quick security posture checks - Multi-cluster health monitoring - Resource optimization opportunities - War room troubleshooting - Executive-ready HTML reports ## What's New in v0.5.2 ### HTML Reports for Waste Detection The `waste` command now supports HTML output alongside CLI format. # Generate HTML report (same professional format as security reports) ./opscart-scan waste --cluster prod --format html # CLI output (default - unchanged) ./opscart-scan waste --cluster prod **HTML report includes:** - Visual scorecard showing all 9 waste categories at a glance - Color-coded severity (red=critical, orange=warning, blue=success) - Detailed findings with kubectl investigation commands - Separate "Housekeeping" section for Old ReplicaSets (not counted in total) - Kubernetes blue theme for professional/corporate environments Reports saved to: `reports/YYYY-MM-DD/opscart-waste-HHMM.html` ## What's New in v0.5 ### Waste & Drift Detection (`waste` command) Detects forgotten, idle, and orphaned resources. **Suggestions only - never modifies the cluster.** - **Abandoned namespaces** - Old namespaces with no running pods (`dev-john`, `test-2024`, `poc-ai`) - **Zombie pods** - CrashLoopBackOff, ImagePullBackOff, OOMKilled for days - **Unmanaged pods** - Bare pods with no controller (forgotten `kubectl run` sessions) - **Orphaned PVCs** - Unbound, released, or bound-but-no-pod (silent storage cost leaks) - **Stale Jobs/CronJobs** - Completed jobs not cleaned up, CronJobs that never ran, no history limits set - **Zero-replica workloads** - Deployments and StatefulSets scaled to 0 - **Old ReplicaSets** - Leftover rollout artifacts accumulating over time - **Services with no endpoints** - LoadBalancers flagged with cloud cost warning - **Broken Ingresses** - Backends pointing to services with no endpoints - **Misconfigured HPAs** - Scaling disabled or always stuck at minReplicas Every finding includes: observed data, reason it's suspicious, and a `kubectl` command to investigate. ./opscart-scan waste --cluster prod # default: 7+ days old ./opscart-scan waste --cluster prod --min-age-days 30 # stricter threshold ./opscart-scan waste --cluster prod --namespace staging # single namespace ./opscart-scan waste --all-clusters --min-age-days 14 # all clusters ./opscart-scan waste --cluster CLUSTER 2>/dev/null # Corporate clusters: suppress harmless klog warnings ## Troubleshooting ### Corporate Cluster Warnings When scanning corporate AKS/EKS clusters, you may see Kubernetes client library warnings: W0217 11:00:42.760152 warnings.go:70] Use tokens from the TokenRequest API... **Workaround:** Redirect stderr to suppress these warnings (they're harmless): ./opscart-scan waste --cluster CLUSTER 2>/dev/null ./opscart-scan network --cluster CLUSTER 2>/dev/null ./opscart-scan security --cluster CLUSTER 2>/dev/null These warnings come from the Kubernetes client library (`klog`) and don't affect functionality. **Example scorecard:** WASTE SCORECARD 🔴 Abandoned Namespaces: 1 🔴 Zombie Pods (CrashLoop/OOM): 2 🔴 Unmanaged Pods (no controller): 1 ✅ Orphaned PVCs: 0 🟢 Old ReplicaSets: 2 🟢 Misconfigured HPAs: 1 Total waste items found: 7 ## What's New in v0.4 ### Network Policy Detection - **Namespace coverage analysis** - Which namespaces have NetworkPolicies and which don't - **Smart infrastructure filtering** - Auto-skips system namespaces using 3 strategies (no manual list needed): - **Pattern-based** - Covers `kube-*`, `istio-*`, `calico-*`, `tigera-*`, `cert-manager`, `ingress-nginx`, `flux-system`, `argocd`, `velero`, `longhorn-*`, `cattle-*`, `openshift-*`, `gke-*`, `azure-*`, `karpenter`, `crossplane-*` - **Label-based** - Detects `pod-security.kubernetes.io/enforce=privileged` system namespaces - **User-defined** - `--skip-namespaces ns1,ns2` for anything not covered by patterns - **Risk-based sorting** - HIGH risk (production/staging) shown first, sorted by pod count - **Coverage percentage bar** - Visual indicator of cluster-wide policy coverage - **Default-deny template** - Ready-to-apply kubectl policy in recommendations - **Multi-cluster support** - Works with `--all-clusters` and `--cluster-group` # Scan single cluster ./opscart-scan network --cluster prod # All clusters ./opscart-scan network --all-clusters # Cluster group ./opscart-scan network --cluster-group production # Skip additional namespaces not covered by auto-detection ./opscart-scan network --cluster prod --skip-namespaces monitoring,vault # Specific namespace only ./opscart-scan network --cluster prod --namespace production **Example output:** NETWORK POLICY SUMMARY Total Namespaces: 8 Protected (policies): 0 Unprotected (no policy): 8 High Risk Namespaces: 3 Coverage: [░░░░░░░░░░░░░░░░░░░░░░░░░░░░░░░░░░░░░░░░] 0% 🔴 Poor 🔴 UNPROTECTED NAMESPACES (sorted by risk): 🔴 [PROD] production (10 pods) - HIGH RISK 🔴 [SYS] monitoring (5 pods) - HIGH RISK 🔴 [STAGE] staging (3 pods) - HIGH RISK 🟢 [DEV] development (2 pods) - LOW RISK ## What's New in v0.3 ### HTML Report Generation - **Security HTML Reports** - Professional security audit reports with CIS compliance scoring - **Comprehensive HTML Reports** - Full cluster health reports with real security data - **Date-organized storage** - Reports auto-organized as `reports/YYYY-MM-DD/` - **Real data extraction** - All reports use actual cluster data (validated against kubectl) ### Enhanced Security Reporting - **Deduplicated pod names** - Shows "pod-name (4 issues)" for multiple issues per pod - **Top 5 affected resources** per finding type - **Recommended actions** in priority order - **Validation steps** for remediation - **Issue count breakdown** table - **Validated accuracy** - All counts match kubectl queries exactly ### Helper Scripts - `scripts/view-latest.sh` - Open most recent report in browser - `scripts/cleanup-reports.sh` - Remove old reports (configurable retention) - `scripts/daily-reports.sh` - Generate reports for all clusters ### New Commands # Security HTML report ./opscart-scan security --cluster prod --format=html # Security HTML for all clusters ./opscart-scan security --all-clusters --format=html # Comprehensive cluster report ./opscart-scan report --cluster prod --monthly-cost 5000 # Comprehensive report for cluster group ./opscart-scan report --cluster-group production --monthly-cost 50000 ## Features ### 🗑️ Waste & Drift Detection (v0.5) - **9 resource types** - namespaces, pods, PVCs, jobs, deployments, ReplicaSets, services, ingresses, HPAs - **Data-driven findings** - every result shows observed data, not assumptions - **Smart filtering** - auto-skips infrastructure namespaces (same patterns as `network` command) - **Configurable threshold** - `--min-age-days` (default: 7) - **HTML reports** - `--format html` for visual dashboards (v0.5.2) - **Suggestions only** - never modifies the cluster ### 🌐 Network Policy Detection (v0.4) - **Namespace coverage analysis** - Protected vs unprotected namespaces - **Smart infrastructure filtering** - Auto-skips 15+ known infrastructure patterns - **Risk-based prioritization** - HIGH/LOW risk with clear reasoning per namespace - **Actionable output** - Ready-to-apply kubectl default-deny policy template - **User-defined skip list** - `--skip-namespaces` for custom infrastructure namespaces ### 📊 HTML Reports (v0.3) - **Security Reports** - CIS compliance, findings, remediation steps - **Comprehensive Reports** - Security + resources + cost analysis - **Date-organized storage** - Easy archival and retention management - **Professional templates** - Executive-ready presentations ### Security Auditing - **CIS Kubernetes Benchmark scoring** (Pod Security subset) - **8 security check types** - Validated against kubectl - **Environment-aware analysis** (PRODUCTION vs DEVELOPMENT) - **Actionable remediation steps** **Checks performed:** - Privileged containers (CIS 5.2.1) - Host namespace sharing (CIS 5.2.2-5.2.4) - Root containers (CIS 5.2.6) - Privilege escalation - Resource limits - Security contexts - Service account usage - Added capabilities ### Emergency Scanner - Crash looping pods - Pending pods - Image pull failures - High restart counts ### Cost Analysis (v0.6.0) ./opscart-scan costs --cluster CLUSTER ./opscart-scan costs --cluster CLUSTER --monthly-cost 8500 ./opscart-scan costs --cluster CLUSTER --breakdown deployment ./opscart-scan costs --cluster CLUSTER --monthly-cost 8500 --breakdown deployment --format html ./opscart-scan costs --cluster CLUSTER --format json ### Resource Search - Find resources by type (pod, deployment, service) - Filter by name pattern or status - Multi-cluster search support ## Installation # Clone repository git clone https://github.com/opscart/opscart-k8s-watcher.git cd opscart-k8s-watcher # Checkout v0.6.0 git checkout v0.6.0 # Build go build -o opscart-scan cmd/opscart-scan/main.go # Initialize config for multi-cluster ./opscart-scan config init # Run ./opscart-scan --help ## Quick Start ### 1. Configure Clusters (v0.2) # Initialize cluster config ./opscart-scan config init # Shows your kubeconfig clusters and lets you organize them into groups # Creates: ~/.opscart/clusters.yaml # View configuration ./opscart-scan config show ### 2. Security Audit **CLI Output:** # Single cluster ./opscart-scan security --cluster prod # All clusters ./opscart-scan security --all-clusters # By cluster group ./opscart-scan security --cluster-group production **HTML Report (v0.3):** # Single cluster HTML report ./opscart-scan security --cluster prod --format=html # Output: reports/2026-02-05/prod-security-1430.html # All clusters HTML reports ./opscart-scan security --all-clusters --format=html # Output: reports/2026-02-05/prod-security-1430.html # reports/2026-02-05/staging-security-1431.html # reports/2026-02-05/dev-security-1432.html **HTML Report Includes:** - CIS compliance score with progress bar (e.g., 41/100) - Pods scanned and issues found (e.g., 47 pods, 181 issues) - Deduplicated pod names (e.g., "kube-apiserver (4 issues)") - Critical findings and warnings - Recommended actions in priority order - Validation steps - Issue count breakdown table ### 3. Comprehensive Cluster Report (v0.3) # Full HTML report (security + resources + cost) ./opscart-scan report --cluster prod --monthly-cost 5000 # Output: reports/2026-02-05/prod-report-1431.html # All clusters ./opscart-scan report --all-clusters --monthly-cost 50000 **Comprehensive Report Includes:** - Real CIS security score (e.g., 41/100 from actual cluster scan) - Security findings with pod counts (3 privileged, 31 hostPath, etc.) - Cost analysis and potential savings ($1,200-$1,800/month) - Overall health score - Professional HTML template **Note:** v0.4 will add per-namespace breakdown and resource metrics to match CLI detail level. ### 4. Compare Clusters (v0.2) # Compare two clusters side-by-side ./opscart-scan security --compare=prod,staging # Shows: # - CIS score difference # - Issue count deltas # - Environment-specific findings ### 5. Network Policy Analysis (v0.4) # Check network isolation across all namespaces ./opscart-scan network --cluster prod # All clusters ./opscart-scan network --all-clusters # Skip namespaces not caught by auto-detection ./opscart-scan network --cluster prod --skip-namespaces monitoring,vault ### 6. Waste & Drift Detection (v0.5) # Detect forgotten/idle/orphaned resources (default: 7+ days old) ./opscart-scan waste --cluster prod # Generate HTML report (v0.5.2) ./opscart-scan waste --cluster prod --format html # Adjust age threshold ./opscart-scan waste --cluster prod --min-age-days 30 # Focus on specific namespace ./opscart-scan waste --cluster prod --namespace staging # All clusters ./opscart-scan waste --all-clusters --min-age-days 14 ## Commands ### Config Management (v0.2) # Initialize cluster configuration ./opscart-scan config init # Show current configuration ./opscart-scan config show ### Security Audit # CLI output (default) ./opscart-scan security --cluster CLUSTER # HTML report (NEW in v0.3) ./opscart-scan security --cluster CLUSTER --format=html # JSON output ./opscart-scan security --cluster CLUSTER --format=json # All clusters ./opscart-scan security --all-clusters # Cluster group ./opscart-scan security --cluster-group production # Compare two clusters ./opscart-scan security --compare=prod,staging ### Comprehensive Report (NEW in v0.3) # HTML report (default) ./opscart-scan report --cluster CLUSTER --monthly-cost 5000 # JSON report ./opscart-scan report --cluster CLUSTER --format=json # CSV report ./opscart-scan report --cluster CLUSTER --format=csv # All clusters ./opscart-scan report --all-clusters --monthly-cost 50000 # Cluster group ./opscart-scan report --cluster-group production --monthly-cost 50000 ### Waste & Drift Detection (NEW in v0.5) ./opscart-scan waste --cluster CLUSTER ./opscart-scan waste --cluster CLUSTER --format html # HTML report (v0.5.2) ./opscart-scan waste --cluster CLUSTER --min-age-days 30 ./opscart-scan waste --cluster CLUSTER --namespace NAMESPACE ./opscart-scan waste --all-clusters ./opscart-scan waste --cluster-group production --min-age-days 14 ### Network Policy Analysis (NEW in v0.4) # Scan single cluster ./opscart-scan network --cluster CLUSTER # All clusters ./opscart-scan network --all-clusters # Cluster group ./opscart-scan network --cluster-group production # Specific namespace only ./opscart-scan network --cluster CLUSTER --namespace production # Skip namespaces not auto-detected ./opscart-scan network --cluster CLUSTER --skip-namespaces monitoring,vault ### Other Commands # Resource analysis ./opscart-scan resources --cluster CLUSTER # Cost analysis ./opscart-scan costs --cluster CLUSTER --monthly-cost 5000 # Emergency scan ./opscart-scan emergency --cluster CLUSTER # Find specific resources ./opscart-scan find pod --cluster CLUSTER --name nginx # Cluster snapshot ./opscart-scan snapshot --cluster CLUSTER ## Helper Scripts (v0.3) ### View Latest Report ./scripts/view-latest.sh # Opens most recent HTML report in default browser ### Cleanup Old Reports ./scripts/cleanup-reports.sh 30 # Removes reports older than 30 days ### Daily Reports for All Clusters ./scripts/daily-reports.sh # Generates security reports for all configured clusters # Useful for scheduled cron jobs: # 0 6 * * * /path/to/opscart-k8s-watcher/scripts/daily-reports.sh ## Report Storage Structure (v0.3) Reports are automatically organized by date: reports/ ├── 2026-02-05/ │ ├── prod-aks-security-1430.html │ ├── prod-aks-report-1431.html │ ├── staging-aks-security-1432.html │ └── dev-aks-security-1433.html ├── 2026-02-04/ └── 2026-02-03/ **Benefits:** - Easy archival and retention management - Clear chronological organization - Simple to find reports by date - Cleanup scripts work on date folders **Note:** `reports/` directory is in `.gitignore` ## Validating Report Accuracy (v0.3) All security counts can be validated against kubectl queries: # Validate privileged containers count kubectl get pods --all-namespaces -o json | \ jq '[.items[] | select(.spec.containers[]?.securityContext?.privileged == true)] | length' # Should match tool output: 3 # Validate host path volumes kubectl get pods --all-namespaces -o json | \ jq '[.items[] | select(.spec.volumes[]?.hostPath != null)] | length' # Should match tool output: 31 # Validate host network usage kubectl get pods --all-namespaces -o json | \ jq '[.items[] | select(.spec.hostNetwork == true)] | length' # Should match tool output: 11 # Validate missing resource limits kubectl get pods --all-namespaces -o json | \ jq -r '.items[] | select(.spec.containers[] | (.resources.limits == null or .resources.limits == {})) | "\(.metadata.namespace)/\(.metadata.name)"' | sort -u | wc -l # Should match tool output: 33 **Result:** All counts match exactly ## Use Cases ### Weekly Waste Review (v0.5) ./opscart-scan waste --all-clusters --min-age-days 30 # Finds real issues like: # - Namespace 'data-processing': 9 pods, none Running, 30 days old # - Pod 'kubernetes-dashboard': CrashLoopBackOff, 7792 restarts # - HPA 'worker': FailedGetResourceMetric - autoscaling silently broken # - Bare pod 'webtest-34210': no controller, sitting in default namespace ### Network Policy Audit (v0.4) # Weekly network isolation check across all clusters ./opscart-scan network --all-clusters # Focus on production only ./opscart-scan network --cluster-group production # Shows: # - Which namespaces have NetworkPolicies # - Risk level per namespace (HIGH/LOW) # - Ready-to-apply default-deny policy template ### Multi-Cluster Security Review (v0.2 + v0.3) # Generate HTML reports for all production clusters ./opscart-scan security --cluster-group production --format=html # Email reports to security team # Reports saved in reports/2026-02-05/ ### Cluster Health Comparison (v0.2) # Compare prod vs staging security posture ./opscart-scan security --compare=prod,staging # Shows: # - CIS score: prod 73 vs staging 45 # - Critical issues: prod 2 vs staging 8 # - Recommendations for staging improvements ### Executive Dashboard (v0.3) # Monthly comprehensive reports for all clusters ./opscart-scan report --all-clusters --monthly-cost 100000 # Generates professional HTML reports showing: # - Overall security posture across all clusters # - Cost optimization opportunities # - Potential savings aggregated ### CI/CD Security Gate # Gate deployment based on security score SCORE=$(./opscart-scan security --cluster staging --format=json | jq '.cis_score') if [ $SCORE -lt 60 ]; then echo "Security score too low: $SCORE" exit 1 fi ## Configuration File After running `config init`, clusters are stored in `~/.opscart/clusters.yaml`: clusters: - name: prod-aks-01 context: prod-aks-01-context groups: - production - critical - name: staging-aks context: staging-aks-context groups: - staging - name: dev-local context: minikube groups: - development This enables powerful multi-cluster workflows with `--all-clusters` and `--cluster-group`. ## Cost Analysis — How It Works ### Formula weighted_share(ns) = (CPU% + Mem%) / 2 namespace_cost = weighted_share × total_cluster_cost deployment_share = (dep_CPU / ns_CPU + dep_Mem / ns_Mem) / 2 deployment_cost = deployment_share × namespace_cost ### Confidence Scoring | Signal | High | Medium | Low | |---|---|---|---| | Share size | ≥ 10% | 3–10% | < 3% | | Pod count | ≥ 10 pods | 3–9 pods | < 3 pods | | Waste score penalty | > 60 → −2 | > 35 → −1 | — | ### System Namespace Exclusions `kube-system`, `kube-public`, `kube-node-lease`, `cert-manager`, `istio-system`, `istio-operator`, `monitoring`, `prometheus`, `grafana`, `logging`, `flux-system`, `argocd`, `velero`, `ingress-nginx`, `calico-*`, `tigera-*`, `longhorn-*` ### Phase 2 (Planned) - Azure Cost Management API — real monthly billing per cluster - Snapshot storage — dated cost snapshots for trend analysis - Multi-cluster aggregation — single dashboard across all clusters ## Version History ### v0.6.0 (May 2026) — Current - `costs` command production-ready with FinOps-grade output - Resource-share mode — no monthly cost required - `--breakdown deployment` — CLI tree + HTML sub-rows - HTML dashboard: KPI cards, share bars, waste score bars, scenario cards - Unallocated row reconciling namespace allocations vs cluster total - Removed spot scenarios; added right-sizing, idle workload, consolidation - System namespaces excluded from recommendations and breakdown - Idle pod detection: allows up to 5 restarts (init churn tolerated) - Confidence scoring: 3-signal model (share + pod count + waste) - Waste score bar replaces emoji in HTML ### v0.5.2 (Current - February 2026) **HTML Reports for Waste Detection:** - `--format html` flag for waste command - Visual scorecard with all 9 waste categories - Color-coded severity (red/orange/blue Kubernetes theme) - Detailed findings with kubectl commands - Old ReplicaSets shown separately (not counted in total) - Same professional format as security reports ### v0.5.1 (February 2026) **Bug Fixes:** - Fixed context cancellation leak in waste detector - Fixed PVC detection failing when pod listing errors - Fixed HPA detection on older Kubernetes clusters (< 1.23) - Added v1 HPA API fallback ### v0.5 (February 2026) **Waste & Drift Detection:** - `waste` command - detects forgotten, idle, and orphaned resources across 9 types - Abandoned namespaces, zombie pods, unmanaged bare pods - Orphaned PVCs, stale jobs, zero-replica workloads, old ReplicaSets - Services with no endpoints, broken ingresses, misconfigured HPAs - Data-driven findings with kubectl investigation commands - Smart infrastructure namespace filtering (same patterns as `network` command) - Configurable age threshold (`--min-age-days`, default: 7) - Suggestions only - never modifies the cluster ### v0.4 (February 2026) **Network Policy Detection:** - Namespace coverage analysis (protected vs unprotected) - Smart infrastructure filtering - auto-skips 15+ patterns (`kube-*`, `istio-*`, `calico-*`, `tigera-*`, `cert-manager`, `ingress-nginx`, `flux-system`, `argocd`, `velero`, `longhorn-*`, `cattle-*`, `openshift-*`, `gke-*`, `azure-*`, `karpenter`, `crossplane-*`) - Label-based detection (`pod-security.kubernetes.io/enforce=privileged`) - User-defined skip list via `--skip-namespaces` - Risk-based sorting (HIGH/LOW) with clear reasoning - Coverage percentage bar - Ready-to-apply default-deny policy template in recommendations - Full multi-cluster support ### v0.3 (February 2026) **HTML Report Generation:** - Security HTML reports with CIS scoring - Comprehensive cluster reports with real data - Date-organized storage (reports/YYYY-MM-DD/) - Helper scripts (view-latest, cleanup, daily-reports) **Enhanced Security Reporting:** - Deduplicated pod names with issue counts - Top 5 affected resources per finding - Recommended actions and validation steps - Validated accuracy against kubectl **Format Separation:** - Separate `securityFormat` and `reportFormat` variables - Security defaults to CLI table output - Report defaults to HTML output ### v0.1 (Initial Release) **Security Improvements:** - Removed unvalidated financial risk calculations - Added CIS Kubernetes Benchmark scoring - Environment-aware recommendations - Specific resource identification - Issue count validation ## Roadmap ### v0.7 (Next) - Azure Cost Management API integration (Phase 2 of `costs` command) - Dated cost snapshots for trend analysis - Multi-cluster cost aggregation in a single HTML dashboard ### v0.8 (Future) - Prometheus integration for actual CPU/memory utilization (not just requests) - Grafana dashboard templates - Webhook notifications (Slack, Teams, email) - Custom policy definitions - Full diff view for cluster comparison ## License MIT License - See LICENSE file for details
标签:EVTX分析