allanice001/oncall
GitHub: allanice001/oncall
开发者友好的开源值班与事件响应管理系统,支持多源告警聚合与多渠道通知。
Stars: 0 | Forks: 0
# 🚨 更新:Grafana OnCall OSS 🚨
自 2025-03-11 起,Grafana OnCall (OSS) 已进入维护模式,并将于 2026-03-24 被归档。
虽然您可以继续以当前状态使用 OnCall OSS,但不会再引入任何更新或新功能。
但是,对于 CVSS 评分为 7.0 或更高的有效 CVE,我们仍将提供关键错误的修复。
对于寻求完全支持且积极维护的替代方案的用户,
**Grafana Cloud IRM** 提供了一种现代化的 incident response 和 on-call 管理方法。
- [Grafana OnCall OSS 更新博客](https://grafana.com/blog/2025/03/11/grafana-oncall-maintenance-mode/)
- [Grafana Cloud IRM 公告博客文章](https://grafana.com/blog/2025/03/11/oncall-management-incident-response-grafana-cloud-irm/)
- [迁移指南](https://grafana.com/docs/oncall/latest/set-up/migration-from-other-tools/)
## Grafana OnCall
 [](https://github.com/grafana/oncall/releases)
[](https://github.com/grafana/oncall/blob/dev/LICENSE)
[](https://hub.docker.com/r/grafana/oncall/tags)
[](https://slack.grafana.com/)
[](https://github.com/grafana/oncall/actions/workflows/on-commits-to-dev.yml)
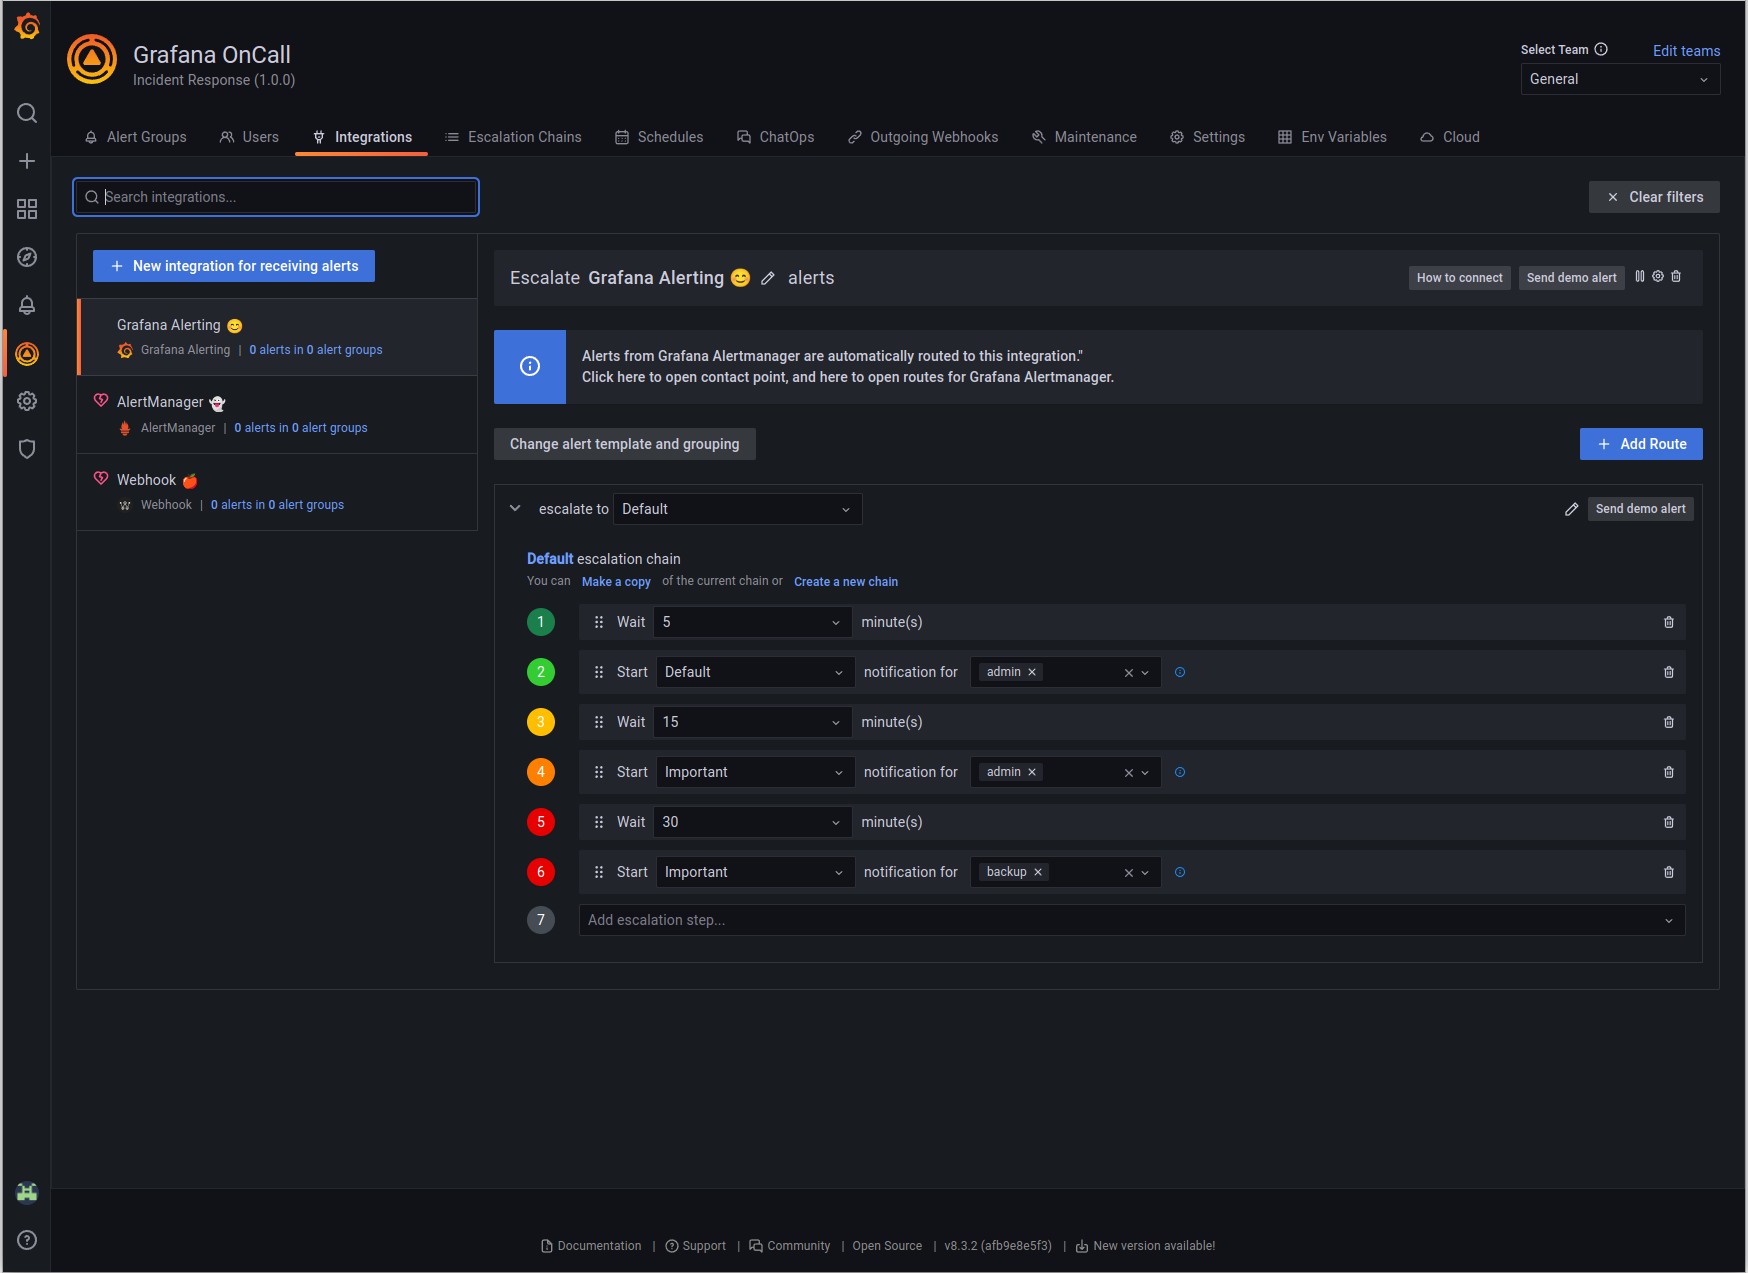
开发者友好的 incident response,具有出色的 Slack 集成。
[](https://github.com/grafana/oncall/releases)
[](https://github.com/grafana/oncall/blob/dev/LICENSE)
[](https://hub.docker.com/r/grafana/oncall/tags)
[](https://slack.grafana.com/)
[](https://github.com/grafana/oncall/actions/workflows/on-commits-to-dev.yml)
开发者友好的 incident response,具有出色的 Slack 集成。
- 收集和分析来自多个监控系统的告警
- 基于日程表的 On-call 轮换
- 自动升级
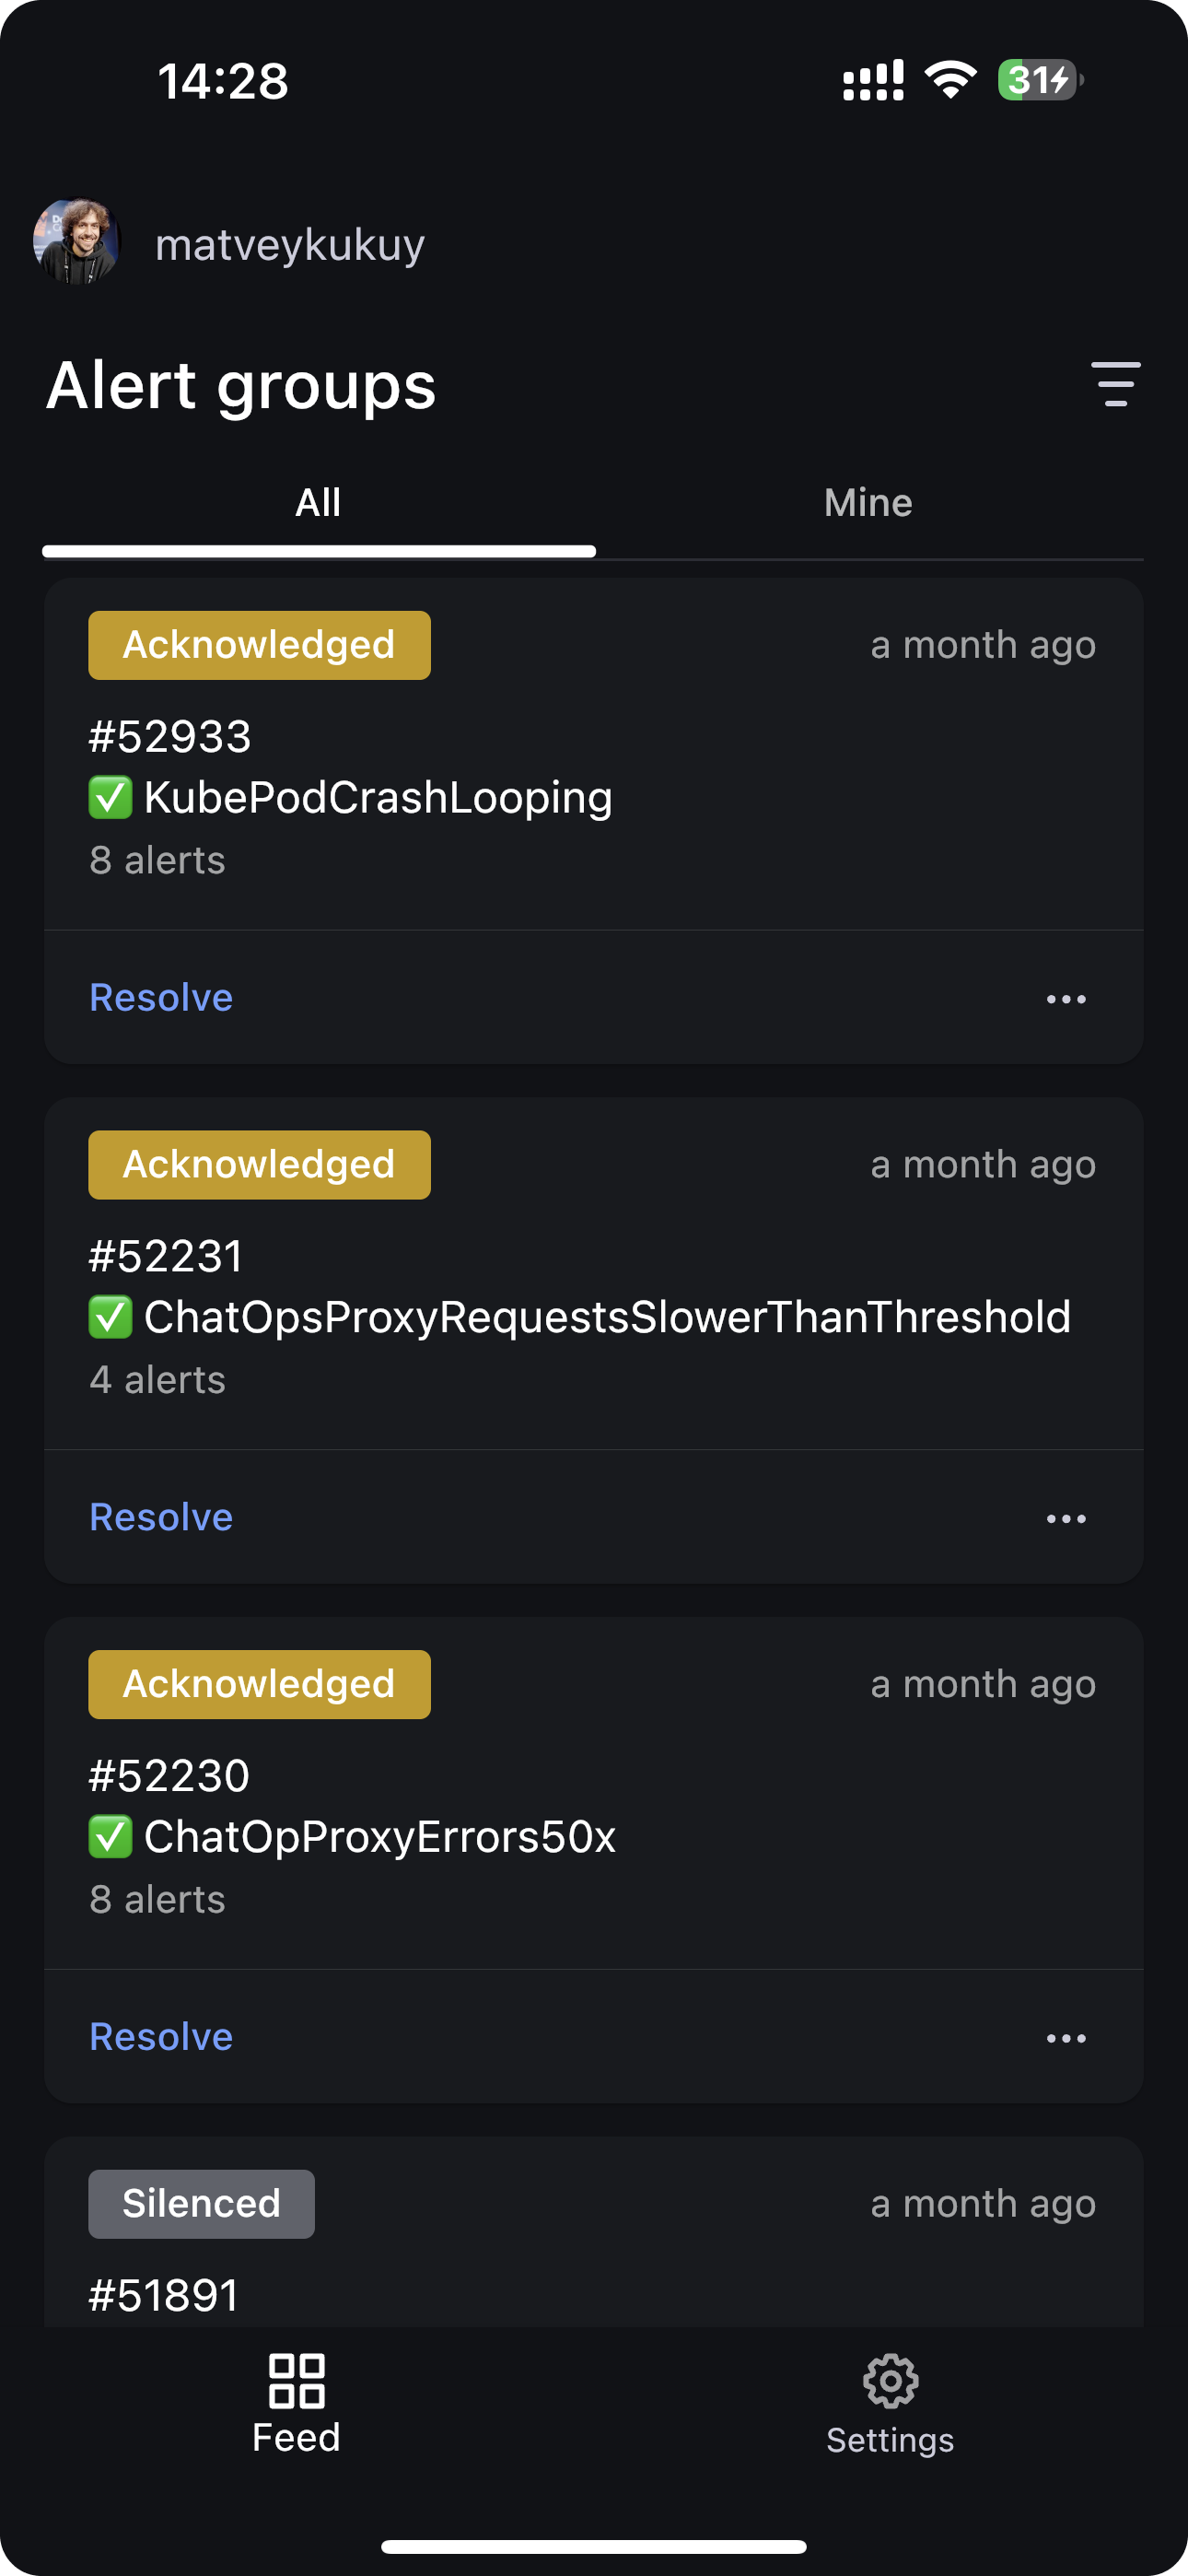
- 电话、短信、Slack、Telegram 通知
## 快速入门
我们准备了多种环境:
- [production](https://grafana.com/docs/oncall/latest/open-source/#production-environment)
- [developer](./dev/README.md)
- hobby(在以下步骤中描述)
1. 下载 [`docker-compose.yml`](docker-compose.yml):
curl -fsSL https://raw.githubusercontent.com/grafana/oncall/dev/docker-compose.yml -o docker-compose.yml
2. 设置变量:
echo "DOMAIN=http://localhost:8080
# 如果你想使用现有的 grafana,请删除下面的 'with_grafana'
# 在下面添加 'with_prometheus' 以可选地为 oncall 指标启用本地 prometheus
# 例如 COMPOSE_PROFILES=with_grafana,with_prometheus
COMPOSE_PROFILES=with_grafana
# 为 prometheus exporter 指标设置 auth token:
# PROMETHEUS_EXPORTER_SECRET=my_random_prometheus_secret
# 此外,请确保启用 /metrics 端点:
# FEATURE_PROMETHEUS_EXPORTER_ENABLED=True
SECRET_KEY=my_random_secret_must_be_more_than_32_characters_long" > .env
3. (可选)如果您想启用/设置 prometheus 指标 exporter
(除了上面的更改之外),创建一个 `prometheus.yml` 文件(相应地替换
`my_random_prometheus_secret`),放在您的 `docker-compose.yml` 旁边:
echo "global:
scrape_interval: 15s
evaluation_interval: 15s
scrape_configs:
- job_name: prometheus
metrics_path: /metrics/
authorization:
credentials: my_random_prometheus_secret
static_configs:
- targets: [\"host.docker.internal:8080\"]" > prometheus.yml
注意:您需要在 Grafana UI 中使用 `http://prometheus:9090`
作为 URL 来设置 Prometheus 数据源。
4. 启动服务:
docker-compose pull && docker-compose up -d
5. 配置插件(如果您在包含的 docker 文件之外运行 Grafana,请在这些步骤之前安装插件):
如果您使用包含的 docker compose 文件,请使用 `admin`/`admin` 凭据和 `localhost:3000` 来
执行此任务。如果您对 Grafana 进行了不同的配置,请相应调整您的凭据和主机名。
# 注意:onCallApiUrl 'engine' 和 grafanaUrl 'grafana' 使用 docker compose 文件中的名称。如果您
# 使用其他主机名运行您的 grafana 或 oncall engine 实例,请相应调整。
curl -X POST 'http://admin:admin@localhost:3000/api/plugins/grafana-oncall-app/settings' -H "Content-Type: application/json" -d '{"enabled":true, "jsonData":{"stackId":5, "orgId":100, "onCallApiUrl":"http://engine:8080", "grafanaUrl":"http://grafana:3000"}}'
curl -X POST 'http://admin:admin@localhost:3000/api/plugins/grafana-oncall-app/resources/plugin/install'
6. 开始使用 OnCall,使用上面定义的凭据
登录 Grafana:`admin`/`admin`
7. 享受吧!如果您想通过 Grafana Cloud 设置
Slack、Telegram、Twilio 或 SMS/通话,请查看我们的 [OSS 文档](https://grafana.com/docs/oncall/latest/open-source/)。
## 故障排除
这里有一些 API 调用,可以在您难以连接 Grafana 和 OnCall 时提供帮助。
(修改参数以匹配您的凭据和环境)
```
# 使用此选项获取关于 Grafana 与 OnCall 之间连接的更多信息
curl -X GET 'http://admin:admin@localhost:3000/api/plugins/grafana-oncall-app/resources/plugin/status'
```
```
# 如果您添加了用户或更改了权限,但未在 OnCall 中显示,您可以手动触发同步。
# 注意:应用加载(页面加载/刷新)时会自动调用此操作,但存在 5 分钟的超时限制,以
# 避免产生不必要的活动。
curl -X POST 'http://admin:admin@localhost:3000/api/plugins/grafana-oncall-app/resources/plugin/sync'
```
## 更新版本
要更新您的 Grafana OnCall hobby 环境:
```
# 更新 Docker 镜像
docker-compose pull engine
# 重新部署
docker-compose up -d
```
更新 engine 后,您还需要在 [插件版本页面](http://localhost:3000/plugins/grafana-oncall-app?page=version-history) 上点击“Update”按钮。
有关更新 Grafana 插件的更多信息,请参阅
[Grafana 文档](https://grafana.com/docs/grafana/latest/administration/plugin-management/#update-a-plugin)。
## 加入社区
[ ](https://slack.grafana.com/)
[
](https://slack.grafana.com/)
[ ](https://community.grafana.com/)
有问题、评论或反馈?不要犹豫,[提出问题](https://github.com/grafana/oncall/issues/new/choose)!
## 随时间推移的 Stargazers
[](https://starchart.cc/grafana/oncall)
## 延伸阅读
- _从其他 on-call 工具自动迁移_ - [Migrator](https://github.com/grafana/oncall/tree/dev/tools/migrators)
- _文档_ - [Grafana OnCall](https://grafana.com/docs/oncall/latest/)
- _概述网络研讨会_ - [YouTube](https://www.youtube.com/watch?v=7uSe1pulgs8)
- _如何添加集成_ - [如何添加集成](https://github.com/grafana/oncall/tree/dev/engine/config_integrations/README.md)
- _博客文章_ - [宣布推出 Grafana OnCall,最简单的 on-call 管理方法](https://grafana.com/blog/2021/11/09/announcing-grafana-oncall/)
- _演示_ - [深入了解用于告警和 on-call 管理的 Grafana、Prometheus 和 Alertmanager 技术栈](https://grafana.com/go/observabilitycon/2021/alerting/?pg=blog)
](https://community.grafana.com/)
有问题、评论或反馈?不要犹豫,[提出问题](https://github.com/grafana/oncall/issues/new/choose)!
## 随时间推移的 Stargazers
[](https://starchart.cc/grafana/oncall)
## 延伸阅读
- _从其他 on-call 工具自动迁移_ - [Migrator](https://github.com/grafana/oncall/tree/dev/tools/migrators)
- _文档_ - [Grafana OnCall](https://grafana.com/docs/oncall/latest/)
- _概述网络研讨会_ - [YouTube](https://www.youtube.com/watch?v=7uSe1pulgs8)
- _如何添加集成_ - [如何添加集成](https://github.com/grafana/oncall/tree/dev/engine/config_integrations/README.md)
- _博客文章_ - [宣布推出 Grafana OnCall,最简单的 on-call 管理方法](https://grafana.com/blog/2021/11/09/announcing-grafana-oncall/)
- _演示_ - [深入了解用于告警和 on-call 管理的 Grafana、Prometheus 和 Alertmanager 技术栈](https://grafana.com/go/observabilitycon/2021/alerting/?pg=blog)
[](https://github.com/grafana/oncall/releases)
[](https://github.com/grafana/oncall/blob/dev/LICENSE)
[](https://hub.docker.com/r/grafana/oncall/tags)
[](https://slack.grafana.com/)
[](https://github.com/grafana/oncall/actions/workflows/on-commits-to-dev.yml)
开发者友好的 incident response,具有出色的 Slack 集成。
 |
 ](https://slack.grafana.com/)
[](https://community.grafana.com/)
有问题、评论或反馈?不要犹豫,[提出问题](https://github.com/grafana/oncall/issues/new/choose)!
## 随时间推移的 Stargazers
[](https://starchart.cc/grafana/oncall)
## 延伸阅读
- _从其他 on-call 工具自动迁移_ - [Migrator](https://github.com/grafana/oncall/tree/dev/tools/migrators)
- _文档_ - [Grafana OnCall](https://grafana.com/docs/oncall/latest/)
- _概述网络研讨会_ - [YouTube](https://www.youtube.com/watch?v=7uSe1pulgs8)
- _如何添加集成_ - [如何添加集成](https://github.com/grafana/oncall/tree/dev/engine/config_integrations/README.md)
- _博客文章_ - [宣布推出 Grafana OnCall,最简单的 on-call 管理方法](https://grafana.com/blog/2021/11/09/announcing-grafana-oncall/)
- _演示_ - [深入了解用于告警和 on-call 管理的 Grafana、Prometheus 和 Alertmanager 技术栈](https://grafana.com/go/observabilitycon/2021/alerting/?pg=blog)
](https://slack.grafana.com/)
[](https://community.grafana.com/)
有问题、评论或反馈?不要犹豫,[提出问题](https://github.com/grafana/oncall/issues/new/choose)!
## 随时间推移的 Stargazers
[](https://starchart.cc/grafana/oncall)
## 延伸阅读
- _从其他 on-call 工具自动迁移_ - [Migrator](https://github.com/grafana/oncall/tree/dev/tools/migrators)
- _文档_ - [Grafana OnCall](https://grafana.com/docs/oncall/latest/)
- _概述网络研讨会_ - [YouTube](https://www.youtube.com/watch?v=7uSe1pulgs8)
- _如何添加集成_ - [如何添加集成](https://github.com/grafana/oncall/tree/dev/engine/config_integrations/README.md)
- _博客文章_ - [宣布推出 Grafana OnCall,最简单的 on-call 管理方法](https://grafana.com/blog/2021/11/09/announcing-grafana-oncall/)
- _演示_ - [深入了解用于告警和 on-call 管理的 Grafana、Prometheus 和 Alertmanager 技术栈](https://grafana.com/go/observabilitycon/2021/alerting/?pg=blog)标签:DevOps工具, Docker, Grafana, Grafana OnCall, IRM, IT运维, On-Call管理, Slack集成, Socks5代理, SRE, 事件管理, 事故响应, 偏差过滤, 即时通讯集成, 告警管理, 团队协作, 多云环境, 威胁情报, 安全防御评估, 开发者工具, 搜索引擎查询, 故障排查, 测试用例, 移动端支持, 请求拦截, 运维监控, 逆向工具