sonali-rajput/noc-ai-agent
GitHub: sonali-rajput/noc-ai-agent
基于多 LLM 智能体和 MCP 协议的 NOC 自动化告警处理与事件根因分析系统。
Stars: 2 | Forks: 0
# NOC Agent - 多 LLM 网络运营中心
一个复杂的、多 agent 系统,用于使用大语言模型 (LLM) 和模型上下文协议 (MCP) 进行自动化告警处理和事件响应。
## 🏗️ 架构
NOC Agent 实现了一种 **supervisor + 专用 agent** 模式以及**基于 MCP 的通信**:
```
Alerts → Manager Agent → Metrics Evaluation → RCA Agent → Triage Agent → Notifications
↓ ↓ ↓ ↓
MCP Servers Enrichment Analysis Ownership
```

### Agent
- **Manager Agent**:编排工作流并做出路由决策
- **Metrics Evaluation Agent**:利用指标、日志和追踪信息丰富告警
- **RCA Agent**:使用丰富后的数据执行根因分析
- **Triage Agent**:确定归属、升级和通知
### 技术栈
- **框架**:使用 LangGraph 进行工作流编排
- **LLM**:OpenAI GPT-4, Google Gemini
- **通信**:模型上下文协议 (MCP)
- **API**:支持异步的 FastAPI
- **存储**:PostgreSQL + Redis
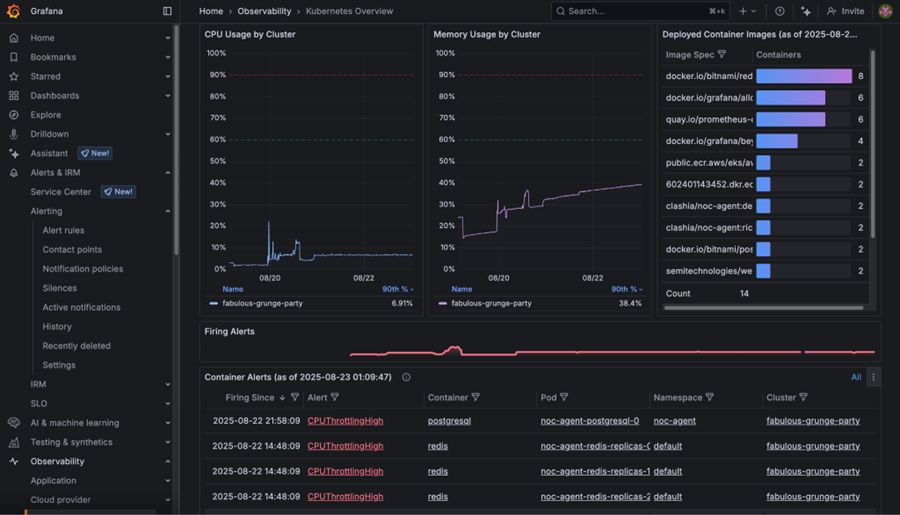
- **监控**:通过 MCP 集成 Grafana

### 逻辑架构层:
1. 核心 AI(黄色) - 系统的“大脑”
2. 集成(绿色) - 数据如何流入/流出
3. 数据(紫色) - 信息存储/处理的位置
4. 基础设施(红色) - 一切运行的所在
5. 监控(粉色) - 如何跟踪系统健康状态
## 🚀 快速开始
### 前置条件
- Python 3.11+
- Docker & Docker Compose
- OpenAI API key
- Google Gemini API key
- Grafana 实例(可选)
### 安装
1. **克隆并设置**:
```
git clone
cd noc
cp .env.example .env
```
2. **配置环境变量**:
```
# 使用你的 API keys 编辑 .env
OPENAI_API_KEY=your_openai_key
GEMINI_API_KEY=your_gemini_key
GRAFANA_URL=your_grafana_url
GRAFANA_API_KEY=your_grafana_key
```
3. **安装依赖**:
```
pip install -e .
```
### 使用 Docker Compose 运行
```
# 启动所有服务
docker-compose up -d
# 健康检查
curl http://localhost:8000/health
# 查看日志
docker-compose logs -f noc-agent
```
### 本地运行
```
# 启动依赖
docker-compose up -d redis postgres
# 安装依赖
pip install -r requirements.txt
# 启动 API server
noc-agent serve
# 或直接运行
python -m noc_agent.api.main
```
## 📝 用法
### CLI 命令
```
# 启动 API server
noc-agent serve --host 0.0.0.0 --port 8000
# 处理单个 alert
noc-agent process-alert "High CPU Usage" "CPU usage exceeded threshold" --severity high
# 测试单个 agents
noc-agent test-agents
# 显示配置
noc-agent config
```
### API Endpoint
#### 创建告警
```
curl -X POST http://localhost:8000/alerts \
-H "Content-Type: application/json" \
-d '{
"title": "High Memory Usage",
"description": "Memory usage exceeded 85%",
"severity": "high",
"source_system": "monitoring",
"source_component": "web-server-01",
"labels": {"service": "web", "team": "platform"}
}'
```
#### 检查处理状态
```
curl http://localhost:8000/alerts/{alert_id}/status
```
#### 获取告警详情
```
curl http://localhost:8000/alerts/{alert_id}
```
### 演示工作流
使用示例告警运行完整演示:
```
python examples/sample_alerts.py
```
这将:
1. 发送 5 种不同类型的告警
2. 实时监控它们的处理过程
3. 显示结果摘要
## 🔧 配置
### 环境变量
| 变量 | 描述 | 默认值 |
|----------|-------------|---------|
| `OPENAI_API_KEY` | OpenAI API key | 必需 |
| `GEMINI_API_KEY` | Google Gemini API key | 必需 |
| `GRAFANA_URL` | Grafana 实例 URL | 指标必需 |
| `GRAFANA_API_KEY` | Grafana API key | 指标必需 |
| `DATABASE_URL` | PostgreSQL 连接字符串 | 本地默认 |
| `REDIS_URL` | Redis 连接字符串 | 本地默认 |
| `LOG_LEVEL` | 日志级别 | INFO |
| `DEBUG` | 启用调试模式 | false |
### Agent 模型
配置每个 agent 使用的 LLM 模型:
```
MANAGER_AGENT_MODEL=gpt-4
METRICS_AGENT_MODEL=gemini-1.5-pro
RCA_AGENT_MODEL=gpt-4
TRIAGE_AGENT_MODEL=gpt-3.5-turbo
```
### MCP 配置
系统使用 MCP 服务器作为外部数据源:
```
{
"mcpServers": {
"staging-grafana": {
"type": "stdio",
"command": "docker",
"args": ["run", "-i", "--rm", "-e", "GRAFANA_URL", "-e", "GRAFANA_API_KEY", "mcp/grafana:latest", "-t", "stdio"],
"env": {
"GRAFANA_URL": "https://grafana.internal.example.com",
"GRAFANA_API_KEY": "your_api_key"
}
}
}
}
```
## 🔍 监控
### 健康检查
```
# API health
curl http://localhost:8000/health
# 系统指标
curl http://localhost:8000/metrics
```
### 日志记录
全程使用结构化 JSON 日志记录:
```
# 查看实时日志
docker-compose logs -f noc-agent
# 按 agent 过滤
docker-compose logs noc-agent | grep "manager"
```
### Grafana 仪表板
访问 http://localhost:3000 的 Grafana(如果使用监控配置):
- 用户名:admin
- 密码:admin
## 🧪 测试
### 单元测试
```
pytest tests/
```
### 集成测试
```
pytest tests/integration/
```
### Agent 测试
```
# 测试单个 agents
noc-agent test-agents
# 使用特定 alert 测试
python -c "
from noc_agent.agents.manager import ManagerAgent
import asyncio
async def test():
agent = ManagerAgent()
# Test implementation here
asyncio.run(test())
"
```
## 部署图

## 🔒 安全
- API key 绝不会被记录或暴露
- 所有外部通信均使用 HTTPS
- 所有 endpoint 均进行输入验证
- 已实现速率限制
- 通过环境变量进行 secret 管理
## 📊 性能
### 基准测试
每个告警的典型处理时间:
- 简单告警:5-15 秒
- 复杂告警:15-45 秒
- 严重告警:< 30 秒(已优先处理)
### 扩展
- 通过多个 API 实例进行水平扩展
- 使用 Redis 进行共享状态和排队
- 使用 PostgreSQL 进行持久化存储
- 全程异步处理
标签:AIOps, LangGraph, LLM多智能体, Model Context Protocol, 告警处理, 搜索引擎查询, 根因分析, 测试用例, 网络运营中心, 请求拦截, 逆向工具