Capsoide/LogTrace
GitHub: Capsoide/LogTrace
一个基于 ELK 栈和 immudb 的 Windows 审计日志自动化采集、实时分析与不可变存储系统,用于满足安全合规和法医取证需求。
Stars: 19 | Forks: 0
# LogTrace:Windows 审计日志监控系统
## 简介
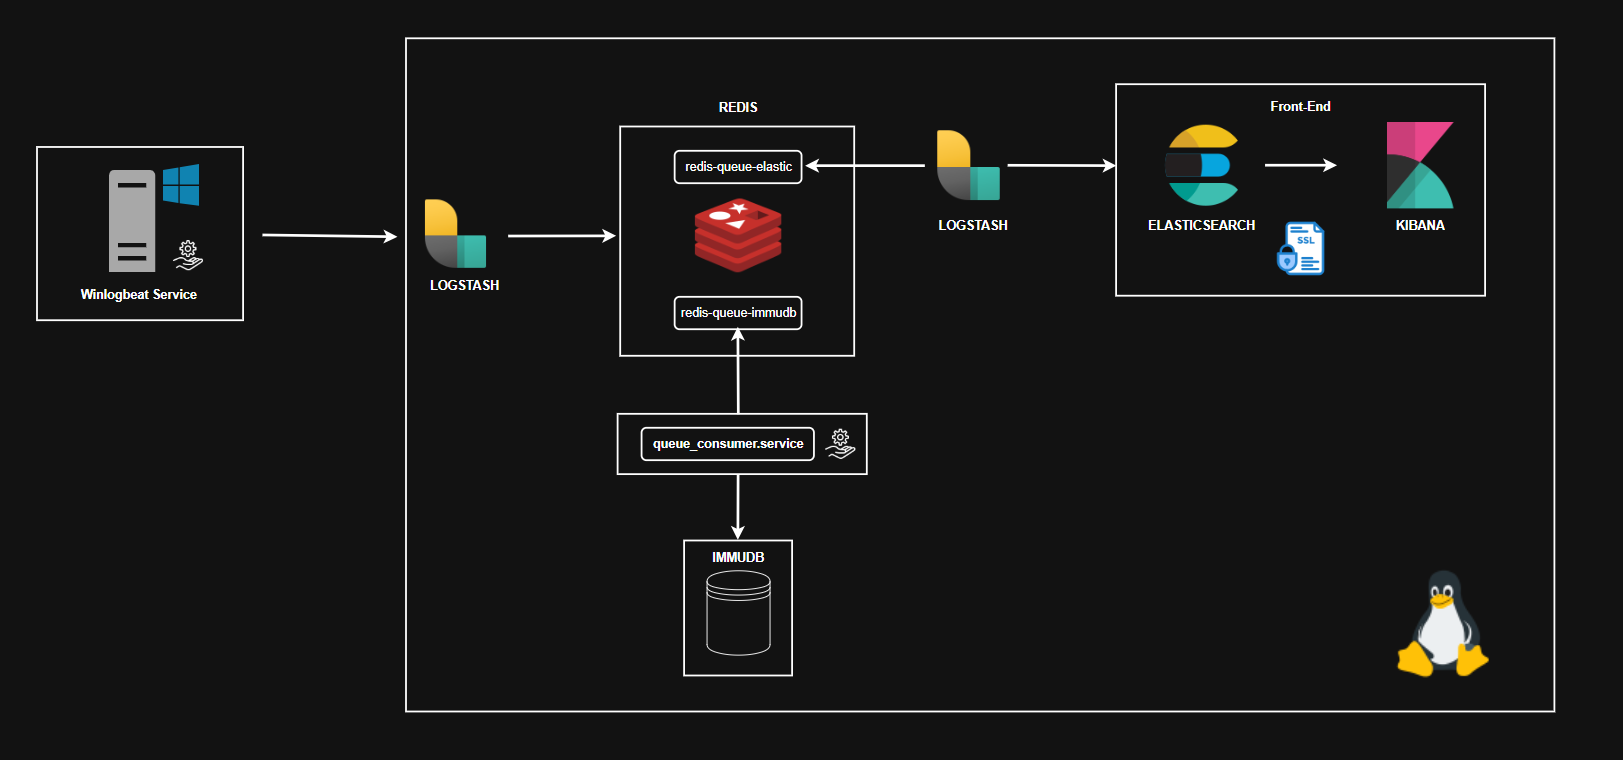
该系统负责自动采集与 Windows 系统管理员访问相关的审计日志。日志存储在不可变数据库中以确保其完整性,并通过交互式仪表板提供查询功能,便于分析和监控活动。
该流程通过以下组件组成的管道实现:
- ```Winlogbeat``` 安装在 Windows Server 实例上,负责从事件查看器收集并发送审计日志事件。
- ```Logstash``` 运行在 Debian 系统上,接收来自 Winlogbeat 的日志,将其处理后分发到两个不同的 Redis 队列。
- ```Redis``` 运行在 Debian 系统上,作为队列管理系统,实现日志流的分离:
- **队列 0**(`redis-queue-elastic`)将日志发送到 **Elasticsearch** 进行索引,并通过前端界面进行可视化。
- **队列 1**(`redis-queue-immudb`)用于将日志持久化到不可变数据库(immudb),该数据库设计用于确保完整性、不可否认性和长期保存。在此配置中,保留时间为 24 小时。
此架构确保数据复制用于不同目的(如分析和法医保存),以确保数据在时间过程中的完整性和不可篡改性。
各组件的职责如下:
- `Winlogbeat`:从事件查看器采集日志。
- `Logstash`:复制日志流并发送到相应的 Redis 队列。
- `Redis`:管理数据缓冲区。
- `Immudb`:安全且不可变地归档日志。
- `Elasticsearch`:索引和保存日志。为数据的交互分析提供后端支持。
- `Kibana`:用于搜索、可视化和监控索引日志的图形界面。
整个系统设计用于满足 **ACN**、**ISO/IEC 27001** 和 **NIS2** 指令规定的监管要求,这些指令要求对安全日志进行跟踪、保存和完整性验证:
- [**ACN**](https://www.acn.gov.it/portale/nis/aggiornamento-informazioni)(国家网络安全局)为意大利关键基础设施的安全制定了标准。
- [**ISO/IEC 27001**](https://edirama.org/wp-content/uploads/2023/10/document-1.pdf) 是信息安全管理(ISMS)的国际标准,要求记录和分析访问事件。
- [**NIS2**](https://www.acn.gov.it/portale/nis) 是欧盟关于网络和信息系统安全的指令,对基本服务运营商提出了日志记录、保存和事件响应义务。
## 基础设施架构图
 ## LogTrace 服务与网络接口映射表
| **模块** | **IP** | **端口** | **协议** | **备注** |
|---------------------------------|------------------|---------------------------------|---------------------|--------------------------------------------------------------------------|
| **Winlogbeat** | 192.168.56.2 | 5044 | TCP | 通过 Beats 模块向 Logstash 发送日志 |
| **Logstash** | 192.168.56.10 | 5044(输入),6379(输出) | TCP, Beats | 接收来自 Winlogbeat 的日志并将其复制到两个不同的 Redis 队列 |
| **Redis(Elasticsearch 队列)** | 192.168.56.10 | 6379 | TCP, RESP | Logstash 读取的队列,用于将日志发送到 Elasticsearch |
| **Redis(immudb 队列)** | 192.168.56.10 | 6379 | TCP, RESP | immudb 的复制队列(单独的键或数据库) |
| **Elasticsearch** | 192.168.56.10 | 9200(REST API),9300(传输) | HTTPS/TCP/TLS | 暴露 REST API,节点间通过内部协议通信 |
| **Kibana** | 192.168.56.10 | 5601 | HTTPS/TCP/TLS | 用于查询 Elasticsearch 的图形界面 |
| **immudb** | 192.168.56.10 | 3322(默认),9497(gRPC API) | TCP/gRPC | 从 Redis 队列读取日志以进行不可变历史化存储 |
## Windows Server → Debian 通信
本节介绍 VirtualBox Host-Only 网络的配置,用于在两台虚拟机之间建立直接通信:Windows Server(日志发送方)和 Debian(日志接收和处理方)。
## Host-Only 适配器配置(VirtualBox)
1. 打开 **VirtualBox** → `文件` → `主机网络管理器`
2. 点击 **创建** 添加新适配器
3. 配置:
- **IP**:`192.168.56.1`
- **子网掩码**:`255.255.255.0`
- **DHCP**:禁用
4. 将适配器分配给虚拟机作为 `适配器 2`:
- 模式:`Host-Only`
- 名称:例如 `vboxnet0`
## 静态 IP 配置(Windows Server)
1. 打开 `网络连接中心` > 修改 `适配器设置`
2. 选择连接到 `vboxnet0` 的接口("以太网 2")
3. 点击 `属性` > `TCP/IPv4` 并设置:
- **IP**:`192.168.56.2`
- **子网掩码**:`255.255.255.0`
- **网关**:留空
4. 使用 ```ipconfig``` 验证
```
C:\Users\vboxuser> ipconfig
Windows IP Configuration
Ethernet adapter Ethernet:
Connection-specific DNS Suffix . : xyz.lan
IPv6 Address. . . . . . . . . . . : fd00::be82:30db:2cc8:18ab
Link-local IPv6 Address . . . . . : fe80::b789:33f2:febd:1d7%14
IPv4 Address. . . . . . . . . . . : 10.0.2.15
Subnet Mask . . . . . . . . . . . : 255.255.255.0
Default Gateway . . . . . . . . . : fe80::2%14
10.0.2.2
Ethernet adapter Ethernet 2:
Connection-specific DNS Suffix . :
Link-local IPv6 Address . . . . . : fe80::6894:81ba:3678:5341%13
IPv4 Address. . . . . . . . . . . : 192.168.56.2 <---
Subnet Mask . . . . . . . . . . . : 255.255.255.0 <---
Default Gateway . . . . . . . . . :
```
## 网络接口配置(Debian)
直接修改 ```/etc/network/``` 目录下的 ```interfaces``` 文件来配置网络接口。
```
# 包含额外配置(如有)
source /etc/network/interfaces.d/*
# Loopback 接口
auto lo
iface lo inet loopback
# NAT 接口(互联网)
auto enp0s3
iface enp0s3 inet dhcp
# VirtualBox 主机专用网络(内部网络)接口
auto enp0s8
iface enp0s8 inet static
address 192.168.56.10 <---
netmask 255.255.255.0 <---
```
## 防火墙规则:允许从 Debian 到 Windows Server 的 ping
需要为 Windows Server 创建规则,因为 Windows 防火墙默认阻止传入的 ICMP Echo Request(ping)数据包。
### 分步操作
#### 1. 打开 Windows Defender 高级安全防火墙
```
Premere il tasto Windows, digitare "Windows Defender Firewall with Advanced Security", successivamente aprire l’app.
```
#### 2. 选择"入站规则"
```
Nel pannello a sinistra, cliccare su Inbound Rules.
```
#### 3. 创建新规则
```
Nel pannello a destra, cliccare su New Rule... (Nuova regola).
```
#### 4. 选择规则类型
```
Selezionare Custom (Personalizzata), poi cliccare su Avanti.
```
#### 5. 选择协议
```
Alla voce “Protocol and Ports” (Protocollo e porte), scegliere ICMPv4 dal menu a tendina “Protocol type”.
```
#### 6. 指定 ICMP 数据包类型
```
Cliccare sul pulsante Customize accanto a ICMP Settings.
Selezionare Echo Request (il tipo usato dal ping).
Confermare con OK.
```
#### 7. IP 地址
```
Nella schermata “Scope” lasciare l’opzione “Any IP address” (qualsiasi indirizzo) sia per origine sia per destinazione (, o limita all’IP del Debian se si vuole maggiore sicurezza).
```
#### 8. 规则操作
```
Selezionare Allow the connection (Consenti la connessione).
```
#### 9. 规则应用时机
```
Spuntare tutte le caselle: Domain, Private, Public.
```
#### 10. 为规则命名
```
Scrivere un nome tipo "Consenti ping ICMP Echo Request" e confermare.
```
### 验证
```
vboxuser@vbox:~$ ip link
1: lo:
## LogTrace 服务与网络接口映射表
| **模块** | **IP** | **端口** | **协议** | **备注** |
|---------------------------------|------------------|---------------------------------|---------------------|--------------------------------------------------------------------------|
| **Winlogbeat** | 192.168.56.2 | 5044 | TCP | 通过 Beats 模块向 Logstash 发送日志 |
| **Logstash** | 192.168.56.10 | 5044(输入),6379(输出) | TCP, Beats | 接收来自 Winlogbeat 的日志并将其复制到两个不同的 Redis 队列 |
| **Redis(Elasticsearch 队列)** | 192.168.56.10 | 6379 | TCP, RESP | Logstash 读取的队列,用于将日志发送到 Elasticsearch |
| **Redis(immudb 队列)** | 192.168.56.10 | 6379 | TCP, RESP | immudb 的复制队列(单独的键或数据库) |
| **Elasticsearch** | 192.168.56.10 | 9200(REST API),9300(传输) | HTTPS/TCP/TLS | 暴露 REST API,节点间通过内部协议通信 |
| **Kibana** | 192.168.56.10 | 5601 | HTTPS/TCP/TLS | 用于查询 Elasticsearch 的图形界面 |
| **immudb** | 192.168.56.10 | 3322(默认),9497(gRPC API) | TCP/gRPC | 从 Redis 队列读取日志以进行不可变历史化存储 |
## Windows Server → Debian 通信
本节介绍 VirtualBox Host-Only 网络的配置,用于在两台虚拟机之间建立直接通信:Windows Server(日志发送方)和 Debian(日志接收和处理方)。
## Host-Only 适配器配置(VirtualBox)
1. 打开 **VirtualBox** → `文件` → `主机网络管理器`
2. 点击 **创建** 添加新适配器
3. 配置:
- **IP**:`192.168.56.1`
- **子网掩码**:`255.255.255.0`
- **DHCP**:禁用
4. 将适配器分配给虚拟机作为 `适配器 2`:
- 模式:`Host-Only`
- 名称:例如 `vboxnet0`
## 静态 IP 配置(Windows Server)
1. 打开 `网络连接中心` > 修改 `适配器设置`
2. 选择连接到 `vboxnet0` 的接口("以太网 2")
3. 点击 `属性` > `TCP/IPv4` 并设置:
- **IP**:`192.168.56.2`
- **子网掩码**:`255.255.255.0`
- **网关**:留空
4. 使用 ```ipconfig``` 验证
```
C:\Users\vboxuser> ipconfig
Windows IP Configuration
Ethernet adapter Ethernet:
Connection-specific DNS Suffix . : xyz.lan
IPv6 Address. . . . . . . . . . . : fd00::be82:30db:2cc8:18ab
Link-local IPv6 Address . . . . . : fe80::b789:33f2:febd:1d7%14
IPv4 Address. . . . . . . . . . . : 10.0.2.15
Subnet Mask . . . . . . . . . . . : 255.255.255.0
Default Gateway . . . . . . . . . : fe80::2%14
10.0.2.2
Ethernet adapter Ethernet 2:
Connection-specific DNS Suffix . :
Link-local IPv6 Address . . . . . : fe80::6894:81ba:3678:5341%13
IPv4 Address. . . . . . . . . . . : 192.168.56.2 <---
Subnet Mask . . . . . . . . . . . : 255.255.255.0 <---
Default Gateway . . . . . . . . . :
```
## 网络接口配置(Debian)
直接修改 ```/etc/network/``` 目录下的 ```interfaces``` 文件来配置网络接口。
```
# 包含额外配置(如有)
source /etc/network/interfaces.d/*
# Loopback 接口
auto lo
iface lo inet loopback
# NAT 接口(互联网)
auto enp0s3
iface enp0s3 inet dhcp
# VirtualBox 主机专用网络(内部网络)接口
auto enp0s8
iface enp0s8 inet static
address 192.168.56.10 <---
netmask 255.255.255.0 <---
```
## 防火墙规则:允许从 Debian 到 Windows Server 的 ping
需要为 Windows Server 创建规则,因为 Windows 防火墙默认阻止传入的 ICMP Echo Request(ping)数据包。
### 分步操作
#### 1. 打开 Windows Defender 高级安全防火墙
```
Premere il tasto Windows, digitare "Windows Defender Firewall with Advanced Security", successivamente aprire l’app.
```
#### 2. 选择"入站规则"
```
Nel pannello a sinistra, cliccare su Inbound Rules.
```
#### 3. 创建新规则
```
Nel pannello a destra, cliccare su New Rule... (Nuova regola).
```
#### 4. 选择规则类型
```
Selezionare Custom (Personalizzata), poi cliccare su Avanti.
```
#### 5. 选择协议
```
Alla voce “Protocol and Ports” (Protocollo e porte), scegliere ICMPv4 dal menu a tendina “Protocol type”.
```
#### 6. 指定 ICMP 数据包类型
```
Cliccare sul pulsante Customize accanto a ICMP Settings.
Selezionare Echo Request (il tipo usato dal ping).
Confermare con OK.
```
#### 7. IP 地址
```
Nella schermata “Scope” lasciare l’opzione “Any IP address” (qualsiasi indirizzo) sia per origine sia per destinazione (, o limita all’IP del Debian se si vuole maggiore sicurezza).
```
#### 8. 规则操作
```
Selezionare Allow the connection (Consenti la connessione).
```
#### 9. 规则应用时机
```
Spuntare tutte le caselle: Domain, Private, Public.
```
#### 10. 为规则命名
```
Scrivere un nome tipo "Consenti ping ICMP Echo Request" e confermare.
```
### 验证
```
vboxuser@vbox:~$ ip link
1: lo: mtu 65536 qdisc noqueue state UNKNOWN mode DEFAULT group default qlen 1000
link/loopback 00:00:00:00:00:00 brd 00:00:00:00:00:00
2: enp0s3: mtu 1500 qdisc fq_codel state UP mode DEFAULT group default qlen 1000
link/ether 08:00:27:e0:87:cc brd ff:ff:ff:ff:ff:ff
3: enp0s8: mtu 1500 qdisc fq_codel state UP mode DEFAULT group default qlen 1000 <---
link/ether 08:00:27:9d:3a:10 brd ff:ff:ff:ff:ff:ff
#Applicazione delle modifiche
vboxuser@vbox:~$ sudo systemctl restart networking
#Se necessario utilizzare il seguente comando (o inalternativa riaviare la vm)
vboxuser@vbox:~$ sudo ifdown enp0s8 && sudo ifup enp0s8
```
```
#Verifica che l'indirizzo sia stato applicato correttamente
vboxuser@vbox:~$ ip a
1: lo: mtu 65536 qdisc noqueue state UNKNOWN group default qlen 1000
link/loopback 00:00:00:00:00:00 brd 00:00:00:00:00:00
inet 127.0.0.1/8 scope host lo
valid_lft forever preferred_lft forever
inet6 ::1/128 scope host noprefixroute
valid_lft forever preferred_lft forever
2: enp0s3: mtu 1500 qdisc fq_codel state UP group default qlen 1000
link/ether 08:00:27:e0:87:cc brd ff:ff:ff:ff:ff:ff
inet 10.0.2.15/24 brd 10.0.2.255 scope global dynamic enp0s3
valid_lft 84997sec preferred_lft 84997sec
inet6 fd00::a00:27ff:fee0:87cc/64 scope global dynamic mngtmpaddr
valid_lft 86245sec preferred_lft 14245sec
inet6 fe80::a00:27ff:fee0:87cc/64 scope link
valid_lft forever preferred_lft forever
3: enp0s8: mtu 1500 qdisc fq_codel state UP group default qlen 1000
link/ether 08:00:27:9d:3a:10 brd ff:ff:ff:ff:ff:ff
inet 192.168.56.10/24 brd 192.168.56.255 scope global enp0s8 <---
valid_lft forever preferred_lft forever
inet6 fe80::a00:27ff:fe9d:3a10/64 scope link
valid_lft forever preferred_lft forever
```
### 从 Debian 到 Windows Server 的 ping
```
vboxuser@vbox:~$ ping -c 192.168.56.2
PING 192.168.56.2 (192.168.56.2) 56(84) bytes of data.
64 bytes from 192.168.56.2: icmp_seq=1 ttl=128 time=6.43 ms
64 bytes from 192.168.56.2: icmp_seq=2 ttl=128 time=1.18 ms
64 bytes from 192.168.56.2: icmp_seq=3 ttl=128 time=1.16 ms
--- 192.168.56.2 ping statistics ---
3 packets transmitted, 3 received, 0% packet loss, time 2003ms <---
rtt min/avg/max/mdev = 1.160/2.923/6.434/2.482 ms
```
### 从 Windows Server 到 Debian 的 ping
```
C:\Users\vboxuser>ping 192.168.56.10
Pinging 192.168.56.10 with 32 bytes of data:
Reply from 192.168.56.10: bytes=32 time=1ms TTL=64
Reply from 192.168.56.10: bytes=32 time=1ms TTL=64
Reply from 192.168.56.10: bytes=32 time=1ms TTL=64
Reply from 192.168.56.10: bytes=32 time=1ms TTL=64
Ping statistics for 192.168.56.10:
Packets: Sent = 4, Received = 4, Lost = 0 (0% loss), <---
Approximate round trip times in milli-seconds:
Minimum = 1ms, Maximum = 1ms, Average = 1ms
```
## Winlogbeat
Winlogbeat 是一个软件代理,用于收集并发送 Windows 事件日志到 **Redis**、**Logstash** 和 **Elasticsearch** 端点。
### Winlogbeat 功能
1. **事件日志监控**:实时读取来自 `Security`、`System`、`Application`、`ForwardedEvents` 等日志的事件。
2. **智能过滤**:仅收集特定的 `event_id`、提供程序或级别,减少噪音。
3. **日志发送**:将数据转发到 Redis、Logstash 和 Elasticsearch。
4. **ECS 支持**:根据 Elastic Common Schema 标准化数据。
5. **内置 Kibana 仪表板**:提供开箱即用的可视化功能。
## 目录层次结构:Winlogbeat
```
Winlogbeat/
├── winlogbeat.exe
├── winlogbeat.yml
├── winlogbeat.reference.yml
├── install-service-winlogbeat.ps1
├── uninstall-service-winlogbeat.ps1
├── fields.yml
├── LICENSE.txt, NOTICE.txt, README.md
├── .build_hash.txt
├── winlogbeat.yml_bk
├── data/
│ ├── winlogbeat.yml
│ └── meta.json
└── module/
├── powershell/
│ └── config/
│ └── winlogbeat-powershell.js
├── security/
│ ├── dashboards.yml
│ └── config/
│ └── winlogbeat-security.js
└── sysmon/
└── config/
└── winlogbeat-sysmon.js
```
## winlogbeat.yml
路径:```/Winlogbeat/data/winlogbeat.yml```
## 安装为 Windows 服务
```
cd C:\\Winlogbeat
.\install-service-winlogbeat.ps1
Start-Service winlogbeat
Set-Service -Name winlogbeat -StartupType Automatic
```
## 卸载
```
Stop-Service winlogbeat
.\uninstall-service-winlogbeat.ps1
```
## 调试与验证
- **本地日志**:`C:\\ProgramData\\winlogbeat\\Logs\\winlogbeat.log`
- **验证 Redis 输出**:
redis-cli -h 192.168.56.10 -p 6379
LRANGE winlogbeat 0 0
- **手动测试**:
.\winlogbeat.exe -c winlogbeat.yml -e -v
## Logstash
Logstash 是一个开源管道,用于实时管理、处理和转发来自不同来源的数据到一个或多个目标。
在本系统中,Logstash 接收来自 Winlogbeat 的 JSON 格式事件,对其进行处理,然后将数据输出到两个不同的 Redis 队列,实现流复制:
- 第一个队列用于 Elasticsearch 的数据摄取和分析;
- 第二个队列用于 immuDB 的历史化存储。
## 目录层次结构:Logstash
```
/etc/logstash/
├── conf.d/
│ ├── logstash.conf
│ └── logstash1.conf
├── jvm.options
├── log4j2.properties
├── logstash.yml
├── pipelines.yml
└── startup.options
```
## logstash.yml
路径:```/etc/logstash/logstash.yml```
Logstash 的主配置文件,用于定义内部数据的存档目录。
```
# ------------ 数据路径 ------------
# Logstash 及其插件使用的目录
#for any persistent needs. Defaults to LOGSTASH_HOME/data
# path.data: /var/lib/logstash
# ```
## logstash.conf
路径:```/etc/logstash/conf.d/logstash.conf```
为 Logstash 管道定义的配置文件,用于从 ``Winlogbeat``(通过 Beats 协议)接收并将其复制到两个不同的 Redis 队列。
```
# 输入:通过 Beats 协议从 Winlogbeat 接收数据,端口 5044
input {
beats {
port => 5044
}
}
filter {
# Inserire eventuali filtri o parsing (ad esempio, grok, mutate, ecc.)
}
# 输出:将处理后的数据发送到两个不同的 Redis 队列(复制)
output {
# 输出 (1):将数据发送到 Redis 队列 "redis-queue-elastic"
redis {
host => "192.168.56.10"
port => 6379
password => ""
key => "redis-queue-elastic"
data_type => "list"
db => 0
}
# output (2): manda gli stessi dati alla coda Redis "redis-queue-immudb"
redis {
host => "192.168.56.10"
port => 6379
password => ""
key => "redis-queue-immudb"
data_type => "list"
db => 0
}
}
```
## logstash1.conf
路径:```/etc/logstash/conf.d/logstash1.conf```
配置文件用于从 ```Redis``` 读取日志并发送到 ```Elasticsearch```。
```
input {
redis {
host => "192.168.56.10" # Indirizzo del server Redis dove leggere la coda
data_type => "list" # Tipo struttura dati usata in Redis: lista
port => 6379 # Porta del server Redis: 6379 è quella di default
key => "redis-queue-elastic" # Key Redis: nome lista Redis da cui Logstash legge i dati
password => "" # PSW key Redis
codec => json # Codec usato per decodificare i dati ricevuti da Redis: formato JSON, quindi Logstash li trasforma automaticamente in oggetti leggibili e filtrabili
}
}
filter {
#Qui è possibile inserire eventuali filtri per elaborare o arricchire i dati ricevuti prima di inviarli ad Elastic
}
output {
elasticsearch {
hosts => ["http://192.168.56.10:9200"] # Indirizzo del cluster Elasticsearch (modifica in base all'ambiente che si utilizza)
index => "from-redis-%{+YYYY.MM.dd}" # Nome dell'indice su Elasticsearch. Viene usata una data dinamica per indicizzazione giornaliera
# Autenticazione Elasticsearch e certificato ssl
user => ""
password => ""
ssl => true
cacert => "/etc/elasticsearch/certs/ca.crt"
}
stdout{
codec => rubydebug
}
}
```
## pipelines.yml
路径:```/etc/logstash/pipelines.yml```
Logstash 独立管道的定义
• ```main```:用于 immudb 的管道,
• ```elastic-pipeline```:用于 elasticsearch 的管道。
```
# 这是定义管道的地方。可以定义多个管道。
# 有关多管道的更多信息,请参阅文档:
# https://www.elastic.co/guide/en/logstash/current/multiple-pipelines.html
# immudb 管道
- pipeline.id: main
path.config: "/etc/logstash/conf.d/logstash.conf"
# elasticsearch 管道
- pipeline.id: elastic-pipeline
path.config: "/etc/logstash/conf.d/logstash1.conf"
```
## Redis
Redis 是一个开源的高性能内存键值存储,用作**分布式队列**系统,实现日志流的分离。凭借对列表(`LPUSH`、`RPUSH`、`LPOP`、`BRPOP`、`LLEN` 等)的原生支持,Redis 可以实现简单快速的 `FIFO` 队列,用于在多个组件之间异步管理日志、事件或消息。它是分布式架构中理想的临时缓冲区或轻量级代理。
Redis 配置文件:```/etc/redis/redis.conf```
```
/etc/redis/
├── redis.conf
└── redis.conf.save
```
## 访问和验证 Redis 队列
访问远程 Redis 服务器并列出可用的键,以验证两个队列的存在:
```
vboxuser@vbox:/$ redis-cli -h 192.168.56.10
192.168.56.10> auth inserisci_la_tua_password
OK
192.168.56.10> keys *
1) "redis-queue-immudb"
2) "redis-queue-elastic
```
验证日志是否已正确插入到两个 Redis 队列中:
```
192.168.56.10> LLEN redis-queue-immudb
(integer) 144
192.168.56.10> LLEN redis-queue-elastic
(integer) 144
```
## Immudb
日志归档通过 immuDB 处理,这是一个设计用于确保数据完整性的不可变数据库。
日志以键值结构保存,其中:
• **键**:日志的唯一标识符。
• **值**:日志本身的 JSON 内容。
此结构可以实现:
• 确保数据的完整性和不可篡改性;
• 通过日志键前缀进行快速搜索和检索。
### 使用的数据库
immuDB 中存在两个独立的数据库:
• **defaultdb**:用于测试的默认数据库
• **logs_immudb**:专用于审计日志
## 目录层次结构(immudb 配置文件)
```
/etc/immudb/
└── immudb.toml
```
## immudb.toml
路径:```/etc/immudb/immudb.toml```
immudb 服务的主配置文件。
```
# 端口、数据目录、认证
address = "0.0.0.0"
admin-password = ''
auth = true
certificate = ''
clientcas = ''
dbname = 'logs_immudb'
detached = 'false'
devmode = true
dir = '/var/lib/immudb'
network = 'tcp'
port 3322
# 带文件名的日志路径
logfile = 'immudb.log'
mtls = false
pidfile = '/var/lib/immudb/immudb.pid'
PKEY = ''
log-level = "DEBUG"
[database]
gc-enabled = 'true'
retention-period = "24h"
```
在 ``immudb.toml`` 配置文件中,指定了数据库运行的路径:``/var/lib/immudb`` 是主数据目录,包含:
• 配置和使用的数据库(``defaultdb`` 和 ``logs_immudb``)。
• 数据的不可变结构(Merkle 树、索引、事务日志)。
```
/var/lib/immudb
├── defaultdb
├── logs_immudb
├── immudb.identifier
├── immudb.pid
├── immulog
| └──immudb.log
└── systemdb
```
## 登录
```
vboxuser@vbox:~$ immuadmin login inerisci_tuo_username
Password: inserisci_la_tua_password
logged in
```
## 创建带有保留期的新数据库
```
vboxuser@vbox:~$ immuadmin database create nome_database --retention-period=24h
```
## 列出现有数据库
```
vboxuser@vbox:~$ immuadmin database list
2 database(s)
- -------------- ---------- ---------- ------ ---------- --------- ------------
# 数据库名称 创建时间 创建者 状态 是否副本 磁盘大小 交易数
- -------------- ---------- ---------- ------ ---------- --------- ------------
1 defaultdb 2025-06-18 systemdb LOADED FALSE 21.3 MB 6045
2 logs_immudb 2025-06-17 nome_utente LOADED FALSE 3.9 MB 5371
- -------------- ---------- ---------- ------ ---------- --------- ------------
```
## queue_consumer.py
路径:``/var/consumer-immudb/queue_consumer.py``
## 描述
`queue_consumer.py` 脚本消费 Redis 队列 `redis-queue-immudb`,提取 JSON 格式的日志并通过键值(KV)模式将其插入 immudb 数据库。
## 工作原理
• 日志通过 `BLPOP` 命令以阻塞模式从 Redis 队列中消费。
• 每个提取的日志都是 JSON 字符串,被反序列化为数据对象。
• JSON 内容经过键排序重组以确保序列化的一致性。
• 计算日志的 `SHA-256` 哈希值,用作插入数据库的`键`。
• 键通过连接前缀、当前时间戳和计算的`哈希值`构建。
• 日志以键值(KV)模式存储在 immudb 数据库中,键和值都编码为字节。
## 主要函数
### SHA-256 哈希计算
```
def hash_key(data: str) -> str:
return hashlib.sha256(data.encode()).hexdigest()
```
接收字符串 `data` 作为输入,将其编码为字节并计算 SHA-256 哈希。返回十六进制格式的哈希值,用于生成唯一键。
### 从 Redis 阻塞读取和 JSON 反序列化
```
item = r.blpop(REDIS_QUEUE_NAME, timeout=5)
if item:
_, raw_log = item
try:
log_data = json.loads(raw_log)
except json.JSONDecodeError:
logging.warning(f"Log non valido JSON: {raw_log}")
continue
```
`blpop` 命令以阻塞模式从 Redis 队列中提取元素,超时时间为 5 秒。如果收到元素,获取内容(`raw_log`)并尝试将其反序列化为 `log_data` 对象。如果 JSON 无效,则忽略并继续。
### 有序序列化和键生成
```
log_str = json.dumps(log_data, sort_keys=True)
ts = int(time.time())
key = f"log:{ts}:{hash_key(log_str)}"
```
日志以键排序的 JSON 字符串序列化(`sort_keys=True`)以确保一致性。获取当前时间戳(秒),并通过连接前缀(`log:`)、`时间戳`和序列化日志的 `SHA-256` 哈希值来构建唯一键。
### 以 KV 模式插入 immudb 数据库
```
immu.set(key.encode(), log_str.encode())
```
键值对使用 `set` 方法插入 immudb 数据库。键和值都按要求编码为字节。
## 调试
### 插入 immudb
```
Jul 15 08:55:50 vbox python[2449]: 2025-07-14 08:55:50,220 - INFO - [KV] Log inserito in immudb con chiave: log:1752735391:fccfd23ab0d1853197e28b5cb3378d848df207f1f0255a2c0336ddf296c023cc
```
### 获取键
```
immuclient>get log:1752735391:fccfd23ab0d1853197e28b5cb3378d848df207f1f0255a2c0336ddf296c023cc
tx: 4871
rev: 1
key: log:1752735391:fccfd23ab0d1853197e28b5cb3378d848df207f1f0255a2c0336ddf296c023cc
value: {"@timestamp": "2025-07-15T08:07:13.681Z", "@version": "1", "agent": {"ephemeral_id": "60973edc-97e2-4e08-9d4d-b8e8b7d89d60", "hostname": "WIN-S", "id": "c156a342-40dc-47ca-977a-f100ebd8e89f",
"name": "WIN-S", "type": "winlogbeat", "version": "7.17.7"}, "ecs": {"version": "1.12.0"}, "event": {"action": "None", "code": "7036", "created": "2025-07-17T06:56:26.240Z", "kind": "event", "provider":
"Service Control Manager"}, "host": {"name": "xxxxx"}, "log": {"file": {"path": "C:\\Users\\vboxuser\\Desktop\\System_log_DC33.evtx"}, "level": "information"}, "message": "The Windows Modules
Installer service entered the running state.", "tags": ["beats_input_codec_plain_applied"], "winlog": {"activity_id": "{811a6918-1b41-4753-815e-979e5d5b2bc7}", "api": "wineventlog", "channel": "System",
"computer_name": "XXX.YYY.lan", "event_data": {"Binary": "540072007500730074006500640049006E007300740061006C006C00650072002F0034000000", "param1": "Windows Modules Installer", "param2": "running"},
"event_id": "7036", "keywords": ["Classic"], "opcode": "Info", "process": {"pid": 672, "thread": {"id": 10596}}, "provider_guid": "{555908d1-a6d7-4695-8e1e-26931d2012f4}", "provider_name": "Service Control
Manager", "record_id": 795414, "task": "None"}}
```
## Redis 验证:队列消费
```
vboxuser@vbox:/$ redis-cli -h 192.168.56.10
192.168.56.10> auth inserisci_la_tua_password
OK
192.168.56.10> keys *
1) "redis-queue-elastic"
192.168.56.10> LLEN "redis-queue-immudb"
(integer) 0
```
队列已正确消费,日志已保存到 immuDB。
## 保留期
已在数据库 `logs_immudb` 上配置了 24 小时的`保留期`,以自动从值日志中删除旧数据,减少磁盘空间占用,确保日志的高效和安全管理。配置是在创建数据库时通过以下命令完成的:
```
immuadmin database create logs_immudb --retention-period=24h
```
要验证 `logs_immudb` 数据库中 `logs` 表的`保留期`是否正常工作,可以对之前插入的键执行 `get` 操作。如果该键因保留期到期而被 immudb 自动删除,命令将返回不存在的消息。
```
immuclient get log:1752735391:fccfd23ab0d1853197e28b5cb3378d848df207f1f0255a2c0336ddf296c023cc
immuclient tbtree: key not found
```
这确认该键已不存在,因为它已根据配置的保留期被系统自动删除。
## Elasticsearch 中 from-redis-* 索引的管理
在 Elasticsearch 中,日志数据通过 Logstash 从 Redis 收集。为了更好地处理大量且持续的日志数据,数据按收集日期组织到独立的 Elasticsearch 索引中。
每个索引都是一个隔离的"容器",仅包含在特定日期生成的文档,命名遵循 `from-redis-YYYY.MM.DD` 模式。
此方法可以实现:
• 数据的**时间组织**,便于在特定时间范围内进行搜索和分析。
• **更好的性能**,因为索引更小且更容易管理。
• **简化的保留期管理**,可以删除整个过时索引。
• **水平扩展**,避免单个索引随时间过度增长。
• **清晰的命名**,标识数据来源(Redis),便于与分析、自动化和可视化工具集成。
### 每日索引 `from-redis-YYYY.MM.DD`
从 Redis 收集的日志通过每日索引在 Elasticsearch 中索引,名称格式为 `from-redis-2025.07.11`、`from-redis-2025.07.10` 等。
这意味着每天都会创建一个新索引,包含当天所有的日志。
可以通过删除整个索引来清除历史数据,而无需逐个删除文档。
这种方法确保了对数据保留期的精细控制。
命令:
```
curl -u user:password --cacert /etc/elasticsearch/certs/ca.crt -X GET "https://192.168.56.10:9200/_cat/indices?v"
health status index uuid pri rep docs.count docs.deleted store.size pri.store.size
yellow open from-redis-2025.07.01 ISqshOdJQTynHlVYOAB8xw 1 1 9451 0 4.4mb 4.4mb
yellow open from-redis-2025.07.02 LQUa1aatTnS2RpjMZnzqKA 1 1 49649 0 24.1mb 24.1mb
yellow open from-redis-2025.07.03 U1PF-URXSdeD98aso_3bGw 1 1 719 0 1000.5kb 1000.5kb
yellow open from-redis-2025.07.10 3pJqrCOpTtaCj91inCiTow 1 1 66863 0 32.9mb 32.9mb
yellow open from-redis-2025.07.11 SuODhIU2TPiLxHH2Rmd1nA 1 1 12992 0 7.1mb 7.1mb
```
可以列出所有索引。
### 自动轮换和删除
为了管理存储并自动删除过时索引,实现了一个 Bash 脚本,删除所有超过 72 小时的 `from-redis-*` 索引。脚本计算截止日期,将其与索引名称中的日期进行比较,并通过 HTTPS 认证使用 Elasticsearch 的 `REST API` 进行删除。
脚本路径 `/usr/local/bin/delete_old_from_redis_indices.sh`
```
#!/bin/bash
ES_HOST="https://192.168.56.10:9200"
ES_USER="user"
ES_PASS="password"
CUTOFF_DATE=$(date -d '3 days ago' +%Y-%m-%d)
echo "Rimuovo gli indici from-redis-* più vecchi di $CUTOFF_DATE"
INDICES=$(curl -s -u $ES_USER:$ES_PASS -k "$ES_HOST/_cat/indices/from-redis-*?h=index" | sort)
for INDEX in $INDICES; do
#Conversione formato data da YYYY.MM.DD a YYYY-MM-DD
IDX_DATE=$(echo $INDEX | sed -E 's/from-redis-([0-9]{4})\.([0-9]{2})\.([0-9]{2})/\1-\2-\3/')
IDX_TS=$(date -d "$IDX_DATE" +%s 2>/dev/null)
CUTOFF_TS=$(date -d "$CUTOFF_DATE" +%s)
if [ -z "$IDX_TS" ]; then
echo "Formato data non valido per indice $INDEX, salto."
continue
fi
if [ $IDX_TS -lt $CUTOFF_TS ]; then
echo "Elimino indice $INDEX (data: $IDX_DATE)"
curl -u $ES_USER:$ES_PASS -X DELETE "$ES_HOST/$INDEX" -k
else
echo "Mantengo indice $INDEX (data: $IDX_DATE)"
fi
done
```
### 测试
已执行 24 小时保留期的测试,因此在本例中,早于 2025-07-10 的索引将被删除:
```
root@vbox:~# sudo /usr/local/bin/delete_old_from_redis_indices.sh
Rimuovo gli indici from-redis-* più vecchi di 2025-07-10
{"acknowledged":true}Elimino indice from-redis-2025.07.01 (data: 2025-07-01)
{"acknowledged":true}Elimino indice from-redis-2025.07.02 (data: 2025-07-02)
{"acknowledged":true}Elimino indice from-redis-2025.07.03 (data: 2025-07-03)
{"acknowledged":true}Elimino indice from-redis-2025.07.10 (data: 2025-07-10)
{"acknowledged":false}Mantengo indice from-redis-2025.07.11 (data: 2025-07-11)
```
可以看到,索引 `from-redis-2025.07.11` 未被删除,因为它是当前索引,不在截止日期(2025-07.10)之前的索引范围内。
可以通过列出删除后所有可用的索引进行进一步验证:
```
root@vbox:~# curl -u username:password -k "https://192.168.56.10:9200/_cat/indices?v&s=index"
health status index uuid pri rep docs.count docs.deleted store.size pri.store.size
yellow open from-redis-2025.07.11 SuODhIU2TPiLxHH2Rmd1nA 1 1 12992 0 7.1mb 7.1mb
```
从输出可以看到,索引已正确删除,除了 `from-redis-2025.07.11`,因为它不符合删除条件(属于当前日期)而被保留。
## 使用 Elasticsearch 和 Kibana 进行日志分析和图形化用户体验
## Elasticsearch
### 目录层次结构(Elasticsearch 配置文件)
```
/etc/elasticsearch/
├── certs/
│ ├── ca.crt # Certificato pubblico della Certificate Authority (CA) usata per firmare gli altri certificati.
│ ├── ca.key # Chiave privata della CA (va tenuta segreta).
│ ├── ca.srl # Seriale CA, tiene traccia dei certificati già emessi.
│ ├── elasticsearch.crt # Certificato pubblico di Elasticsearch, firmato dalla CA.
│ ├── elasticsearch.csr # Richiesta di firma del certificato per Elasticsearch.
│ ├── elasticsearch.key # Chiave privata di Elasticsearch, usata per TLS.
│ ├── kibana.crt # Certificato pubblico di Kibana, firmato dalla CA.
│ ├── kibana.csr # Richiesta di firma del certificato per Kibana.
│ └── kibana.key # Chiave privata di Kibana (usata da Kibana, ma conservata qui).
|
├── elasticsearch.keystore # File keystore sicuro con segreti (es. password, token).
├── elasticsearch-plugins.example.yml
├── elasticsearch.yml # File principale di configurazione di Elasticsearch.
├── jvm.options # Opzioni JVM (heap size, GC, ecc.).
├── jvm.options.d/ # Directory per opzioni JVM aggiuntive.
├── log4j2.properties # Configurazione logging di Elasticsearch.
├── role_mapping.yml # Mappatura ruoli utenti.
├── roles.yml # Definizione dei ruoli RBAC.
├── users # File contenente gli utenti locali (realm `file`).
└── users_roles # Associazione tra utenti e ruoli.
```
Elasticsearch 是一个分布式搜索和分析引擎,设计用于存储大量数据并实现非常快速和灵活的搜索。在这种情况下,Elasticsearch 收集和索引日志,以便通过 Kibana 进行深入分析和实时可视化。来自其他组件的数据以 JSON 格式到达,被索引以便可以快速灵活地查询,例如按 event.code、host.name、@timestamp 和其他字段查询。
如前所述,Redis 队列 ``redis-queue-elastic`` 中的日志由 Logstash 消费,Logstash 对其进行处理并将其发送到 Elasticsearch 进行日志的存储和搜索。
## Kibana
## 目录层次结构(Kibana 配置文件)
```
/etc/kibana/
├── certs/
│ ├── ca.crt # Certificato della CA usato da Kibana per validare Elasticsearch.
│ ├── kibana.crt # Certificato pubblico usato da Kibana per TLS.
│ └── kibana.key # Chiave privata associata al certificato di Kibana.
|
├── kibana.keystore # File keystore per password e token sensibili.
├── kibana.yml # File principale di configurazione di Kibana.
└── node.options # Opzioni del nodo Kibana (es. parametri Node.js).
```
Kibana 是 Elasticsearch 的图形界面。允许通过仪表板、图表和交互式工具(如 Discover、Visualize、Dashboard、Alerting)可视化和分析存储在 Elasticsearch 中的数据。