JanusGraph配置及Gremlin使用
作者:FancyPig | 发布时间: | 更新时间:
接着上一篇文章
data-postsbox="{"id":1238,"title":"Gephi安装与可视化插件安装","author":"FancyPig","author_id":1,"cover_image":"","cover_video":"","views":2298,"comment_count":0,"category":"cybersecurity","is_forum_post":false}">{"id":1238,"title":"Gephi安装与可视化插件安装","author":"FancyPig","author_id":1,"cover_image":"","cover_video":"","views":2298,"comment_count":0,"category":"cybersecurity","is_forum_post":false}
在windows电脑下部署JanusGraph Server,Kali Linux里部署的JanusGraph,使用Gremlin进行连接操作数据
JanusGraph Linux环境安装
JanusGraph安装
Releases包下载
JanusGraph Releases安装包地址
https://github.com/JanusGraph/janusgraph/releases
解压缩
这里下载到opt目录下并解压缩
unzip ~/janusgraph-0.2.0-hadoop2.zip
附录:安装最新版本Elastic Search
针对CentOs内核的
下载并安装公共签名密钥
rpm --import https://artifacts.elastic.co/GPG-KEY-elasticsearch创建 yum 源文件
创建yum文件
vim /etc/yum.repos.d/elasticsearch.repo配置yum文件
[elasticsearch-7.x]
name=Elasticsearch repository for 7.x packages
baseurl=https://artifacts.elastic.co/packages/7.x/yum
gpgcheck=1
gpgkey=https://artifacts.elastic.co/GPG-KEY-elasticsearch
enabled=1
autorefresh=1
type=rpm-md
安装
yum install -y elasticsearch重新加载服务配置文件
systemctl daemon-reload配置并开启Elastic Search服务
systemctl enable elasticsearch
systemctl start elasticsearch
检查Elasticsearch是否启动完成
curl http://localhost:9200针对Ubuntu、Debian内核的
导入公钥
wget -qO - https://artifacts.elastic.co/GPG-KEY-elasticsearch | sudo apt-key add -将Elasticsearch存储库添加到系统中
sudo sh -c 'echo "deb https://artifacts.elastic.co/packages/7.x/apt stable main" > /etc/apt/sources.list.d/elastic-7.x.list'更新packages索引并安装Elasticsearch引擎
sudo apt update
sudo apt install elasticsearch
安装过程完成后,启动并启用该服务
sudo systemctl enable elasticsearch.service --now验证安装是否成功
要验证Elasticsearch是否正在运行,请用于curl将HTTP请求发送到本地主机上的端口9200
curl -X GET "localhost:9200/"附录:安装固定版本Elastic Search
一般JanusGraph、Elastic Search、Hbase是集成在一起使用的,我们也可以安装Elastic search
下载Elastic Search
wget https://artifacts.elastic.co/downloads/elasticsearch/elasticsearch-6.2.4.rpm安装rpm包
rpm -i elasticsearch-6.2.4.rpm重新加载服务配置文件
systemctl daemon-reload配置并开启Elastic Search服务
systemctl enable elasticsearch
systemctl start elasticsearch
检查Elasticsearch是否启动完成
curl http://localhost:9200Gremlin使用教程
启动Gremlin
然后打开janusgraph-0.2.0-hadoop2目录
cd janusgraph-0.2.0-hadoop2/运行gremlin
bin/gremlin.sh看到下面的图案代表已经启动成功了
         \,,,/
         (o o)
-----oOOo-(3)-oOOo-----
连接JanusGraph Server
使用Gephi配置JanusGraph Server
新建工程

重命名工作区
给工作区进行重命名

这里命名为test,后面使用Gremlin连接的时候也需要连接test工作区

启动JanusGraph Server
开启 JanusGraph Server
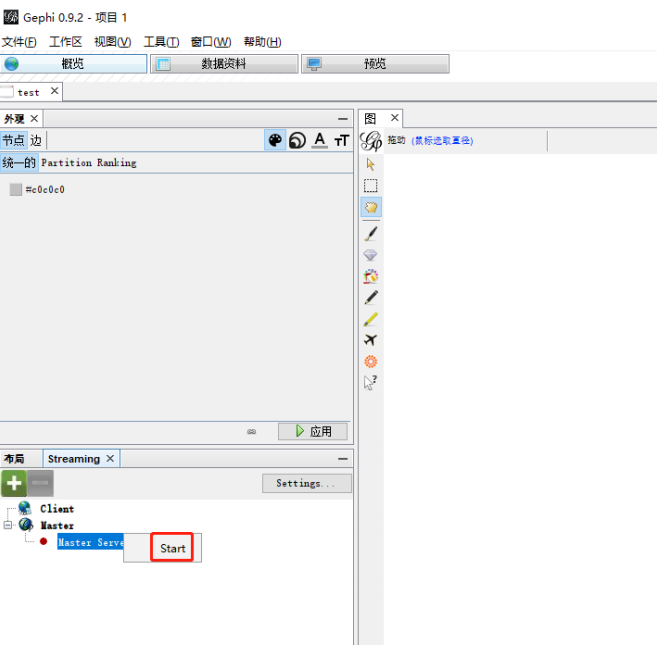
如果有个性化的需求也可以修改端口
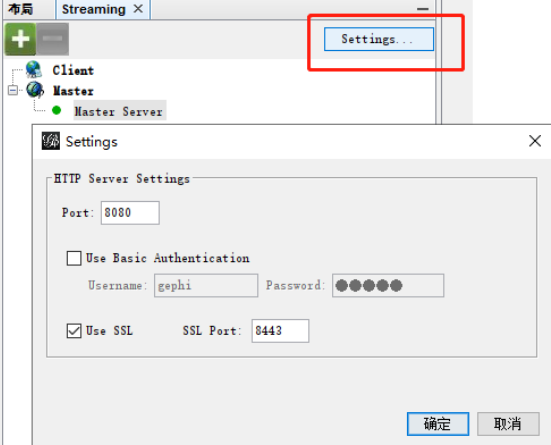
如果开启后访问127.0.0.1:8080端口提示404,请检查你更新或者安装插件后是否进行了重启的操作
使用Gremlin连接JanusGraph
启动Gremlin
在opt/janusgraph-0.2.3-hadoop2下启动Gremlin
bin/gremlin.sh使用tinkerpop.gephi插件
使用tinkerpop.gephi插件
:plugin use tinkerpop.gephi配置tinkerpop.gephi插件
配置连接
:remote connect tinkerpop.gephi修改连接的IP地址
修改需要连接的host地址,即我们使用Gephi创建的JanusGraph Server的IP地址
:remote config host 192.168.47.1修改需要连接的工作区
这里要连接的工作区就是我们上面设置的test
:remote config workspace test创建一个六边形的模型
graph = TinkerFactory.createModern()推送数据
:> graph然后在Gephi里就可以看到推送的数据了
